Target simulation for UHF RFID DoA estimation systems
Philipp Eschlwech
Erwin Biebl
In this work a new method for the evaluation of UHF RFID Direction of Arrival (DoA) estimation systems is developed and demonstrated. Instead of simulating the system performance or manually measuring it in realistic or ideal environments, a method for the evaluation of DoA systems using received signals produced by a target simulator is proposed. The simulator generates the signals for each channel of the DoA estimator by attenuating and phase shifting the signals of an UHF RFID chip to replicate the signal propagation conditions for a chosen tag distance and arrival angle. This combines the advantages of the simulative approach and real world evaluation: it is fast, reproducible and doesn't require special measurement environments. To facilitate this method, plane and spherical wave signal models for the simulation of RFID targets are derived, multichannel phase-shifting and attenuation hardware for the simulation of such signals is presented and a demonstrative evaluation of a RFID DoA estimation system is performed, replicating evaluation scenarios in non reflective and multipath environments.
- Article
(4810 KB) - Full-text XML
- BibTeX
- EndNote
With the increase of digital monitoring and control systems in production and logistics, the demand for a manifold of sensory input systems is rising steadily (Broy and Geisberger, 2012). One technology that has gained more traction is Radio Frequency Identification (RFID). It allows for remote reading and writing of identification data onto RFID tags affixed to arbitrary objects. While the first RFID systems operated in the LF and HF bands and were limited to read ranges of only a couple of centimeters, modern UHF-RFID systems are able to achieve read ranges up to 15 m (Finkenzeller, 2015). This increase in the possible read range has pushed the demand for localization methods to determine not only that a tag is present, but also where it is currently positioned. Multiple different approaches were evaluated, starting from rudimentary signal strength based methods (Kim et al., 2007) over traditional ranging via frequency modulated continuous-wave (FMCW) radar (Heidrich et al., 2009) to Direction of Arrival (DoA) estimating systems (Azzouzi et al., 2011). DoA estimation can determine the angle from which the tag response signal is impinging on the receiving system. This is achieved by recording the signal with an array of antennas and subsequent signal processing. Dependent on the DoA, the signals received on each antenna undergo characteristic delays. A set of different Algorithms can be used to estimate the angle of arrival.
This enables many applications previously impossible or very complex to realize. Examples are the detection and monitoring of routes (Loibl and Biebl, 2012), tugger train loading surveillance (Johannes et al., 2016) and continuous inventory keeping in partly manually accessed warehouses (Bundesministerium für Bildung und Forschung, 2017). These applications have substantiated the need for RFID DoA estimation systems with high accuracy, high range and fast update rates.
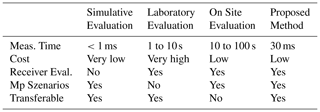
One obstacle in the development of these systems is the evaluation procedure. The evaluation methods can be divided in three different categories: simulative evaluation, laboratory evaluation and on site evaluation.
Simulative evaluation determines the performance of RFID DoA estimation systems by bypassing the used receiver structures and directly feeding simulated signals into the estimation algorithms in the system under test. These simulations can be implemented in a short amount of time, allow for tests in a vast number of different scenarios and are repeatable with different systems under test. Therefore they are often utilized as the first step in a systems evaluation procedure. Single- and multipath (mp) situations can be modeled, allowing for a wide range of reproducible scenarios. Besides all these advantages, the simulations have the drawback of not being able to evaluate the receiver structure of the DoA estimation system, a key component that vastly influences the overall system performance.
The second evaluation strategy, laboratory testing, is usually the next step after the simulations were conducted. The system is evaluated in highly idealized conditions, mainly in anechoic chambers. Such an evaluation is depicted in Fig. 1, in Ascher et al. (2017) and Hua et al. (2013) this evaluation method is used. The advantage over pure simulation results is the inclusion of the receiver and antenna array and thus these measurements deliver more complete performance data. However, many of the advantages of the simulative evaluation are lost. Measurements in anechoic chambers are very time consuming, especially if the positioning is even partially manual. The necessary equipment can be very costly and the size of the measurement chamber determines the maximum range between the RFID tag and the evaluation system that can be evaluated. Furthermore multipath scenarios can't be easily analyzed in this environment.
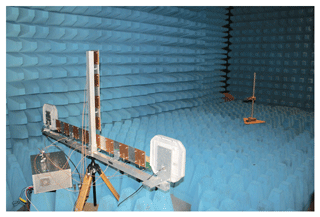
Figure 1Evaluation of a UHF RFID DoA estimation system in an anechoic chamber (taken from Ascher et al., 2017).
The third method, on site evaluation, measures the achievable accuracy of the DoA system in the actual surroundings where it will later be utilized. Examples for this can be found in Eberhardt et al. (2015), Vojtech et al. (2016) and Nosović et al. (2016). The main problem here is the positioning of the RFID tag relative to the estimation system. For the most parts it has to be done manually which dramatically increases the measurement time and often decreases positioning accuracy. Furthermore this type of measurement doesn't allow for comparable measurement results, since they are highly dependent on the exact setting in which the evaluation took place. This makes performance comparisons between two systems measured in different surroundings impossible.
Since all currently employed methods have drawbacks, an evaluation system that combines the flexibility, speed and comparability of the simulative evaluation with the holistic nature of laboratory and on site measurements is needed. To achieve this, an evaluation system is proposed, which tests the DoA system in a hardware in the loop setup by generating test signals which are directly fed into the receiving channels of the RFID DoA estimation system. This is called a target simulator, since it is able to reproduce the signals a RFID tag would produce at the receivers in varying conditions. In the following chapter the received signals of these systems are analyzed and a model for them will be presented. Following that, a hardware system for the generation of signals according to these signal models is shown. In the last section of this paper verification measurements with the target simulator are performed.
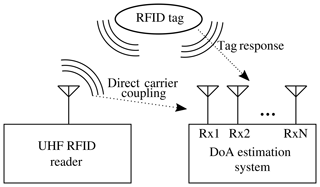
In order to model the signals of a DoA estimation system, a short overview of an UHF RFID system is given. Figure 2 depicts all of its components.
The first part consists of the RFID reader. It is the interrogator that queries the RFID tag for its response. While the tag is responding the reader emits a strong carrier signal which is modulated by the tag via backscatter modulation. The last component of the system is the DoA estimator itself, which consists of a N-element antenna array with a coherent multichannel receiver and the signal processing hardware. The array receives two different signal components: the carrier signal directly transmitted from the RFID reader and the tag response. The transmitted carrier is a harmonious signal with the frequency fc. For UHF-RFID the carrier frequency ranges between 865 to 868 MHz in Europe and 902 to 928 MHz in North America (Finkenzeller, 2015). The signals transmitted by the RFID tag stag(t) are a narrowband modulated version of the carrier signal. Altogether there are three different signal propagation path segments of interest, from the reader to the tag (rt), from the tag to the receiving array (ta) and from the reader via the RFID tag to the array (rta). These introduced abbreviations will be used to denote the respective path segments.
In the following subsections different signal models for the far-field case, spherical wave propagation and multipath situations are presented, followed by a closer discussion about direct carrier coupling.
2.1 Plane wave signal model
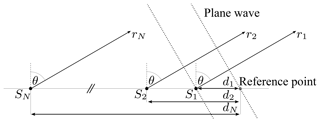
If a signal source transmitting the narrowband signal s(t) is sufficiently far away from the receiving antenna array, so that the range r is much bigger than the maximum distance between the antenna elements Δdmax, its impinging signals can be modeled as a plane wave (pw), as depicted in Fig. 3. For many applications the RFID tag signal stag(t) can be modeled as such an impinging plane wave. For a linear array and a narrowband source the received signal at the nth element is
where is the signal defined at the arbitrary reference point, an attenuated by bta and phase shifted by version of the transmitted tag signal stag(t) (Pillai, 1989).
describes the signals of all receiving antennas. Here alin is the array manifold of a linear array, a description for the unity response of the specific array geometry to a signal impinging from the direction θ. As can be seen, the received signal is an amplitude and phase shifted version of the transmitted signal stag(t). Since DoA estimation algorithms don't utilize the absolute phase of the received signal, only the phase differences between the receiver channels are relevant and the phase shift factor δta can be omitted in the following sections. The attenuation factor bta can be calculated via Friis' transmission Equation (Pozar, 2009)
where Gtag and Garrayelement are the gain for transmitting and receiving antenna elements respectively. fc is the carrier frequency of the transmitted signal, c=c0 its propagation speed and r the distance between the transmitting RFID tag and the receiving antenna array.
2.2 Spherical wave propagation signal model
In typical RFID DoA estimation applications, the read range of the tags varies from under 1 m to up to 20 m. Especially for short read ranges and coincident usage of big antenna arrays, the far-field approximation utilized in Sect. 2.1 introduces considerable errors. In the following an approach for modeling transmitters that are in the far-field zone of a single receiving array element but not of the whole antenna array is introduced. Since the impinging waves are modeled as spherical waves (sw), it follows that the received signals are no longer only dependent on the incident angle of the wave, but also the distance between the tag and reference point of the antenna array.
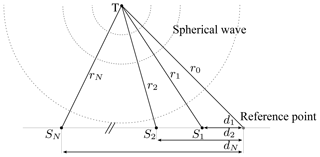
Figure 4Spherical wave impinging on a linear antenna array with N elements at the distances d1 to dN from a reference point.
Figure 4 shows a receiving array consisting of N sensors in a linear configuration. The transmitter, in this case the RFID tag, is located at the position T with a distance of
to the reference point. The receiving antennas are at the positions S1 to SN with distances of r1 to rN to the transmitter. Δr describes the distance differences between the receiver channels and the reference point, so that
where are the positions of the antennas relative to the reference point. To form a representation that is advantageous for the simulation of the received signals, we postulate that the received signal of the nth element will once again be an attenuated and phase shifted version of the transmitted signal stag(t) and can be represented by
The attenuation factor bn can be calculated according to Eq. (3). Since only the phase differences between the receiving antennas are of importance for DoA estimation, the phase factors can be easily calculated using the distance differences Δrn for each receiving channel as
As it was the case with the far-field model, the received signals for every receiving antenna can be represented by the vector
where K is
It represents a scaling factor that is constant for all N channels and is dependent on the gain of the used antenna elements and the carrier frequency of the transmitted signal. This description enables the simulation of received signals by introducing tag position specific attenuations bn(rn) and phase shift factors δn(rn) for each receiver channel.
2.3 Multipath signals
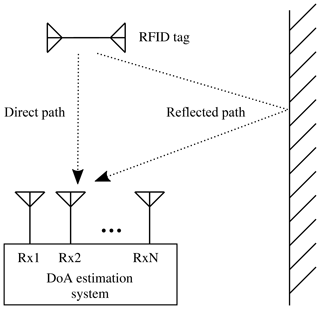
In most applications, the RFID system is utilized in scenarios where strong reflectors like concrete walls or metal structures and objects are present. These situations exhibit so called multipath (mp) signal propagation where multiple signal paths from the transmitting tag to the receiving array exist. Such a case is depicted in Fig. 5. The RFID tag signal has two paths from source to the receiving array, one direct and one via a reflecting object. The received signals are a superposition of both paths, impinging on the array from θd and θr. Assuming far-field conditions and the signal model from Eq. (2), it can be represented as
It has to be noted, that this representation is only valid if both the reflection and the RFID tag are sufficiently far away from the antenna array and far-field conditions can be assumed. If the reflector is in close proximity to the receivers, the signal vectors have to be calculated with the model for spherical wave propagation, as outlined in Eq. (8).
describes this multipath case for spherical wave propagation. One problem is the determination of the strength and phase of the reflected signal path. Analytical models only exist for very simplistic reflectors like metallic and dielectric planes, line reflectors and other idealized geometric shapes. Since exact descriptions of the reflectors are not necessary to evaluate the performance of a DoA estimation system, a range of exemplary values will be used. The incident reflected wave will be modeled as originating from the position of the reflector. This is not descriptive of a specific scenario, but enables the performance evaluation of the estimation system under the influence of a generic reflector.
2.4 Reader carrier coupling
Another aspect of RFID DoA estimation systems that needs to be analyzed for the proposed target simulator is the robustness of the receivers against the direct carrier wave (cw) emanated from the RFID reader while the RFID tag transmits its data. Since the reader antenna is often in close proximity to the receiving array and the power of the reader carrier is much larger than of the tag signal itself, the ability to suppress the influence of the carrier signal is one of the central challenges facing RFID receivers. To describe the ratio between carrier power and tag power, the Signal to Carrier Ratio (SCR) is introduced. It is defined as
For typical systems the coupling between reader and receiving array can be assumed to be in the range between −20 and −60 dB. The received tag signal power Ptag is dependent on the path loss from reader to tag and the loss bta from the tag to the receiving array. The factor 1∕2 is caused by the switched impedance of the RFID tag. The tag has two states, one reflective and one absorptive. It is assumed the tag is absorbing half of the time, this signal energy is not reflected. The values for brt and bta can be calculated using Eq. (3).
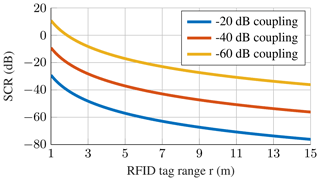
Figure 6 shows the SCR over tag range rtag for a range of realistic carrier coupling values. It shows, that the SCR is only positive for very low coupling and very short read ranges, in the given example of dB the carrier becomes stronger than the tag signal for distances greater than 1.9 m. For the more typical coupling value of −40 dB the tag signal is always weaker than the received reader carrier, for high read ranges and high coupling values, the SCR approaches −76 dB. It is clear, that the vastly stronger reader carrier presents a problem for the DoA estimation system since it overpowers the signal received from the RFID tag. Thus the ability to suppress the reader carrier is a core requirement for the estimation system and should be regarded in the target simulation.
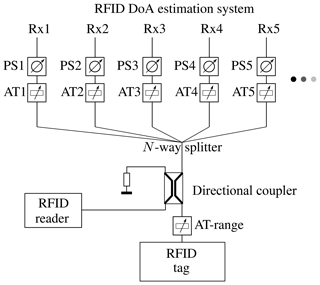
Based on the developed signal models derived in Sect. 2, a system capable of imitating the received signals of a RFID DoA estimator was developed. The plane wave model derived in Sect. 2.1 describes the received signals as phase shifted versions of the transmitted signal. The models for the spherical wave propagation and multipath scenarios represent the simulated signals by phase and amplitude shifting the tag signal. Hence, a target simulator structure based on adjustable phase shifters and attenuators, as outlined in Fig. 7, was implemented. In this setup, a RFID reader is connected to a RFID transponder via a directional coupler and a variable attenuator. The attenuator replicates the free space path loss between reader and transponder, according to Eq. (3). The transponder is then able to modulate the cw signal transmitted by the reader. The tag response once again passes through the range attenuator and the directional coupler. Part of the signal is returned to the reader, the other part is fed into a N-way splitter. For every channel of the DoA estimation system the split components are then fed into a independently adjustable attenuator and phase shifter, before terminating in one of the N receiver channels. Such an evaluation system has two main advantages: it enables the analysis of the whole RFID system, including reader and tag; through the use of a two stage attenuation setup a high dynamic range and therefore a wide range of simulated distances can be achieved.
This setup can be further expanded by adding a Wilkinson power combiner to each input channel, as is depicted in Fig. 8. In the second input of the combiner the carrier wave of the RFID reader can be inserted with variable amplitudes. This enables the evaluation of the carrier suppression of the receiver channels of the DoA estimation system.
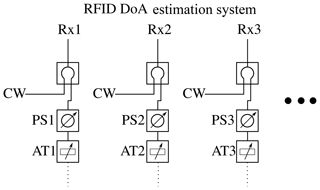
Figure 8Evaluation scheme for testing the reader carrier suppression in RFID DoA estimation systems.
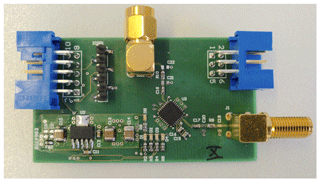
The two main components of the proposed target simulator are the phase shifter and the attenuator. The attenuator is based on the wideband digital step attenuator F1956 from IDT and allows for variable attenuation of 0 to 30 dB in 0.25 dB increments. One of the realized modules is depicted in Fig. 9.
The phase shifter consists of two parts, a varactor diode loaded branchline coupler and six switched line segments. The varactor diodes allow for a voltage controlled continuous phase shift from 0 to 60∘, while the switched lines provide phase shifts from 0 to 300∘. Combined they offer the full range of 360∘ phase shift with a resolution better than 0.1∘ and only 2 dB insertion loss. The individual modules were calibrated, using a R&S ZVA 40 network analyzer as a reference and an accuracy of better than 1∘ was achieved.
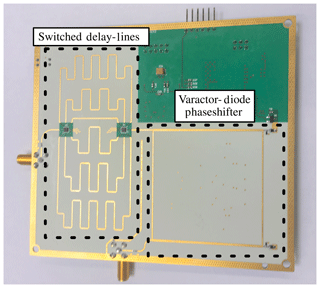
Figure 10Variable 867 MHz phase shifter consisting of a varactor diode loaded branchline phase shifter with 0 to 60∘ range and 6 switched lines with 0 to 300∘ in 60∘ increments.
For the following evaluations an integrated unit consisting of 8 attenuators, 8 phase shifters and a 8-way power splitter was constructed. The individual components are connected to an embedded Linux platform, which allows for the configuration of the whole unit via Ethernet. The setup time for all modules combined is less than 1 ms, which enables very fast evaluation measurements. The evaluation time is not constrained by the setup of the target simulator, but by how long it takes the RFID reader to query the tag for its information. This read process takes in the order of tens of milliseconds.
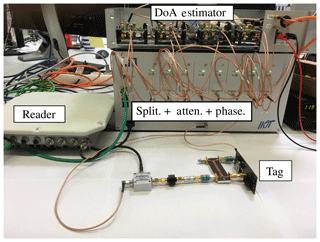
The RFID tag used in the following evaluations is a Monza 2K evaluation board from Impinj. It features a SMA connector and the necessary matching circuit, enabling easy connection to the directional coupler. The RFID reader is the last component for the system evaluation, the RRU4 from Kathrein was used. The whole measurement setup can be seen in Fig. 11.
In this section, exemplary evaluation measurements of a DoA estimation system designed and constructed at our institute will be presented to demonstrate the functionality and performance of the proposed target generator. The exact performance data derived from the following measurements is of little interest, this DoA estimator serves only as a platform to show the evaluation method made possible by the target generator. Therefore the discussion of the results will be rather rudimentary.
The DoA system under test consists of an 8-channel homodyne I-Q baseband receiver, 8 coherent 2-channel analog to digital converters and an embedded Linux computer for the signal processing and calculation of the estimated direction of arrivals. Unless otherwise noted, a digital Bartlett beamformer algorithm and all 8 receiving channels will be used in the evaluation. The antenna array geometry for all evaluation measurements is a uniform linear array with 0.5λ element spacing, ranging from 2 to 8 elements. Firstly, evaluation setups and results for basic scenarios without multipath signal propagation will be shown. Here the focus lies on the differences between plane wave and spherical signal models and the evaluation of the carrier suppression capabilities of the DoA multichannel receiver. It is followed by measurements conducted utilizing the multipath model derived in Sect. 2.3.
Table 2Free space losses for varying ranges, Gtag=2.14 dBi, dBi, fc=867 MHz for the path segments reader to tag (), tag to array element () and reader over tag to array element ().

4.1 Basic scenarios
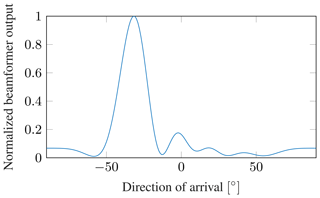
For a simple evaluation of the general idea of the target simulator, a RFID tag far away from the receiving array rtag≫Δdmax is simulated. Here the signal model derived in Sect. 2.1 is used. The phases of the target simulator for each DoA estimator receiver channel are set according to Eq. (2). The attenuation caused by free space losses is set according to Eq. (3), dependent on the tag range to be evaluated. Table 2 shows the attenuation values for the signal paths from reader to tag and from the tag to the receiving array . The reader is assumed to be very close to the DoA system, the ranges from reader to tag and from tag to the array can be assumed to be of equal length. Figure 12 shows the beamformer output spectrum of the DoA estimation system for a simulated RFID tag at a read range of 6 m, verifying the capability of the proposed system to simulate RFID targets.
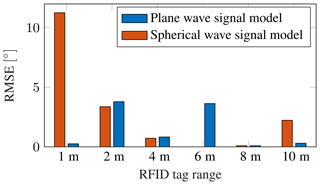
Figure 13RMSE of the DoA estimation system under test for tag ranges from 1 to 10 m, number of antennas N=8, utilizing both plane and spherical wave signal models.
By varying the simulated angle of arrival in the range of relevant DoAs for RFID systems from −60 to 60∘, the estimation errors of the system under test can be measured. In the following the RMSE and the 95th percentile (PCT95) will be used to describe the occurring errors. The RMSE describes the root mean square error of the angular estimates, the PCT95 the accuracy that 95 % of estimates achieve, thus eliminating scarce outliers. The RMSE for a simulated RFID tag, utilizing 8 element uniform linear array with 0.5λ element spacing is shown for various ranges in Fig. 13, both for targets simulated by the plane wave and the spherical wave signal model. This analysis highlights the need for the spherical signal model when big receiving arrays are used at small tag ranges. Here, the distance between the first and last array element is m. At a distance of 1 m from the array, the RMSE for the plane wave signal model is vastly smaller than that for the spherical wave signal model. The detrimental effects of the mismatch between the ideal manifold, used by the DoA estimation system and the real received signals more closely described by the spherical wave approximation derived in Sect. 2.2 leads to substantial errors. This effect can only be captured if the target simulator uses the spherical model. Once the range between tag and antenna array gets larger, the difference between the spherical and plane wave approach diminishes and both deliver valid simulation results.
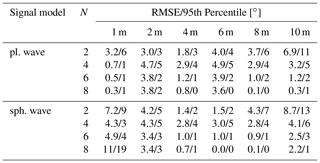
The statistical analysis of the system errors in the DoA estimator under test with multiple array sizes, are presented in Table 3.
4.2 Carrier coupling
As was described in Sect. 2.4, the direct coupling of the transmitted RFID reader carrier signal to the receiving antenna array can pose a challenge for the DoA estimator. To exemplarily evaluate the performance of a system against varying coupling values, a measurement setup according to Fig. 8 was created with different power coupling factors ranging from −60 to −20 dB. For the measurements, a RFID tag at 8 m range with incident angles from −60 to 60∘ was used. The power of the received cw signal at the DoA estimation array is
For the transmitted power of the reader Preader the maximal allowed value of 33 dBm for RFID systems in Europe was assumed. The strength of the RFID tag signal is calculated as
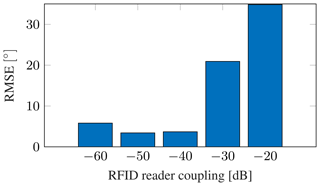
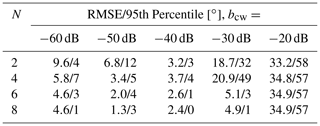
the value for can be calculated using Friis' Eq. (3), and is listed in Table 2. Using these two power values, the SCR can be calculated according to Eq. (12), the values used in the evaluation are listed in Table 4. Figure 14 shows the system performance dependent on the direct carrier coupling value. It can be seen, that the receiver is able to effectively suppress the carrier for coupling values smaller than −30 dB. Table 5 shows the congregated results of the direct carrier coupling evaluations for 2 to 8 element antenna arrays. This analysis reveals a flaw with the receiver structure under test. Especially with only 2 receiving antennas, bad performance at very low carrier coupling values of −60 and −50 dB can be observed. This suggests a problem in the automatic gain control circuit of the receivers, highlighting the importance of integrating the receiver hardware into the evaluation process.
Table 5Evaluation results for a DoA estimation system with varying reader coupling and number of array elements N from 2 to 8.
4.3 Multipath scenarios
Next, the evaluation of the DoA estimation system performance in scenarios where multipaths are present is shown. Here, the received signals are calculated according to Eq. (11), utilizing the spherical wave signal model. Figure 15 shows the beamformer output spectrum for a simulated RFID tag at ∘ with a range of 6 m. Additionally, an occurring multipath can be seen at ∘. The multipath has an amplitude scaling factor of bmp=0.9 relative to the direct path signal, which results in a relative multipath power of .
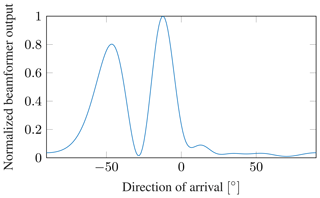
Figure 15Beamformer spectrum for a multipath scenario with the RFID tag at ∘ and a multipath from ∘, with a relative amplitude of bmp=0.9. N=6, r=6 m.
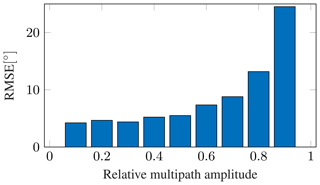
Figure 16Statistical RMSE of a DoA estimation system for varying multipath strengths, averaged over 10 000 measurements. N=4, r=6 m.
Table 6Evaluation results of the DoA estimation system in multipath scenarios for varying multipath strengths bmp and number of array antennas N.

To evaluate the system over a wide range of different situations, 10 000 simulated scenarios with random RFID tag angles and multipath angles between −60 and 60∘, and random relative multipath amplitude factors from 0.1 to 0.9 have been conducted. Figure 16 shows the RMS error values over 10 000 measurements for a receiving array with 4 antenna elements. The system is not influenced by multipaths with an amplitude factor smaller 0.6, but with stronger multipaths the error rises quickly. At bmp=0.9 very big errors with an RMSE of 24.5∘ occur. Further evaluation results for antenna arrays with 2 to 8 elements can be seen in Table 6. It shows that small arrays with only 2 elements are badly influenced by the presence of multipaths, an increase to 4 elements vastly increases the overall system performance. This shows, that even for situations where only multipaths of medium strength occur, receiving arrays with at least 4 elements should be used. The data in Table 6 highlights, that by utilizing the target simulation approach, valuable information about the system performance under multipath conditions can be gained. Because of the vastly longer measurement and setup times and the difficulty of exactly controlling the occurring multipaths, it would be impossible to evaluate a DoA system for its multipath resistance under laboratory settings or in the real application with that many data points. Here the advantages of the hardware in the loop approach become very clear. A rigorous evaluation of systems under multipath conditions that is comparable over multiple systems under test and not predicated on special measurement locations is made possible.
This paper has shown a new method of evaluating UHF RFID DoA estimation systems by utilizing a hardware in the loop setup to simulate RFID targets. The signal models used in the received signal simulation have been developed and the need for spherical wave propagation models has been examined. Hardware components for the simulation of the signals by attenuation and phase shifting the input signals at the RFID DoA receiver have been developed and an evaluation system structure that allows for realistic target simulation has been proposed.
Exemplary evaluation measurements of a DoA estimation system have been conducted proving the usability of this simulation scheme. Basic simulations with plane wave and spherical wave signal models have underscored the need to consider spherical propagation models especially when using large receiving arrays and small tag ranges. A procedure for the evaluation of the reader carrier suppression in the DoA estimator has been proposed and its usability was demonstrated. The capability of the target simulator to replicate multipath scenarios was shown, the measurement results confirm the need for receiving arrays with multiple antenna elements in situations where multipath signal propagation might occur.
This enables a new way to perform evaluations of UHF RFID DoA estimation systems by combining the simulation of the targets and the actual hardware of the DoA estimator. It is faster, cheaper and more comparable than previous methods and thus enables further reaching system analysis than up to this point possible.
All relevant models and results of the research are contained in the manuscript, the work can be reproduced with the presented models. The code implementation of the models can be requested by the corresponding author.
PE conceptualized the core idea, developed the models and performed the evaluation and simulations. EB supervised the research and provided resources and feedback. PE prepared the manuscript with contributions from EB.
The authors declare that they have no conflict of interest.
This article is part of the special issue “Kleinheubacher Berichte 2018”. It is a result of the Kleinheubacher Tagung 2018, Miltenberg, Germany, 24–26 September 2018.
This research has been supported by the Deutsche Forschungsgemeinschaft (grant no. BI 391/16-2).
This work was supported by the German Research Foundation (DFG) and the Technical University of Munich (TUM) in the framework of the Open Access Publishing Program.
This paper was edited by Jens Anders and reviewed by two anonymous referees.
Ascher, A., Lechner, J., Nosovic, S., Eschlwech, P., and Biebl, E.: 3D localization of passive UHF RFID transponders using direction of arrival and distance estimation techniques, in: 2017 IEEE 2nd Advanced Information Technology, Electronic and Automation Control Conference (IAEAC), IEEE, Piscataway, New Jersey, USA, 1373–1379, https://doi.org/10.1109/IAEAC.2017.8054239, 2017. a, b
Azzouzi, S., Cremer, M., Dettmar, U., Kronberger, R., and Knie, T.: New measurement results for the localization of UHF RFID transponders using an Angle of Arrival (AoA) approach, in: 2011 IEEE International Conference on RFID, IEEE, Piscataway, New Jersey, USA, 91–97, https://doi.org/10.1109/RFID.2011.5764607, 2011. a
Broy, M. and Geisberger, E.: agendaCPS Integrierte Forschungsagenda Cyber-Physical Systems, Tech. rep., acatech STUDIE, acatech – Deutsche Akademie der Technikwissenschaften, Munich, Germany, 2012. a
Bundesministerium für Bildung und Forschung: Industrie 4.0 Innovationen für die Produktion von morgen, available at: https://www.bmbf.de/pub/Industrie_4.0.pdf (last access: 10 July 2019), 2017. a
Eberhardt, M., Lehner, M., Ascher, A., Allwang, M., and Biebl, E. M.: An active UHF RFID localization system for fawn saving, Adv. Radio Sci., 13, 87–94, https://doi.org/10.5194/ars-13-87-2015, 2015. a
Finkenzeller, K.: RFID-Handbuch: Grundlagen und praktische Anwendungen von Transpondern, kontaktlosen Chipkarten und NFC, Carl Hanser Verlag GmbH Co KG, Munich, Germany, 2015. a, b
Heidrich, J., Brenk, D., Essel, J., Fischer, G., Weigel, R., and Schwarzer, S.: Local positioning with passive UHF RFID transponders, in: 2009 IEEE MTT-S International Microwave Workshop on Wireless Sensing, Local Positioning, and RFID, IEEE, Piscataway, New Jersey, USA, 1–4, https://doi.org/10.1109/IMWS2.2009.5307861, 2009. a
Hua, M., Peng, G., Lai, Y., and Liu, H.: Angle of Arrival Estimation for Passive UHF RFID Tag Backscatter Signal, in: 2013 IEEE International Conference on Green Computing and Communications and IEEE Internet of Things and IEEE Cyber, Physical and Social Computing, IEEE, Piscataway, New Jersey, USA, 1865–1869, https://doi.org/10.1109/GreenCom-iThings-CPSCom.2013.346, 2013. a
Johannes, L., Alois, A., Stefan, N., and Willibald, G.: Concept for an intelligent UHF RFID reader according to the Ideas of Industry 4.0, in: Smart SysTech 2016; European Conference on Smart Objects, Proceedings of Systems and Technologies, 1–5, VDE Verlag, Berlin, Germany, 2016. a
Kim, M., Kim, H. W., and Chong, N. Y.: Automated Robot Docking Using Direction Sensing RFID, in: Proceedings 2007 IEEE International Conference on Robotics and Automation, IEEE, Piscataway, New Jersey, USA, 4588–4593, https://doi.org/10.1109/ROBOT.2007.364186, 2007. a
Loibl, C. and Biebl, E.: Localization of passive UHF RFID tagged goods with the Monopulse principle for a logistic application, in: Proceedings of 2012 European Conference on Smart Objects, Systems and Technologies (SmartSysTech), 1–5, VDE Verlag, Berlin, Germany, 2012. a
Nosović, S., Ascher, A., Lechner, J., and Bruegge, B.: 2-D localization of passive UHF RFID tags using location fingerprinting, in: 2016 8th International Congress on Ultra Modern Telecommunications and Control Systems and Workshops (ICUMT), IEEE, Piscataway, New Jersey, USA, 207–212, https://doi.org/10.1109/ICUMT.2016.7765358, 2016. a
Pillai, U.: Array signal processing, Springer-Verlag, New York, USA, 1989. a
Pozar, D. M.: Microwave engineering, John Wiley & Sons, Hoboken, New Jersey, USA, 2009. a
Vojtech, L., Bortel, R., Neruda, M., Holý, R., Stasa, P., Benes, F., Svub, J., and Unucka, J.: DoA outdoor RFID locator — system verification report, in: 2016 International Symposium on Information Theory and Its Applications (ISITA), IEEE, Piscataway, New Jersey, USA, 772–776, 2016. a


