the Creative Commons Attribution 4.0 License.
the Creative Commons Attribution 4.0 License.
 | 17 Feb 2026
Comprehensive signal processing approaches for non-contact heartbeat detection using 24 GHz FMCW radar
Aly Marnach
Volker Lücken
Andreas R. Diewald
Non-contact monitoring of vital signs has become increasingly important for enhancing patient comfort and reducing interference during medical assessments. Such methods are particularly valuable for addressing phenomena such as white-coat hypertension and for enabling more accurate diagnoses in home environments. This paper consolidates three innovative approaches for heartbeat detection using a dedicated 24 GHz frequency-modulated continuous-wave (FMCW) radar.
First, a novel signal envelope analysis method is introduced, demonstrating its ability to extract heartbeat information and to validate the results against an ECG reference system (GE Healthcare CARESCAPE Monitor B650). Second, computationally intensive steps are optimized for real-time processing by replacing the Hilbert transform and smoothing functions with more efficient alternatives such as Moving-RMS and Moving-Average filters. These adaptations enable low-latency operation while maintaining reliable detection performance. Lastly, a convolution-based Gaussian pulse method is presented to extend the envelope analysis, followed by a time-domain plausibility check to refine peak detection.
The modular radar system comprises a 2TX/4RX MIMO radar front-end, a filtering and amplification module, and a data acquisition module, all developed at the Laboratory of Applied Radar and Optical Systems (LaROS) at Trier University of Applied Sciences. Each proposed method has been optimized for the 24 GHz ISM band, offering a balance between real-time capability and detection accuracy. Validation against ECG benchmarks confirms the feasibility and effectiveness of the presented approaches, contributing to the advancement of non-contact vital sign monitoring technologies.
- Article
(10651 KB) - Full-text XML
- BibTeX
- EndNote


Vital signs such as breathing rate and heartbeat are essential indicators of a person's health and are increasingly monitored using advanced technologies. Radar-based monitoring has emerged as a promising alternative to traditional methods, offering non-contact, continuous assessment of vital functions. This approach not only enhances patient comfort by avoiding attached electrodes or devices but also reduces interference and captures real-time data effectively (Will et al., 2017). Applications for radar-based vital sign monitoring range from newborn monitoring in incubators (Schmiech et al., 2018), baby monitoring at home (Lemmer et al., 2019), to surveillance of elderly individuals in retirement or private homes (Schäfer et al., 2018).
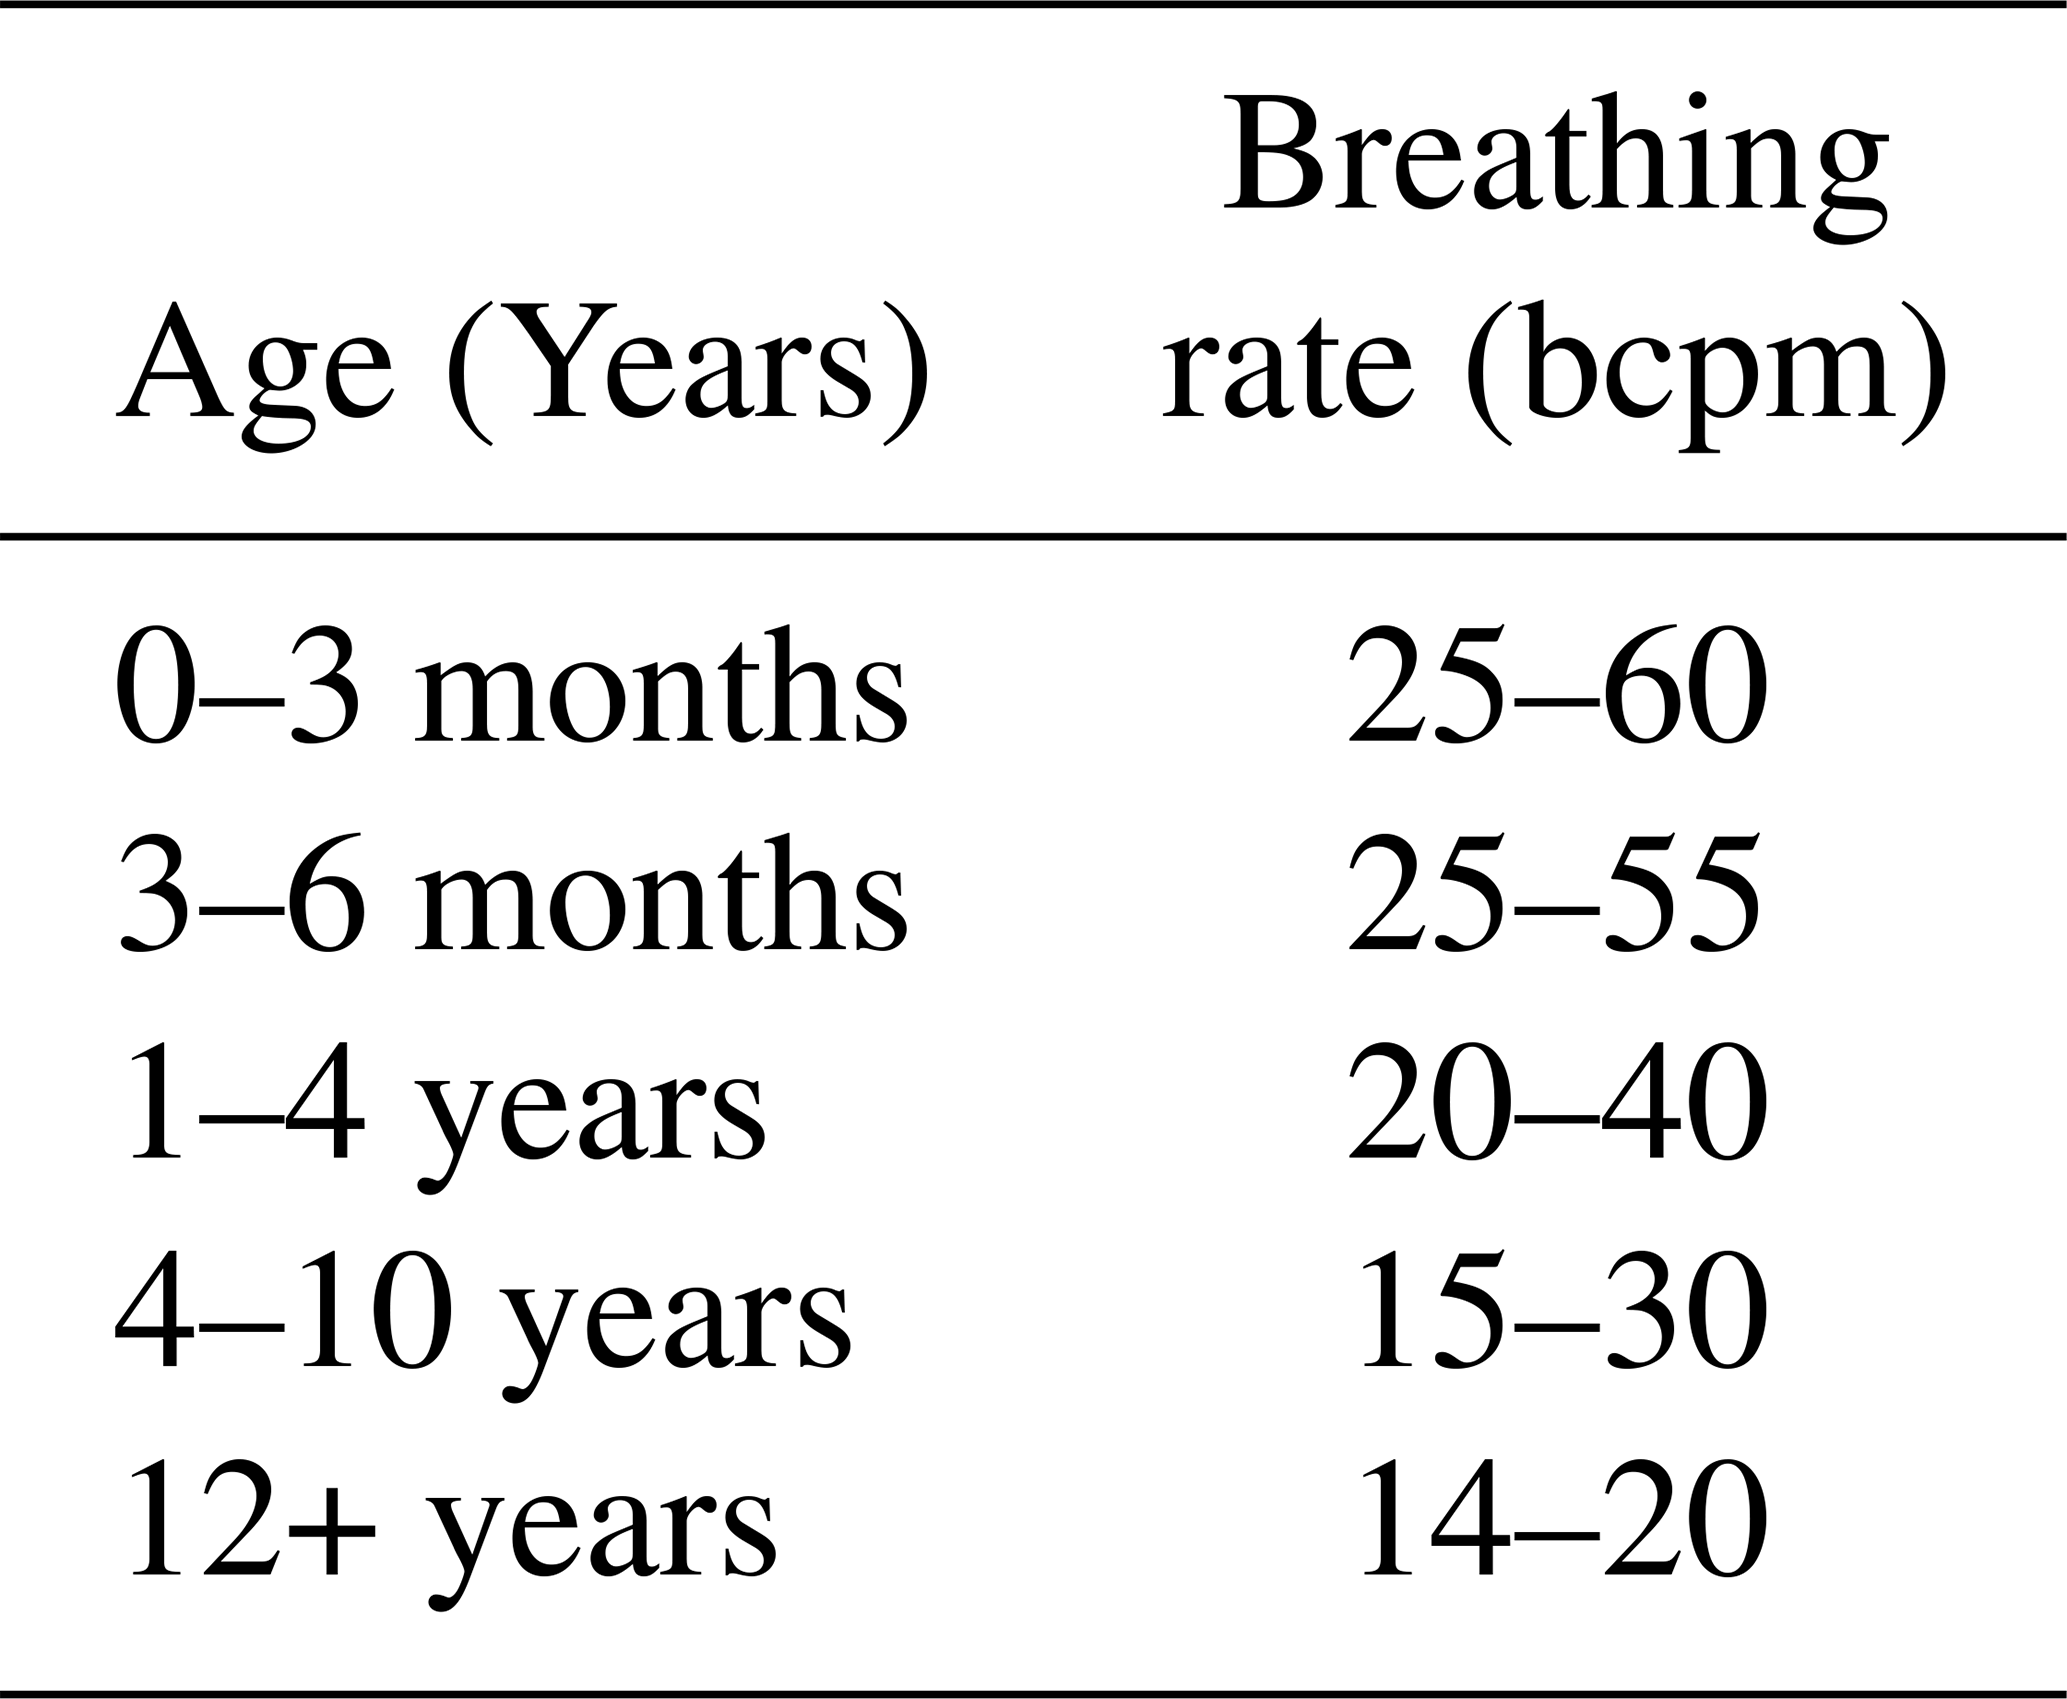
In contrast to methods in which seismocardiographic or ballistocardiographic chest movements must be known as sample functions, as presented in Tchameni et al. (2024c, a, b), the methodology introduced in this publication enables monitoring of the heartbeat of unknown adult humans with heart rates in the range between 30 and 180 bpm. The breathing rate, a key vital sign, was one of the earliest parameters targeted by radar technology. Classical methods such as body plethysmographs or spirometers, although precise, are often inconvenient for patients due to their intrusive nature. Radar systems, in contrast, allow the observation of chest movements without direct contact, making them a preferable solution. Table 1 lists standard breathing rates across various age groups. However, a limitation of radar-based breathing monitoring is its inability to provide direct insights into pulmonary volume. The heartbeat is another central vital sign, typically measured using electrocardiography (ECG). ECG not only provides accurate measurements of heart rate but also enables analysis of the heartbeat shape to assess overall health (Avram et al., 2019). Heart rate varies significantly with age, as illustrated in Table 2.
Table 1Standard values of the breathing rate by age (source: Kinderspital Luzern, 2021).
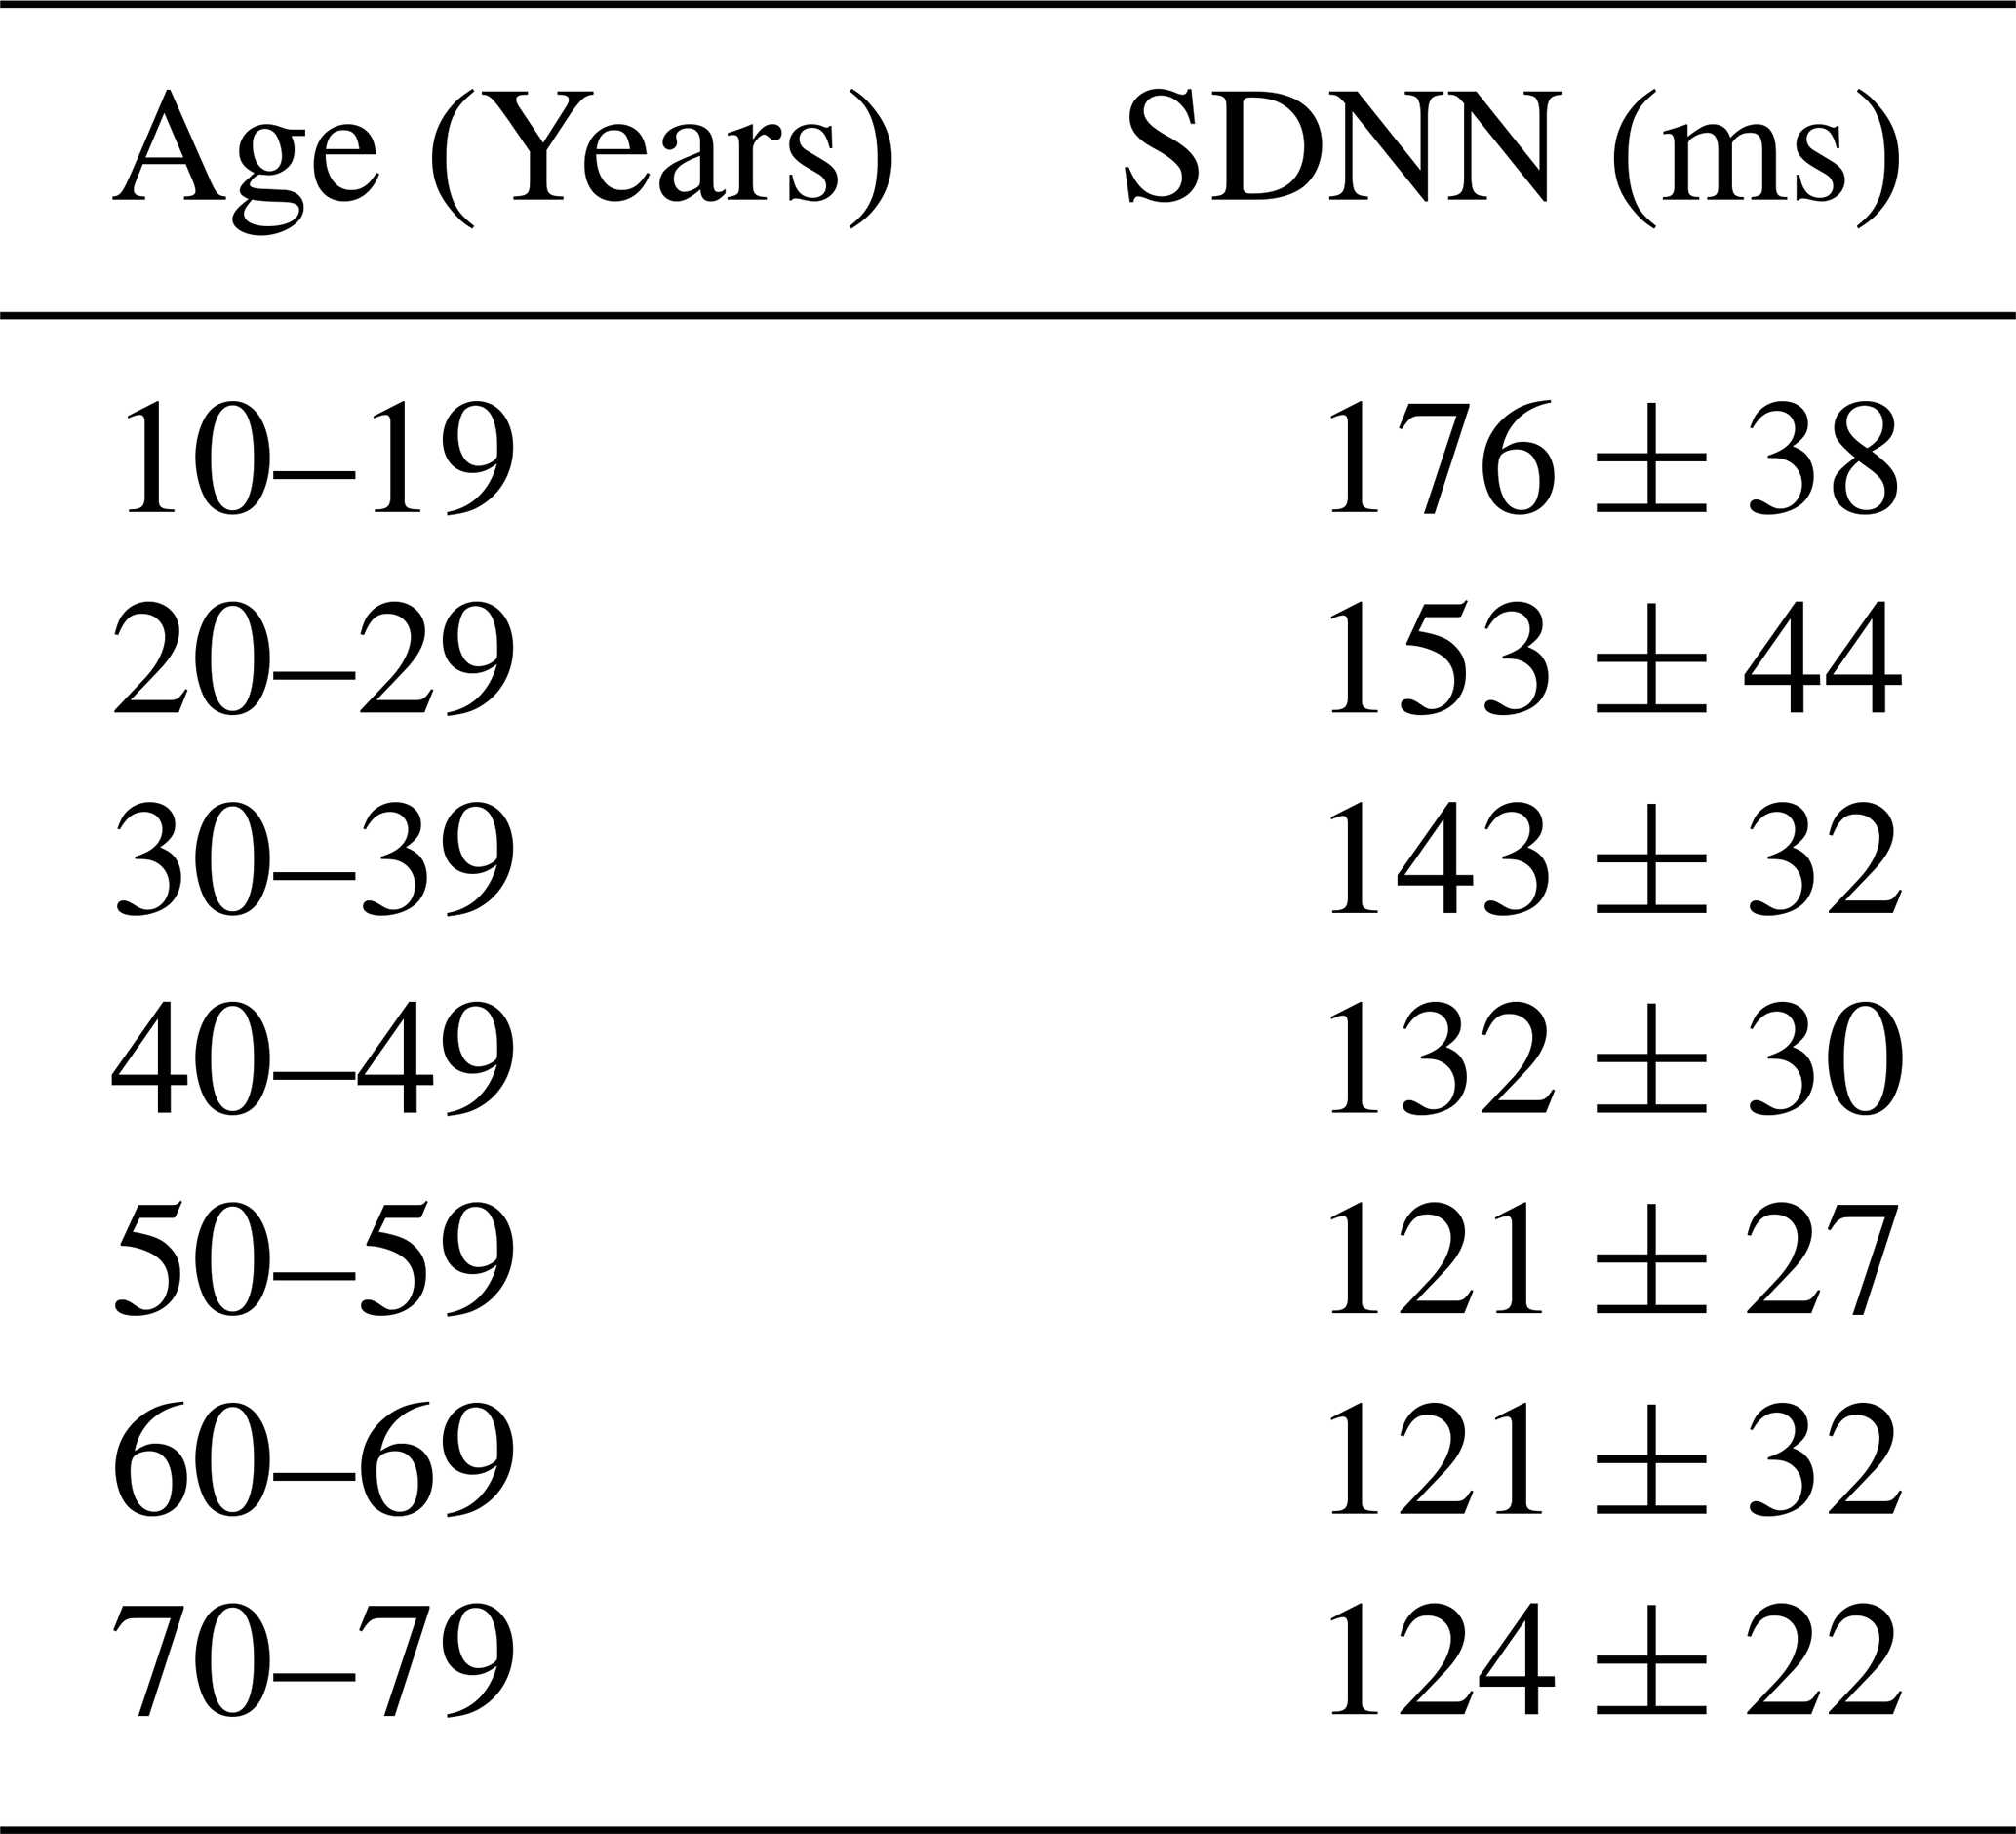
Additionally, the time intervals between heartbeats, known as heart rate variability (HRV), serve as an important indicator of a person's health. HRV, often quantified using parameters such as SDNN (Standard Deviation of Normal-to-Normal intervals), reflects the dynamic interplay of the sympathetic and parasympathetic nervous systems. Table 3 provides an overview of typical HRV values across age groups.
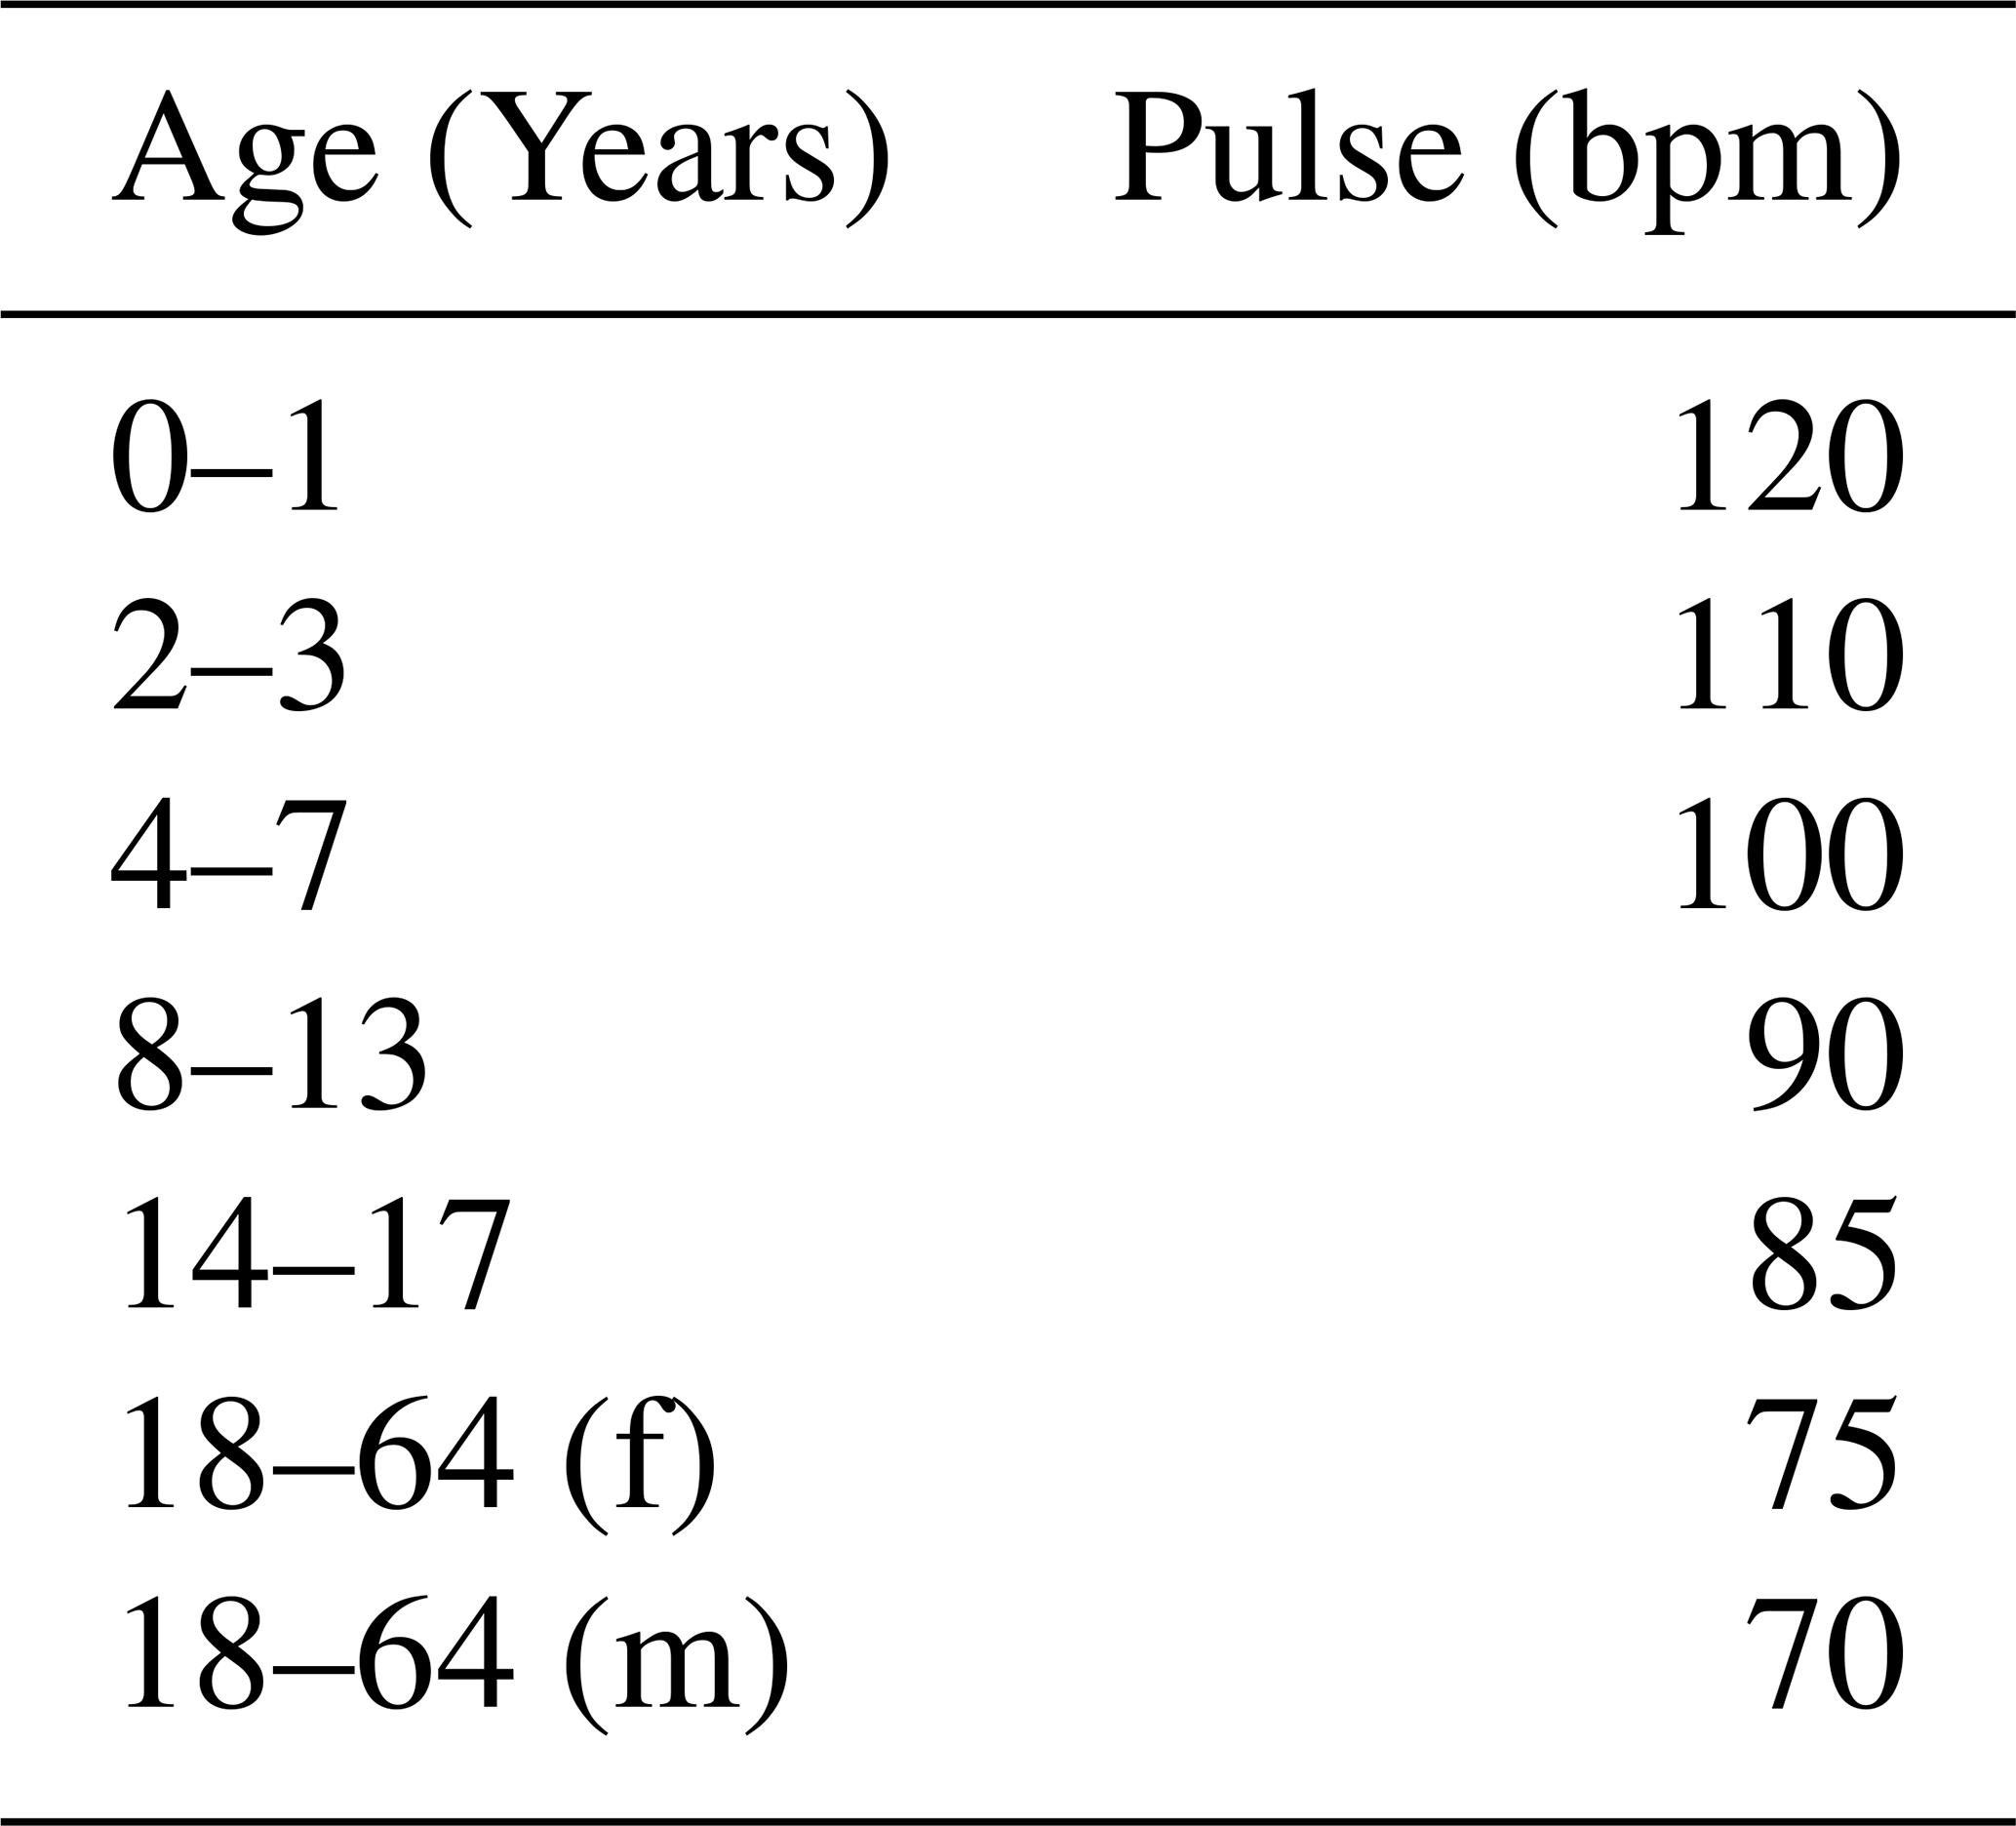
Table 3HRV by Doris Eller-Berndl, page 30. 24-hour measurement under similar conditions (source: Eller-Berndl, 2015).
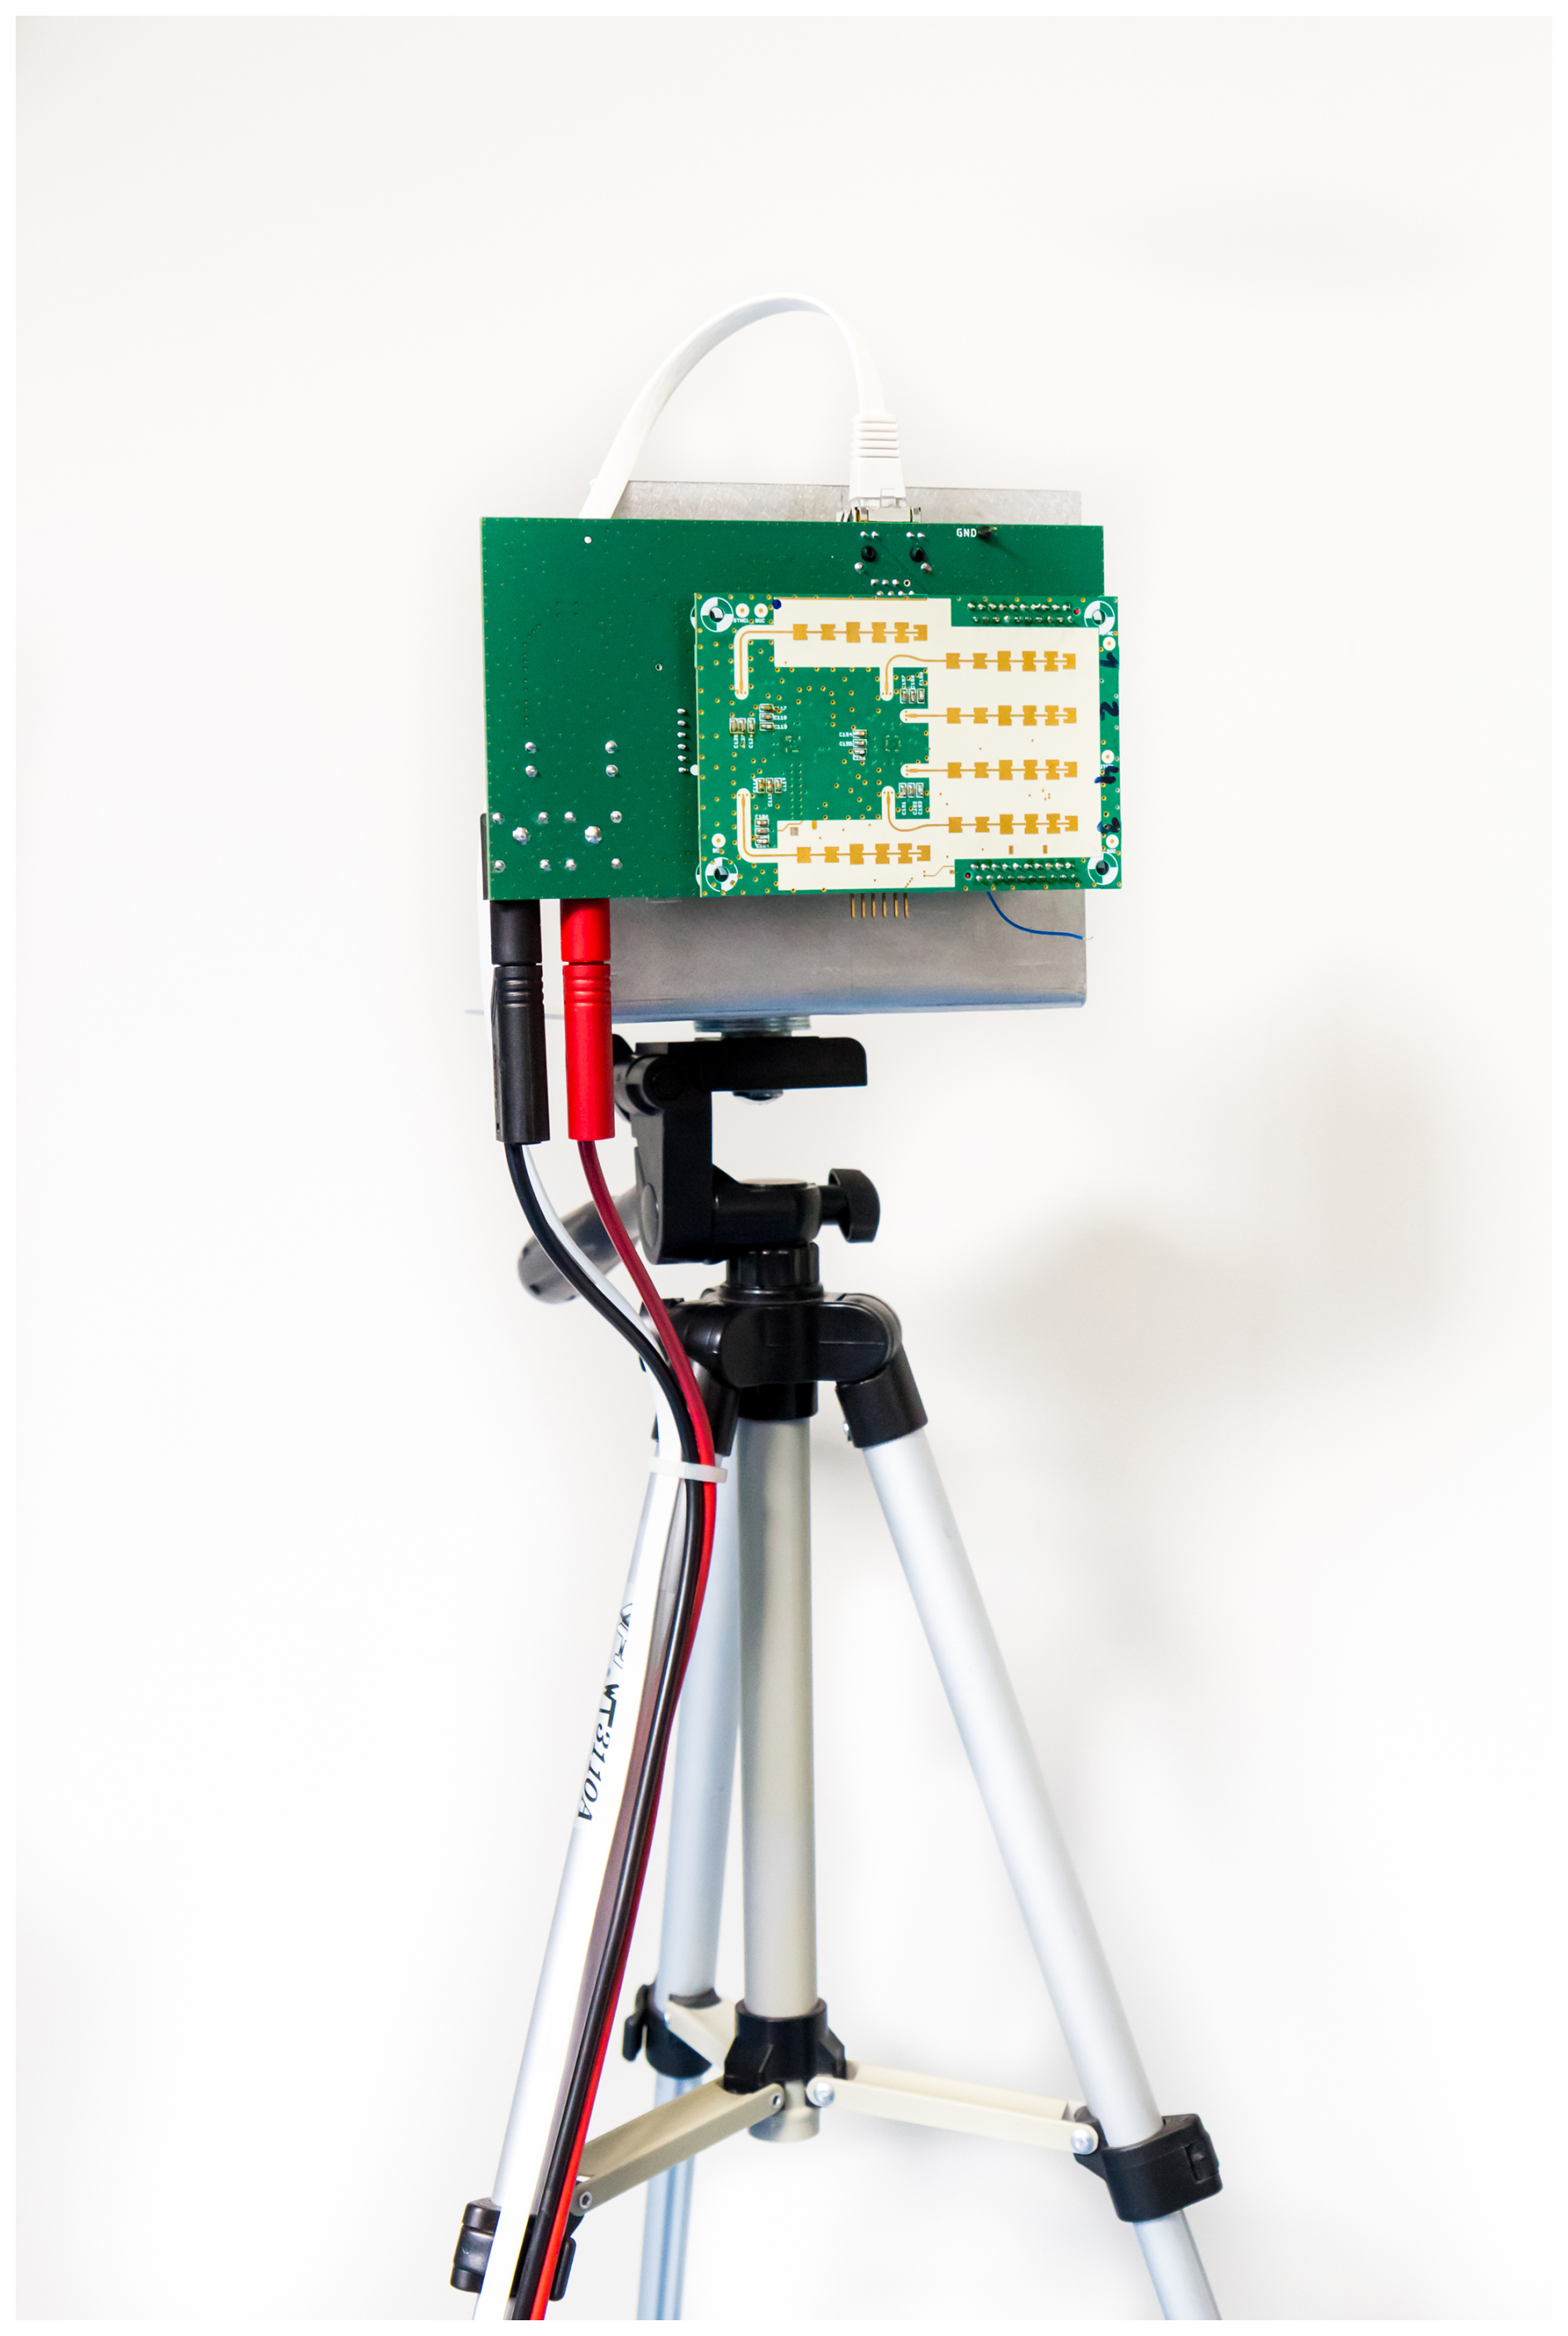
Recent advancements in radar technology for vital sign monitoring include the development of methods based on envelope analysis and computational optimizations. In prior works (Marnach et al., 2024a), a Hilbert transform and a fastsmooth function were used for envelope-based signal analysis. However, these methods proved unsuitable for real-time applications due to their computational complexity. To address this, alternative methods such as Moving-RMS and Moving-Average filters were introduced, enabling real-time monitoring with minimal performance trade-offs (Marnach et al., 2024b). In addition to this prior work, the Hilbert transform envelope analysis is extended by a convolutional method applied to adaptive Gaussian pulse sample functions. Furthermore, a plausibility check for detected heartbeats, in addition to classical peak prominence detection, is implemented to increase the reliability of the presented method. The modular radar system developed at the Laboratory of Radar Technology and Optical Systems (LaROS) at Trier University of Applied Sciences (Fig. 1) facilitates these advancements.
This paper presents an integrated analysis of radar-based vital sign monitoring methods. Section 2 discusses non-radar background knowledge about ECG, the resulting heartbeats, and the extraction of breathing from ECG data. Section 3 describes the radar system architecture. Section 4 elaborates on the signal processing techniques, including improvements for real-time applications. The results are presented in Sect. 5, followed by conclusions in Sect. 6.
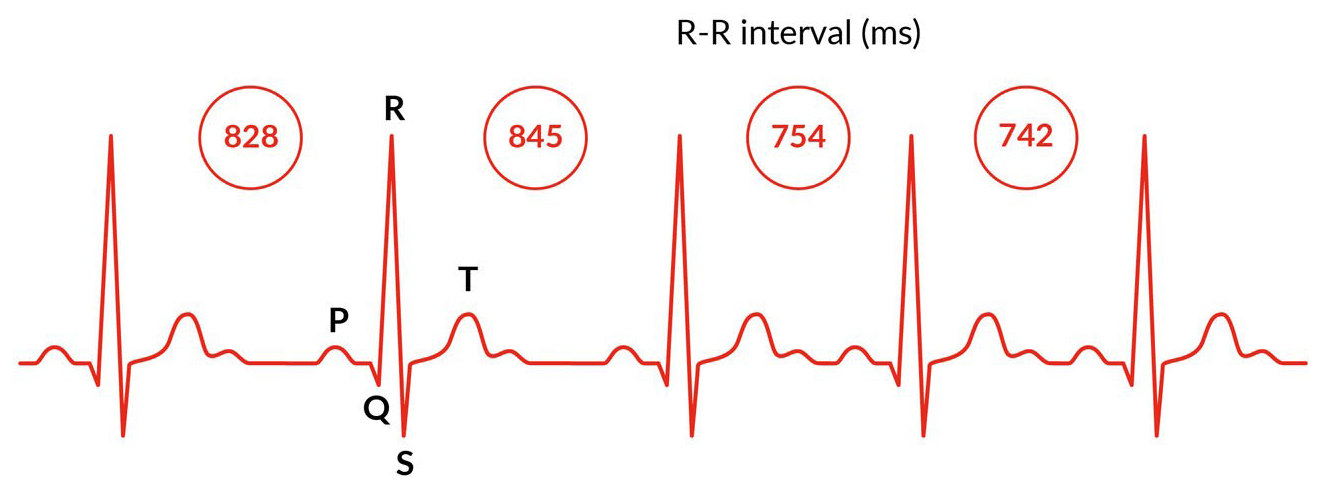
Figure 2 exemplifies multiple heartbeats in an ECG signal with variable intervals. For a better understanding of radar-based heartbeat measurement, the cardiac motion as a result of the ECG signal, and its relation to other physiological effects, is shown in Fig. 3, taken from Betancur (2014).
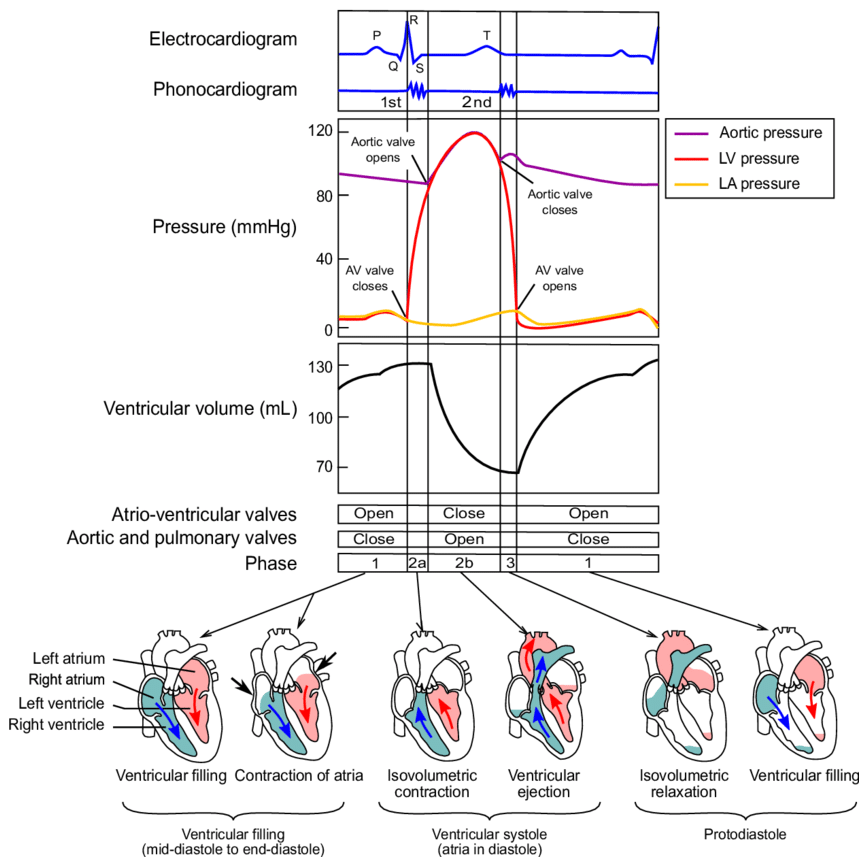
It is clearly visible that the response of the vascular system, in the form of an increase in blood pressure, can only be detected with a certain time delay.
Furthermore, when measuring using radar technology, a distinction must be made between detecting heart motion (seismocardiographic pulse) and detecting the response of the vascular system (ballistocardiographic pulse). To calculate the momentary heart frequency, the inverse of each RR-interval is computed, see Eq. (1). Because of heart rate variability (HRV), the term “momentary heart frequency” is used for the heart rate derived from each individual RR-interval.
Due to the inverse relationship, time deviations caused by HRV have a larger impact at low heart rates (RR↑) than at high heart rates (RR↓). Figure 4 illustrates the effect of variability on different average heart rates.
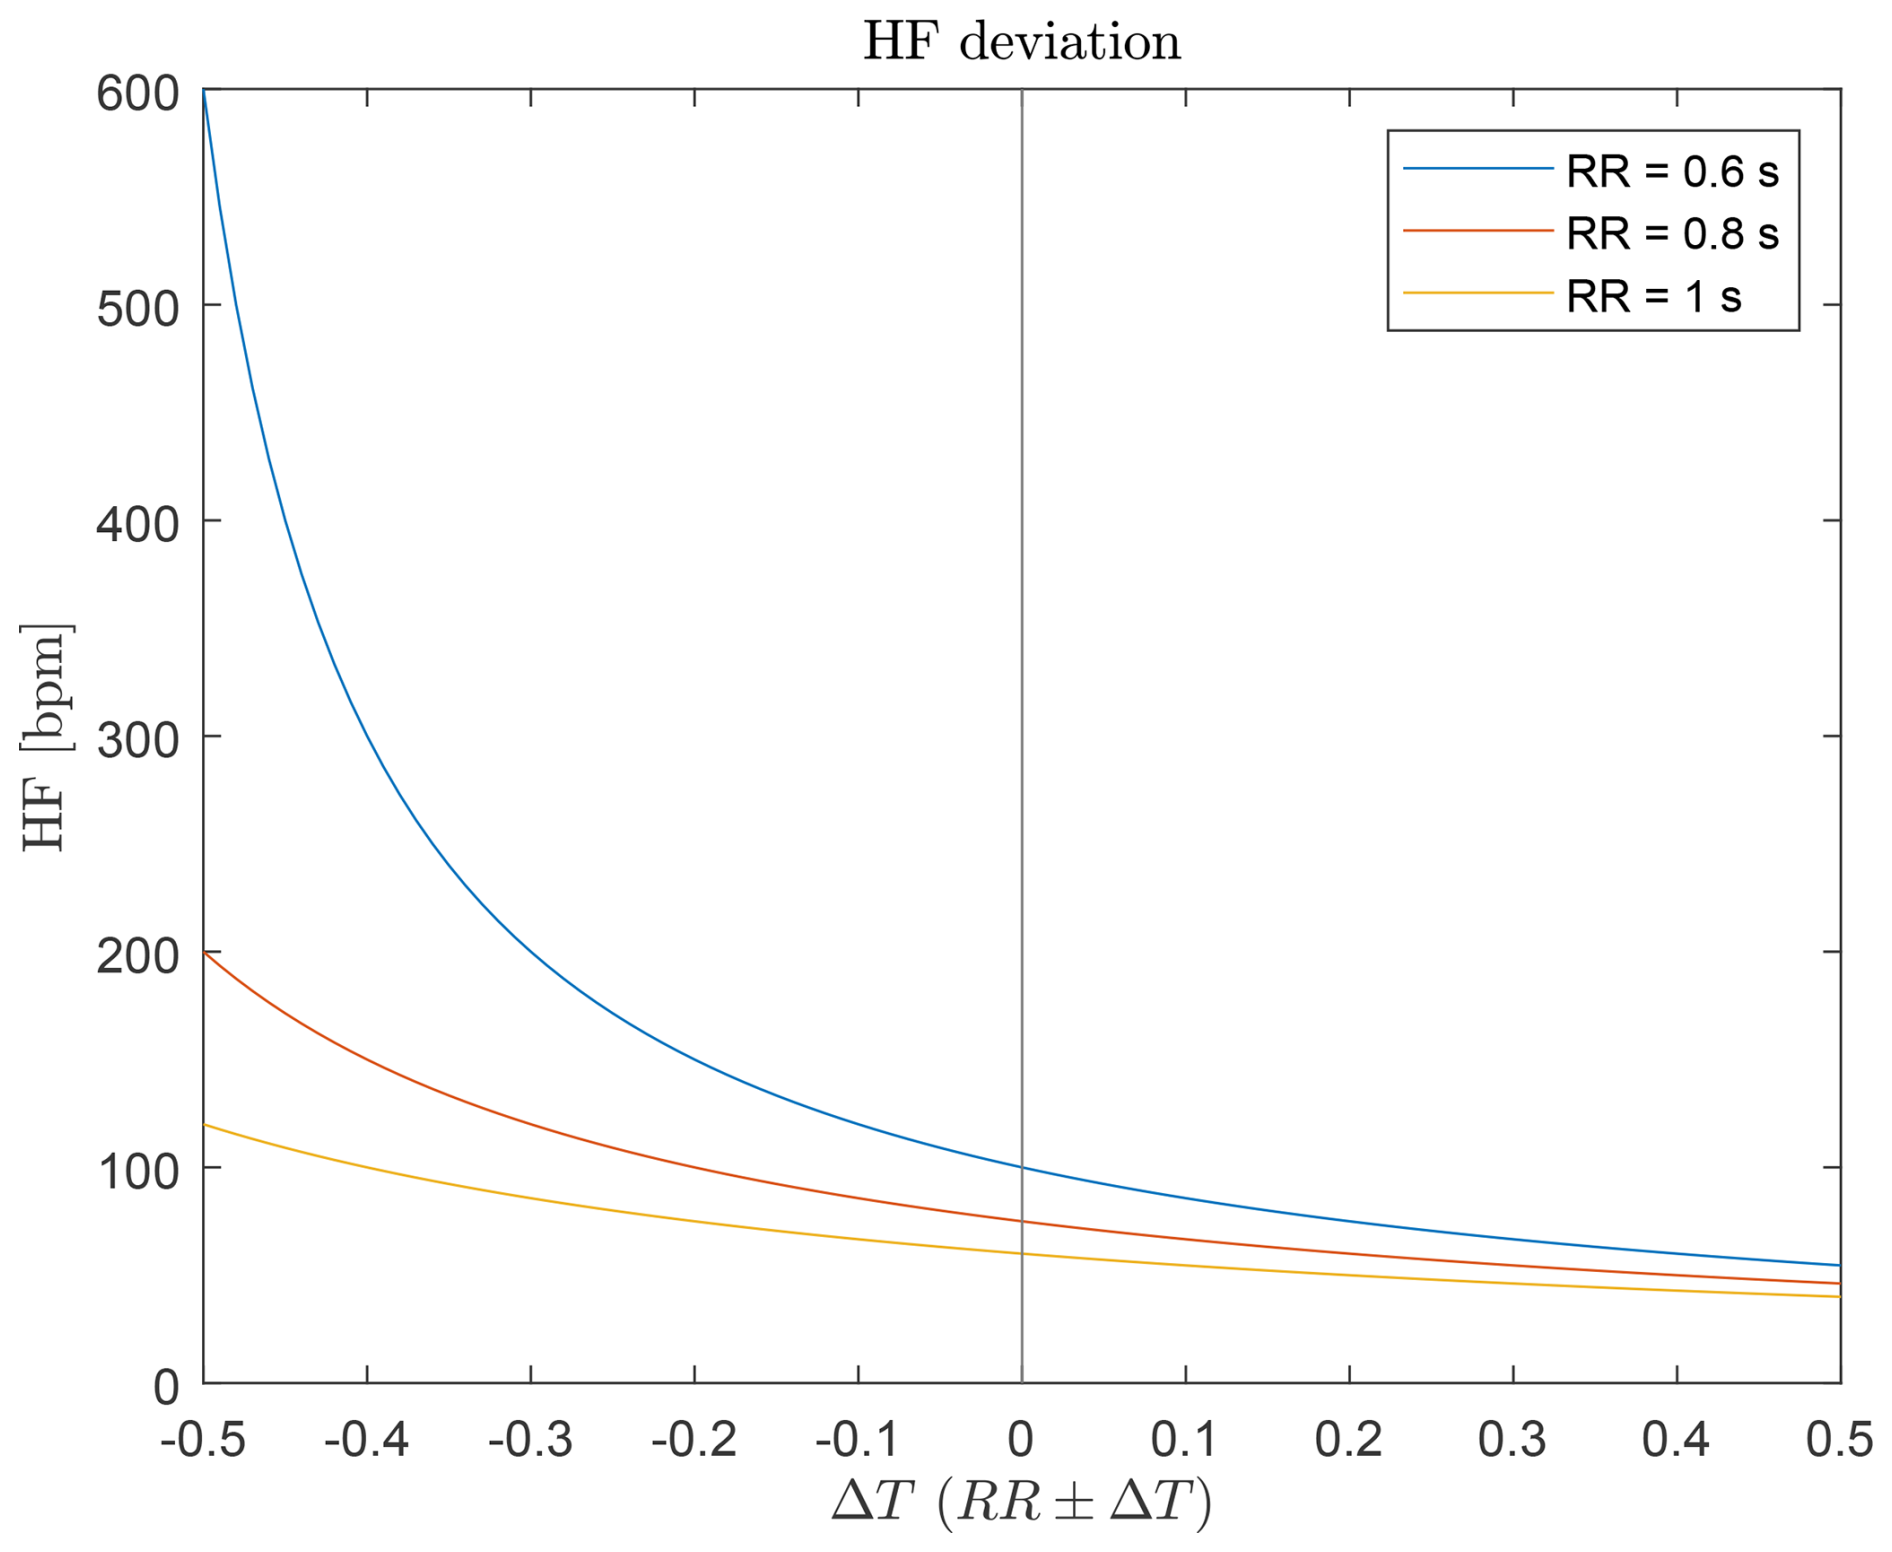
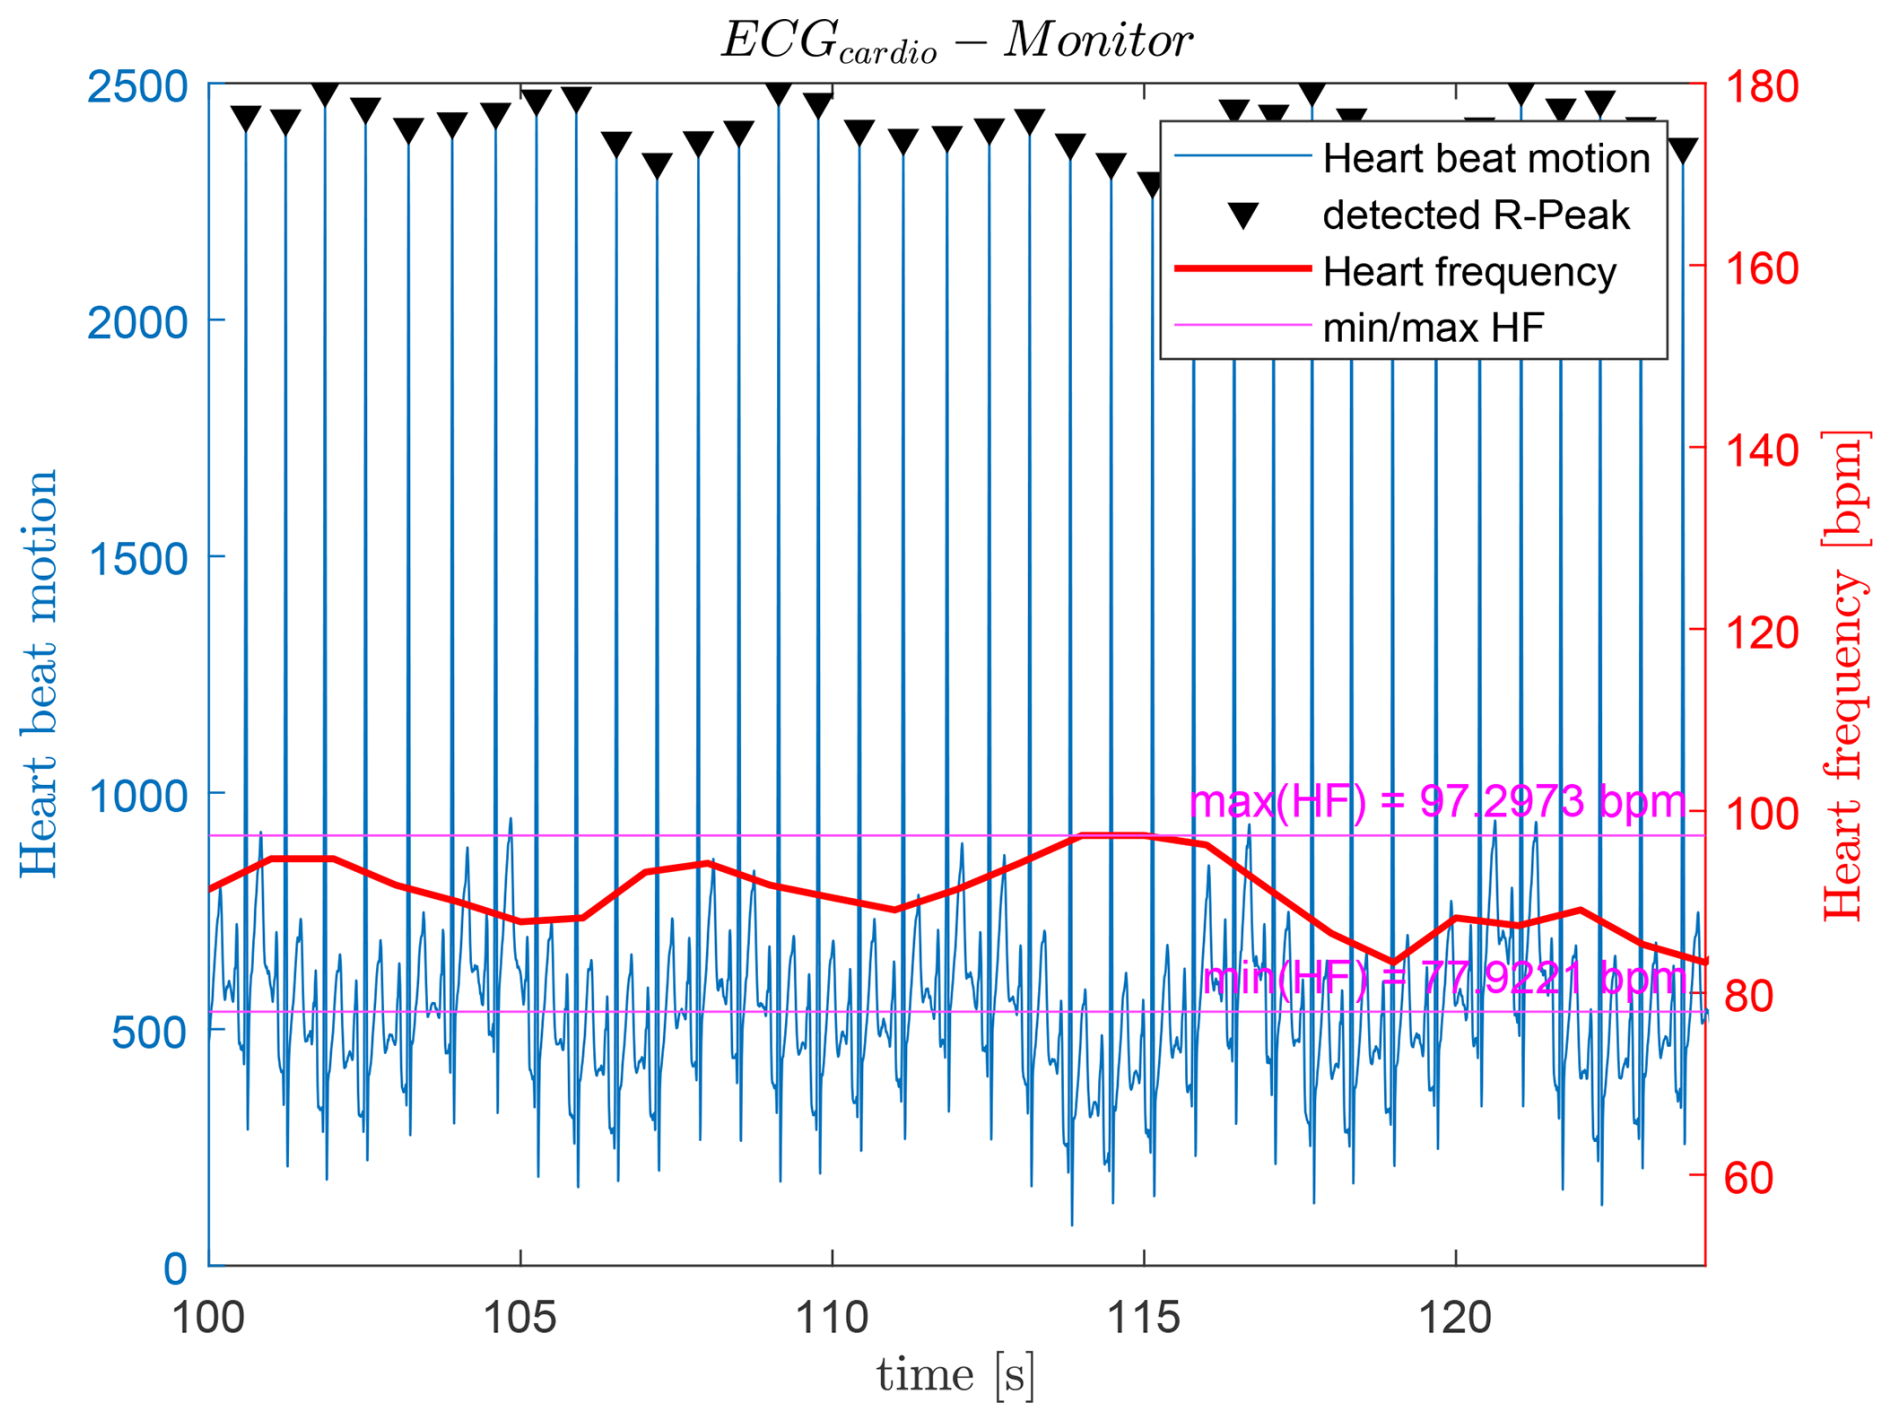
Figure 5 shows a heartbeat recording obtained from an ECG monitor while a person was sitting on a chair. The red line represents the momentary heart frequency calculated for each detected RR-interval. It can be observed that the heart frequency varies by approximately 20 bpm over the total recording time of 180 s. For improved visualization, only a 25 s segment is shown. The average heart frequency was 87.61 bpm. A slow variation in the ECG-derived heart frequency can be observed. As described in Franke-Gricksch (2021), breathing also modulates the heart frequency, a phenomenon known as Respiratory Sinus Arrhythmia (RSA). The heart frequency increases during inhalation and decreases during exhalation. In Fig. 5, a breathing frequency of approximatel 10.34 bcpm1 can be identified. An overview of RSA can be found in Franke-Gricksch (2021), Van Diest et al. (2014), Ahmed et al. (1982), and Neff et al. (2003).
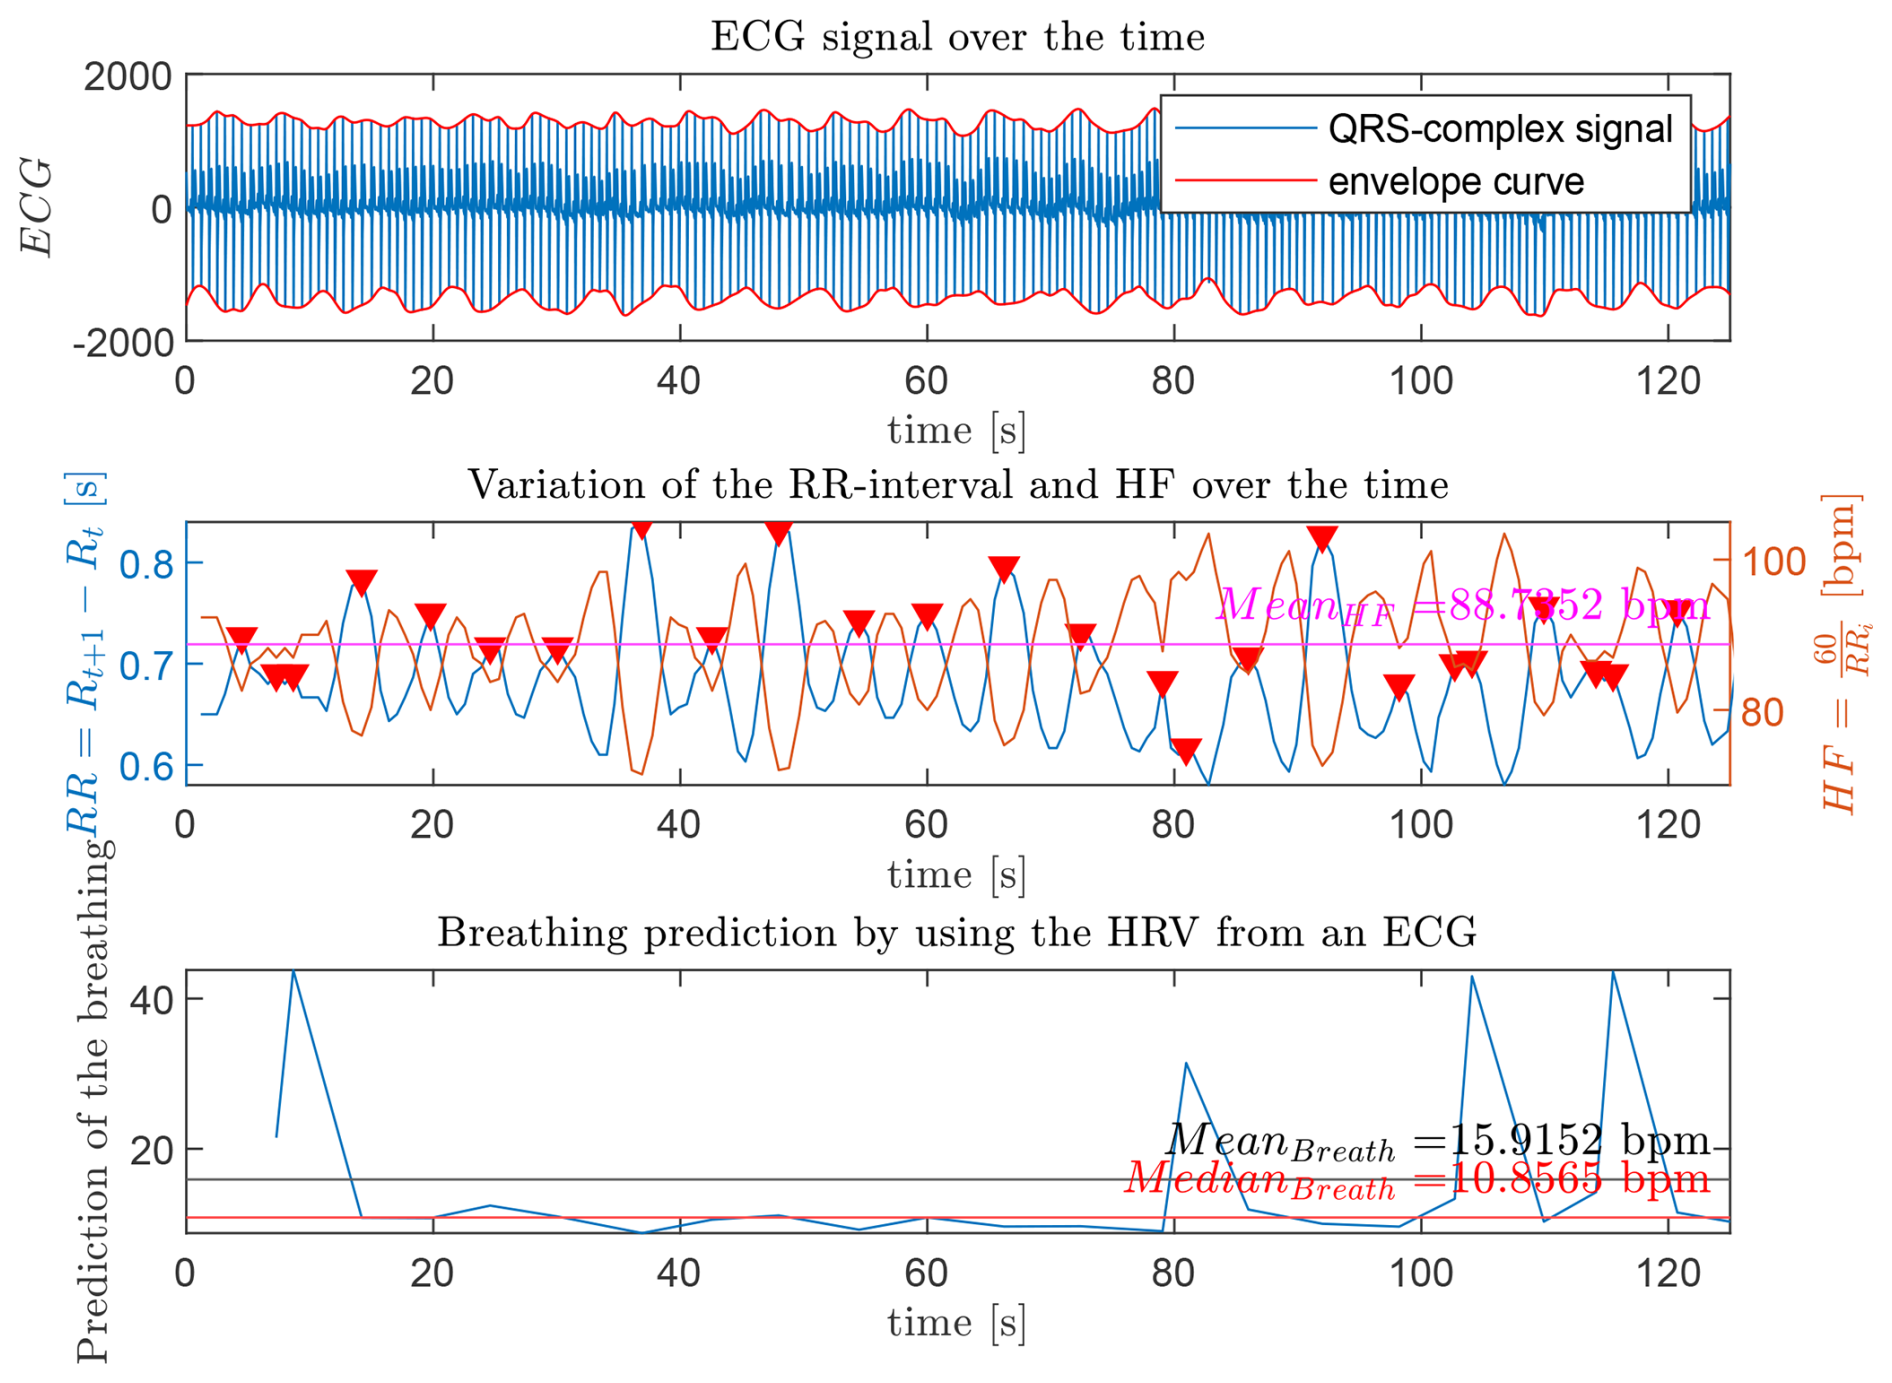
Figure 6 illustrates the relationship between the QRS-complex signal and the breathing rate. For this analysis, measurements from an ECG monitoring system are used. To derive the breathing rate from the QRS-complex signal, the following steps are required:
-
Detect the R-peaks in the QRS-complex signal.
-
Calculate each RR-interval.
-
Plot the RR-intervals over time to obtain the HRV signal.
-
Detect the peaks in the HRV time signal fRR(t).
-
Determine the time interval ΔTHRV between successive maxima of the HRV signal ().
-
Calculate the predicted breathing rate using Eq. 2.
In the middle section of Fig. 6, the detected peaks of the HRV time signal (i.e., the moving RR-intervals, shown in blue) are marked with red triangles. The time interval between two peaks () is then used in Eq. (2) to calculate the predicted breathing rate. The corresponding momentary heart frequency for all RR-intervals, computed according to Eq. (1), is shown in orange. All of these influences are essential for the subsequent signal processing.
In the following, the structure of the radar system developed at the LaROS department at Trier University of Applied Sciences is explained in the subsequent subsections. The system consists of three separate, exchangeable modules.
The radar system requires a supply voltage between 7–12 V and a current of 1–1.5 A. It can be directly connected to the LAN port of a PC for data transfer.
3.1 Radar Front-End Module
The radar front-end consists of two transmitting traveling-wave (TWA) patch antennas and four receiving TWA antennas. The radar system operates in FMCW mode with a frequency ramp from 24 to 24.25 GHz. Two integrated circuits from Analog Devices are used for this purpose: the ADF4159 controls the TX frequency within a phase-locked loop, and the ADF5901 generates the 24 GHz signal. The transmit section is described in detail in Steins et al. (2016). For reception, the down-converter ADF5904 from Analog Devices is employed. Information about the antenna design can be found in Diewald and Müller (2019).
3.2 Filtering, Amplification, and Conversion Module
For filtering the radar baseband signal, a cascaded third-order low-pass filter with a cut-off frequency of 3 kHz is used for anti-aliasing. As noted in Sect. 3.1, the radar has a bandwidth of 250 MHz and a ramp repetition rate of 62.5 Hz. This corresponds to an 8 kHz sampling rate from the analog-to-digital converter for detection up to 38.4 m, with 128 points sampled per frequency ramp. Equation (3) determines the distance between the radar and the measured object. Here, c0 denotes the speed of light, fBW the frequency sweep of the FMCW radar signal, frep the ramp repetition rate, and frecv the measured frequency in the received radar signal.
For amplification of the received radar signals, a fully differential, low-noise operational amplifier (LTC6363) from Analog Devices is used, which can also serve as an ADC driver. To digitize the received signals, a 16-bit sigma-delta analog-to-digital converter (MAX11060) from Maxim Integrated is employed, featuring four differential inputs and simultaneous sampling.
3.3 Control and Data Transfer Module
For configuration of the radar ICs, ramp triggering, data conversion management, and data transfer, a microcontroller from Microchip (PIC32MZ2048EFG100) is used which provides Ethernet and USB interfaces.
The Ethernet connection is used for data transfer between the computer and the radar system, while the USB connection can be used for system debugging. The Ethernet interface requires an off-chip peripheral, implemented here with an external driver (LAN8742A) from Microchip.
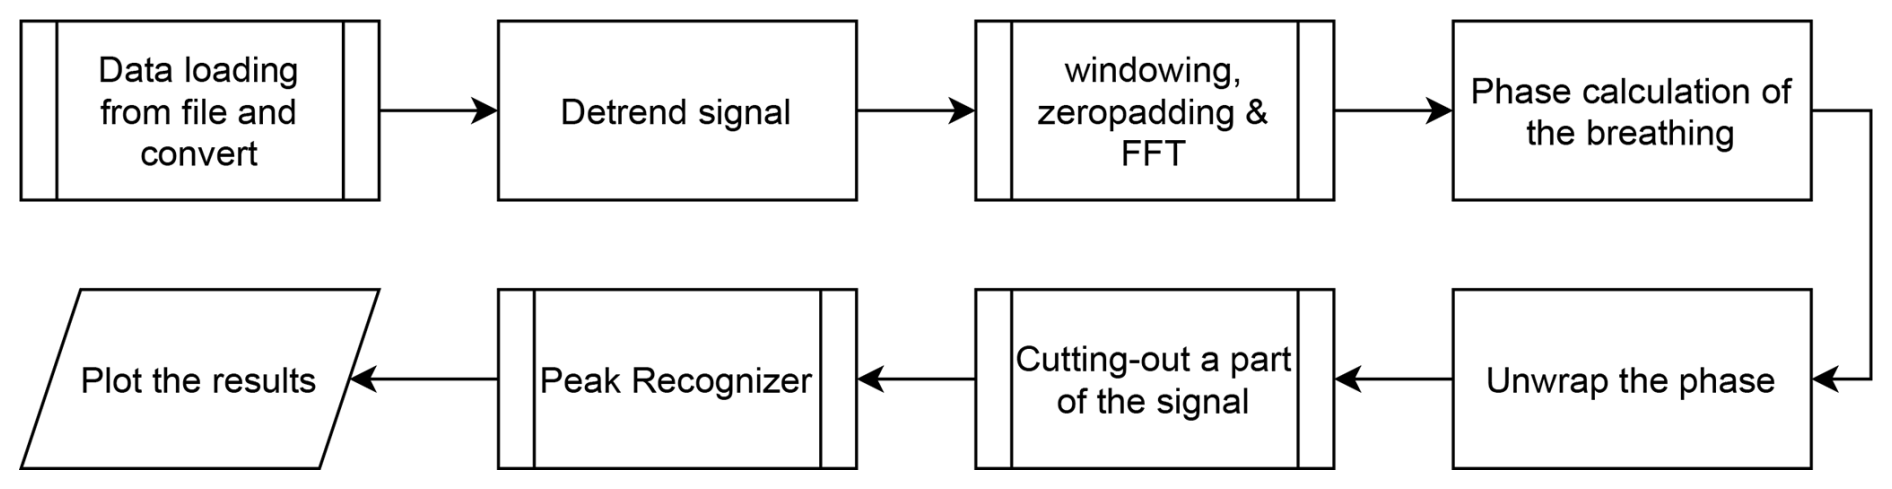
Figure 7 shows the workflow for extracting the breathing rate from the recorded radar signal. First, the radar data are loaded and split into the different antenna channels and ramps, initializing the so-called radar cube. To remove potential electronic offsets from the received signals, the signals are detrended. A one-dimensional FFT is computed over each frequency ramp and each channel.
Using the results from the FFT, the target's position is determined and the phase motion is calculated as in Eq. (4).
Here, represents the complex value after the FFT, f the frequency bin where the target is observed, and t the time index. α is the calculated phase motion. Before peak detection, the phase must be unwrapped. The MATLAB findpeaks function is used for peak detection; further details can be found in the MATLAB documentation (MathWorks Deutschland, 2026c). The frequency bin corresponding to the target is identified by the maximum peak in the amplitude spectrum . The phase motion α corresponds to the chest movement due to breathing. Finally, peaks in the phase motion are detected and used to calculate the breathing rate over all timestamps.
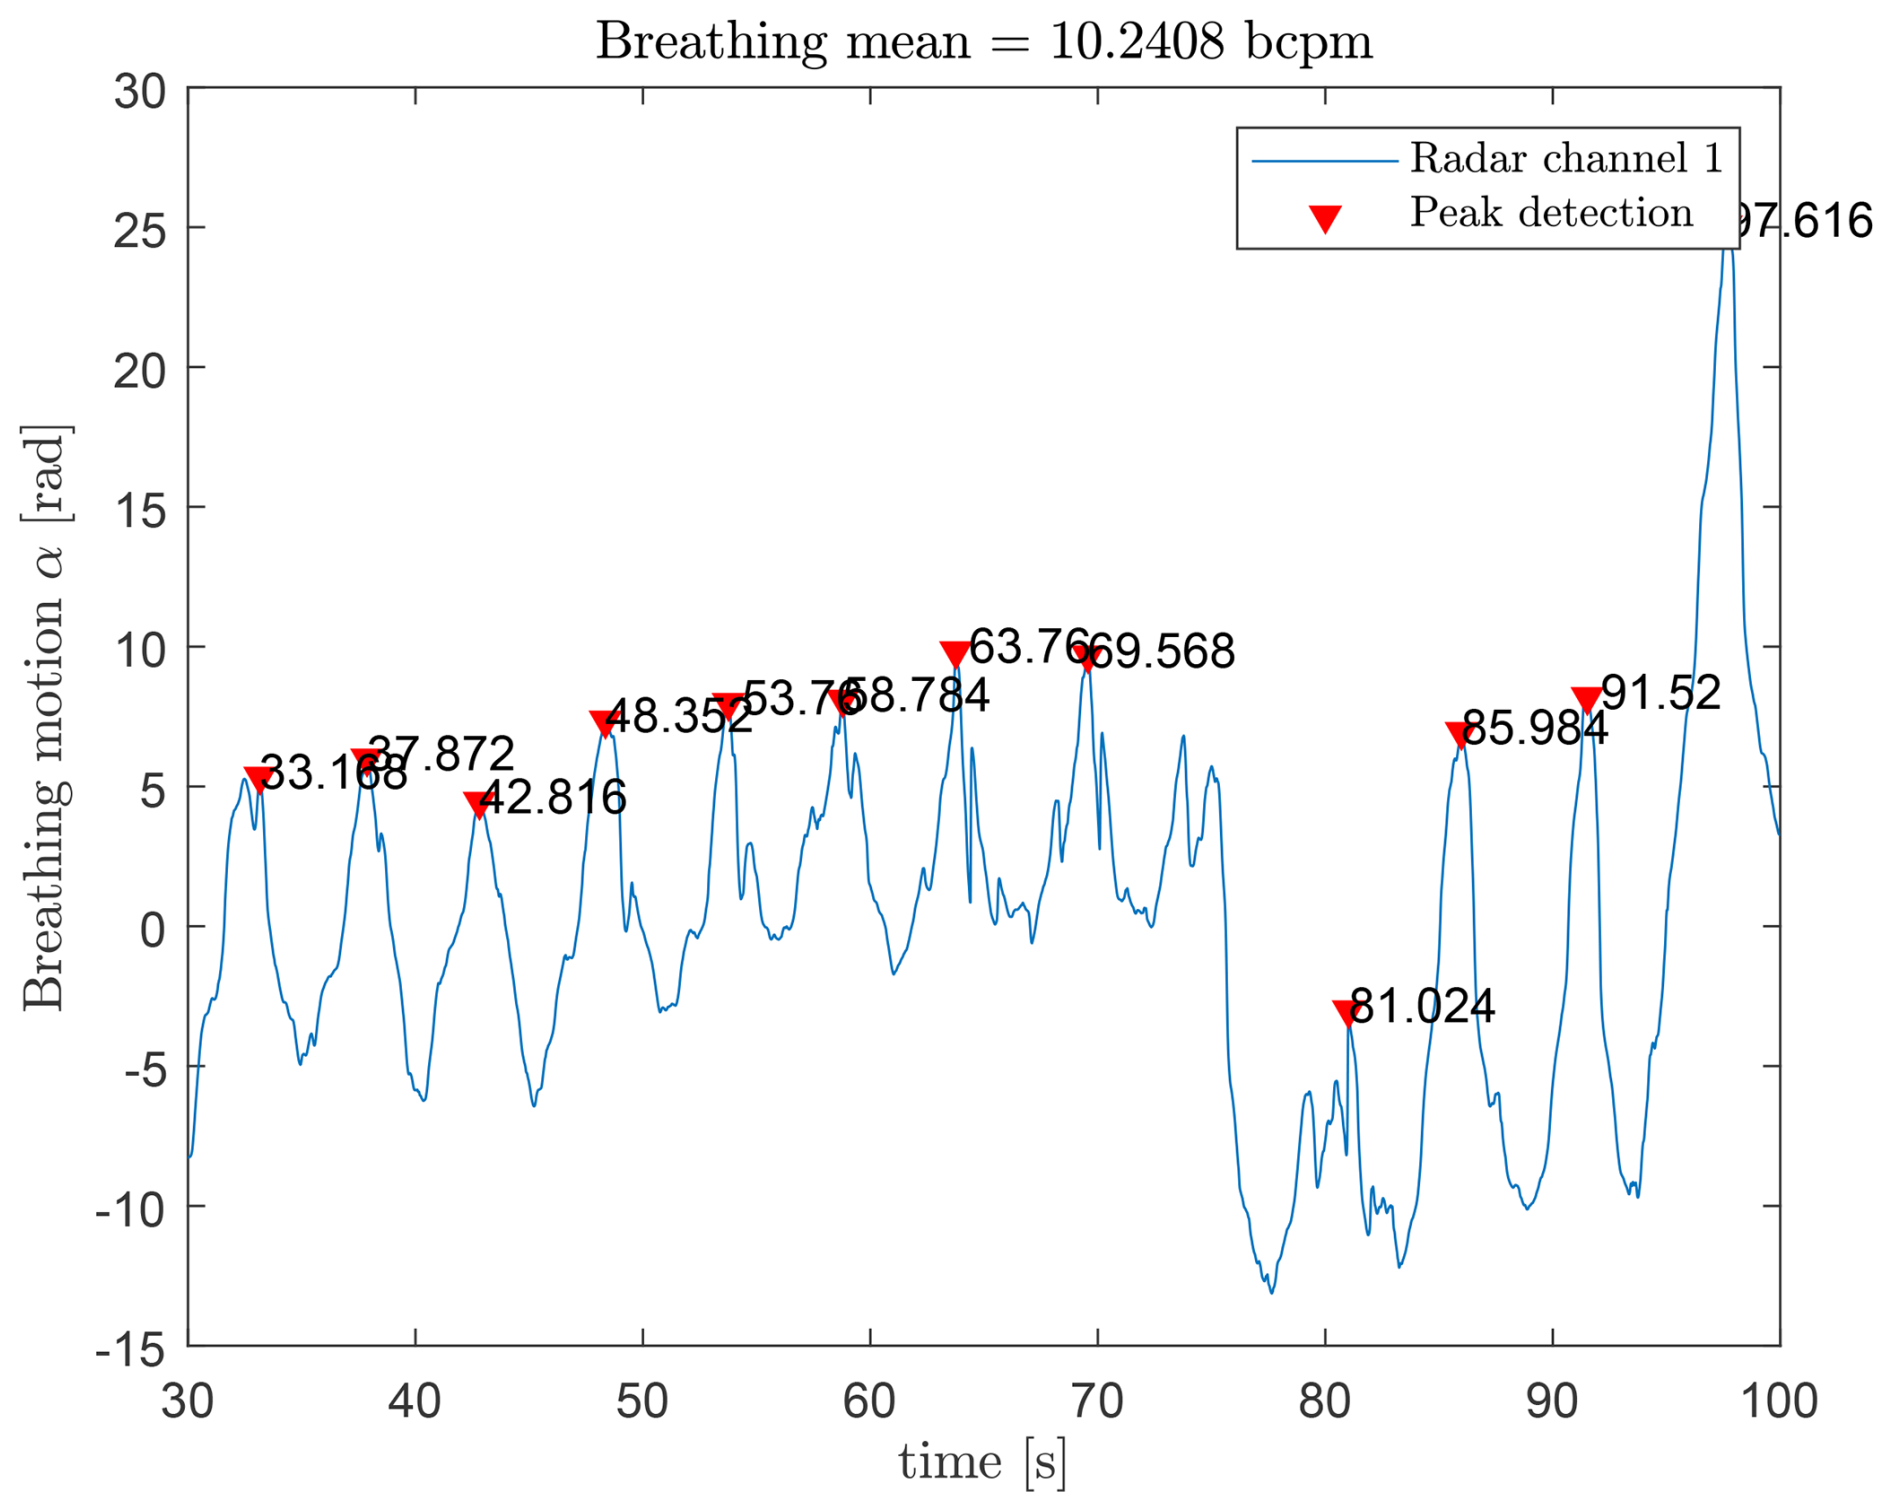
Figure 8 shows the detected breathing rate of a person in front of the radar. The blue curve represents the breathing motion, and the red triangles indicate detected peaks. Using the timestamps, a mean breathing rate of 10.24 bcpm is obtained.
4.1 Signal Processing for Heartbeat Detection
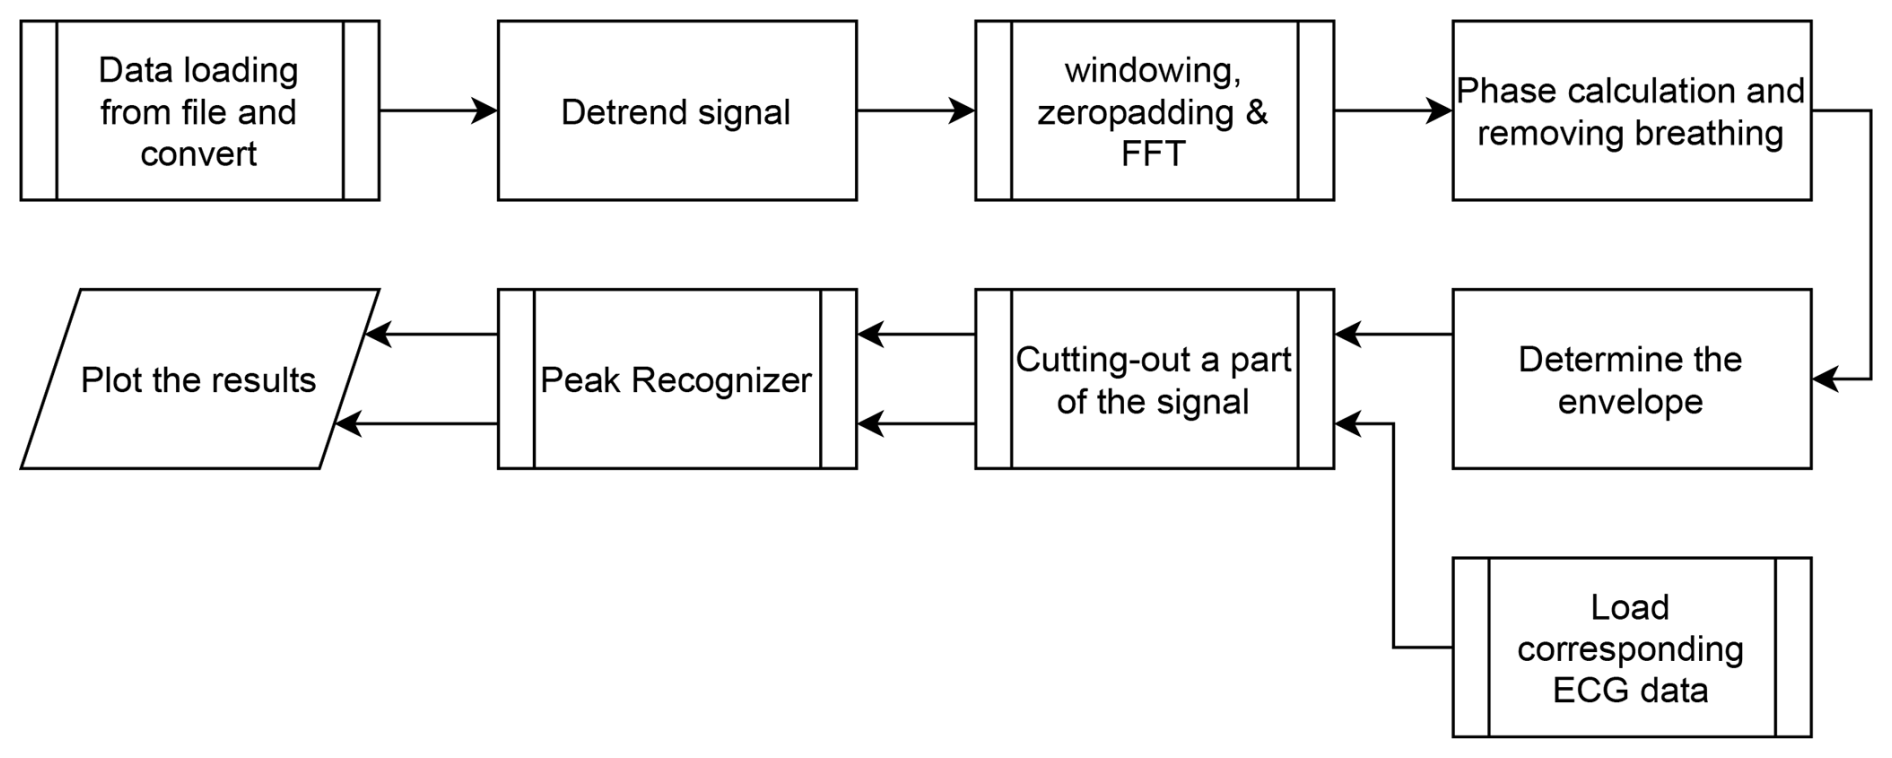
The general process for heart rate detection is explained in the following. Figure 10 shows the workflow for the heartbeat signal processing chain. The first three steps are identical to the breathing extraction.
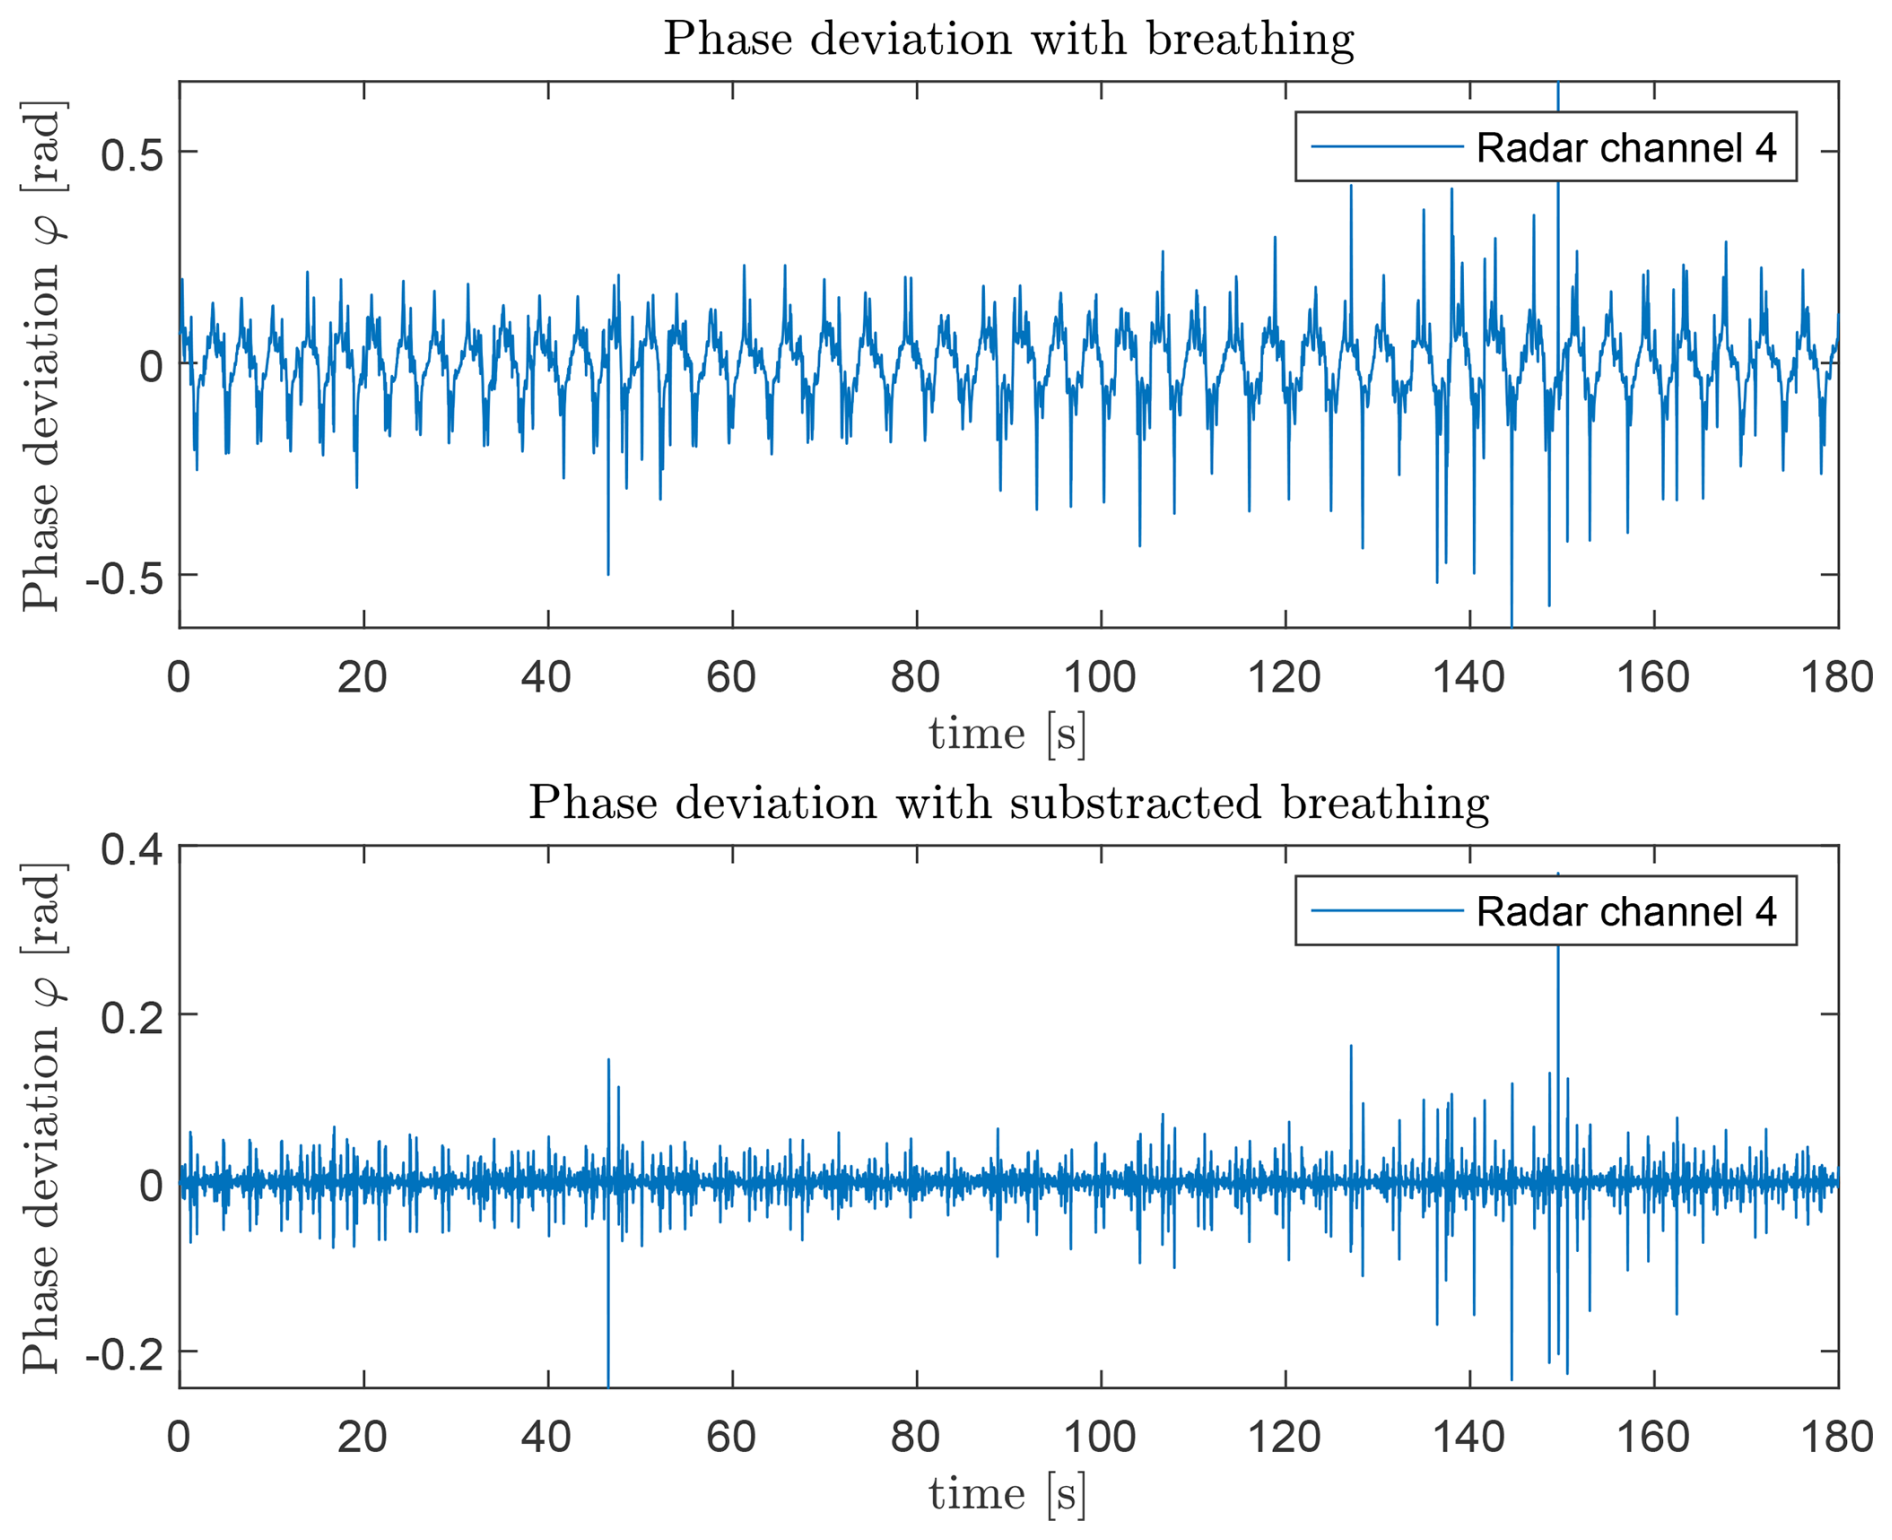
After the FFT, the chest movement is observed at the same range as for breathing extraction. For heartbeat motion extraction, the derivative of the phase motion is computed as in Eq. (5):
Here, denotes the complex conjugate, equivalent to the difference of phases at successive time points, approximating the phase derivative. To remove the breathing component, the phase signal φ(f,t) is smoothed with a non-causal fastsmooth function (O’Haver, 1997). The smoothed phase is subtracted from the phase derivative, analogous to a non-causal high-pass residual. The result is shown in Fig. 9. The remaining phase deviation exhibits periodicity corresponding to the heartbeat.
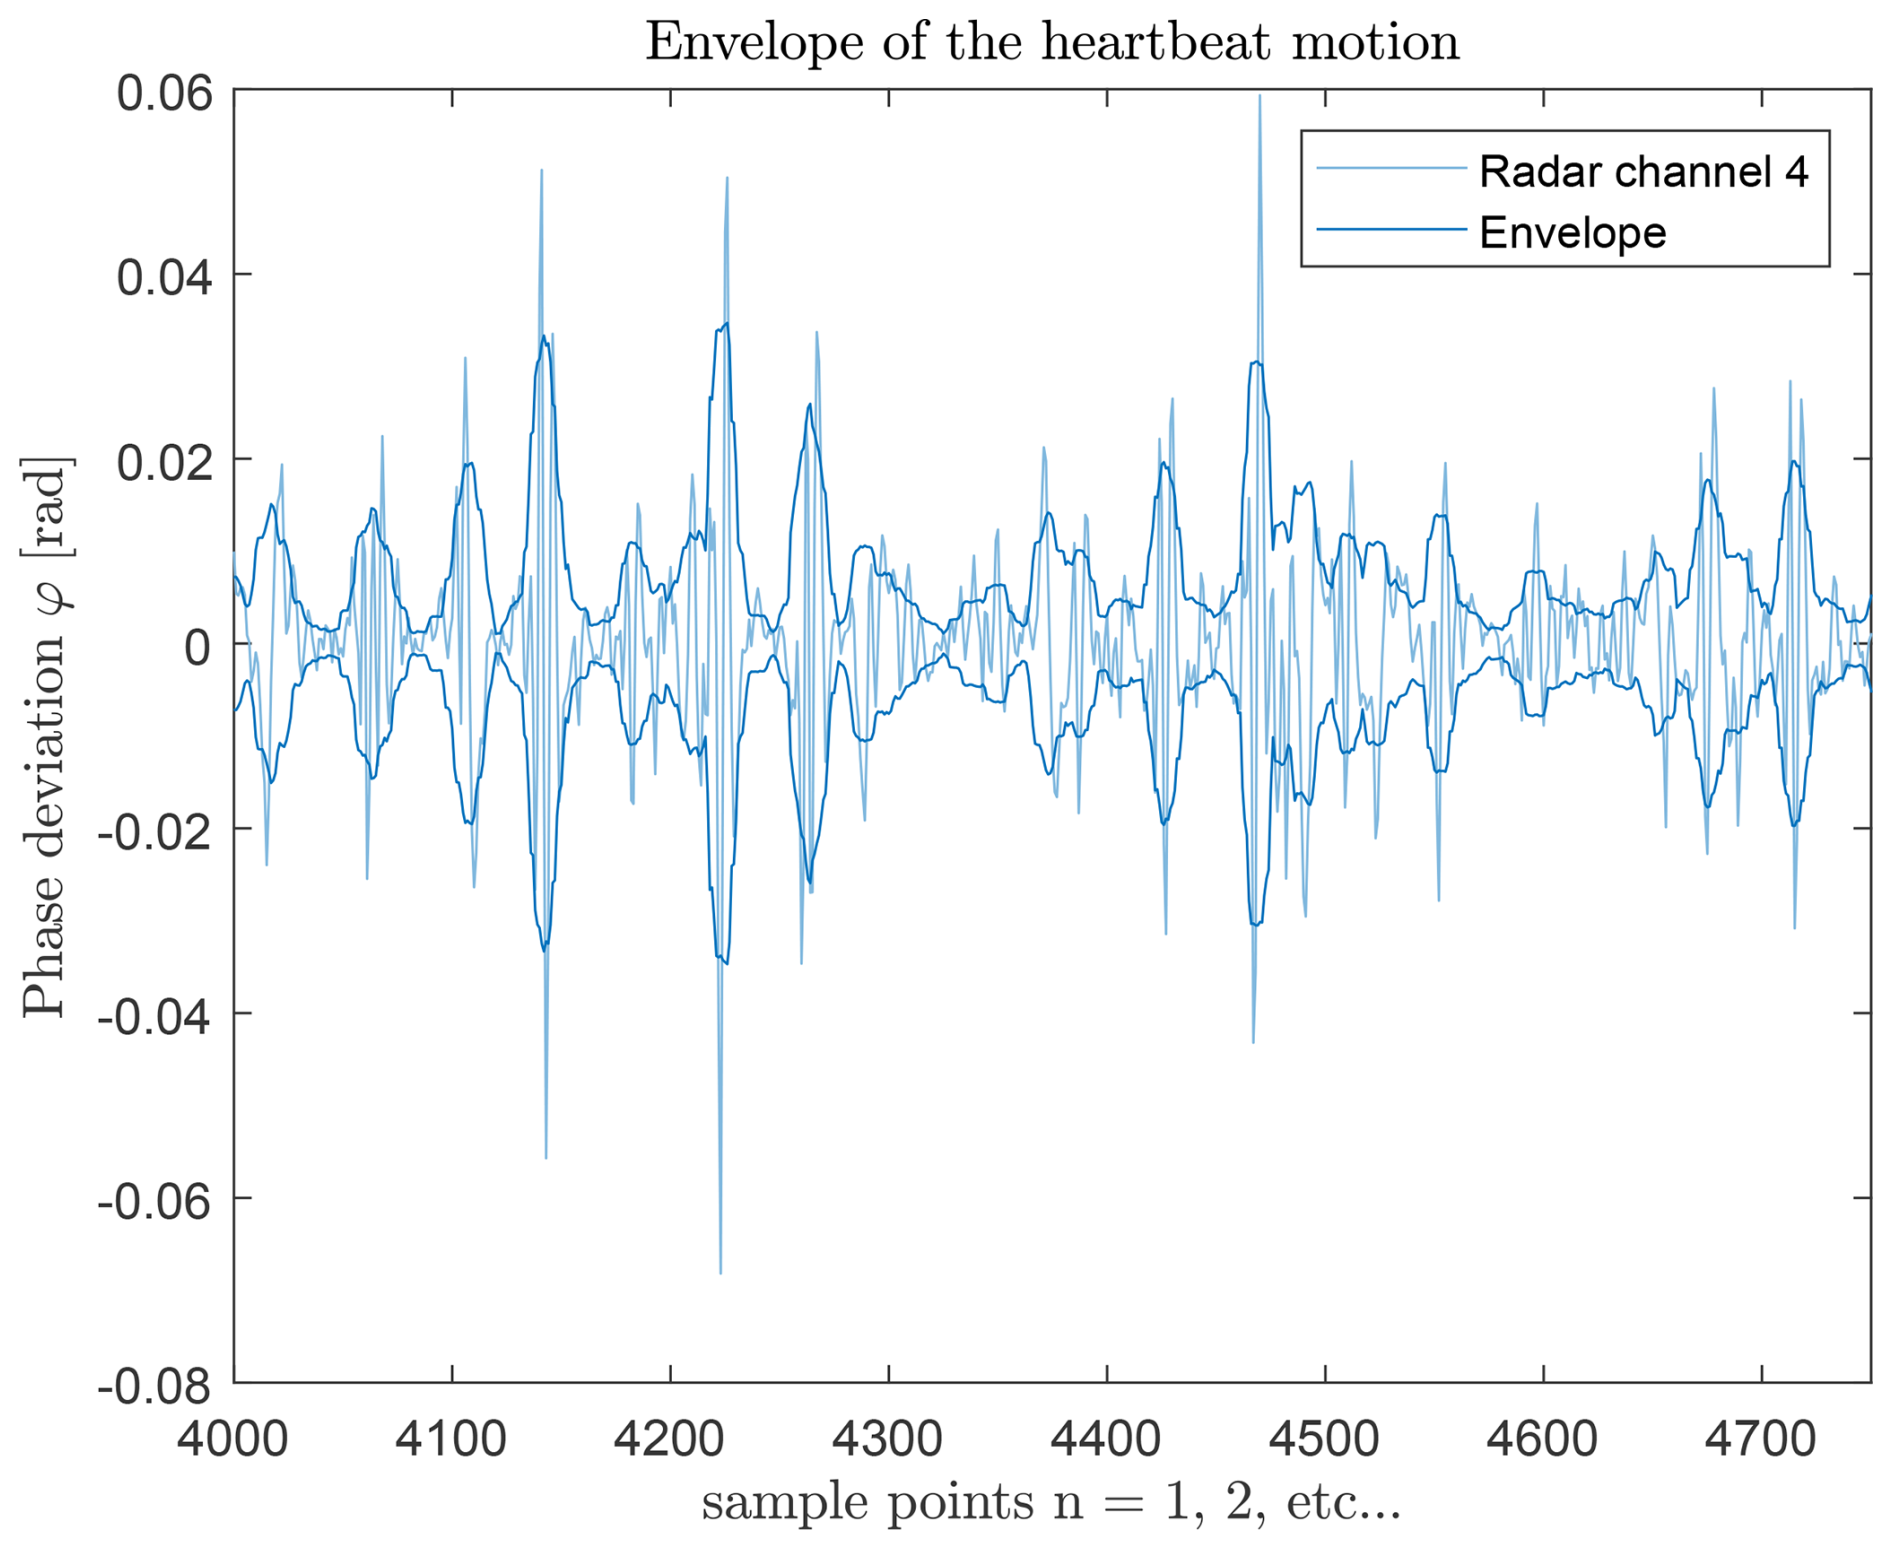
The non-causal MATLAB envelope function (MathWorks Deutschland, 2026a, b) is applied to calculate the envelope θ(t) of the phase signal:
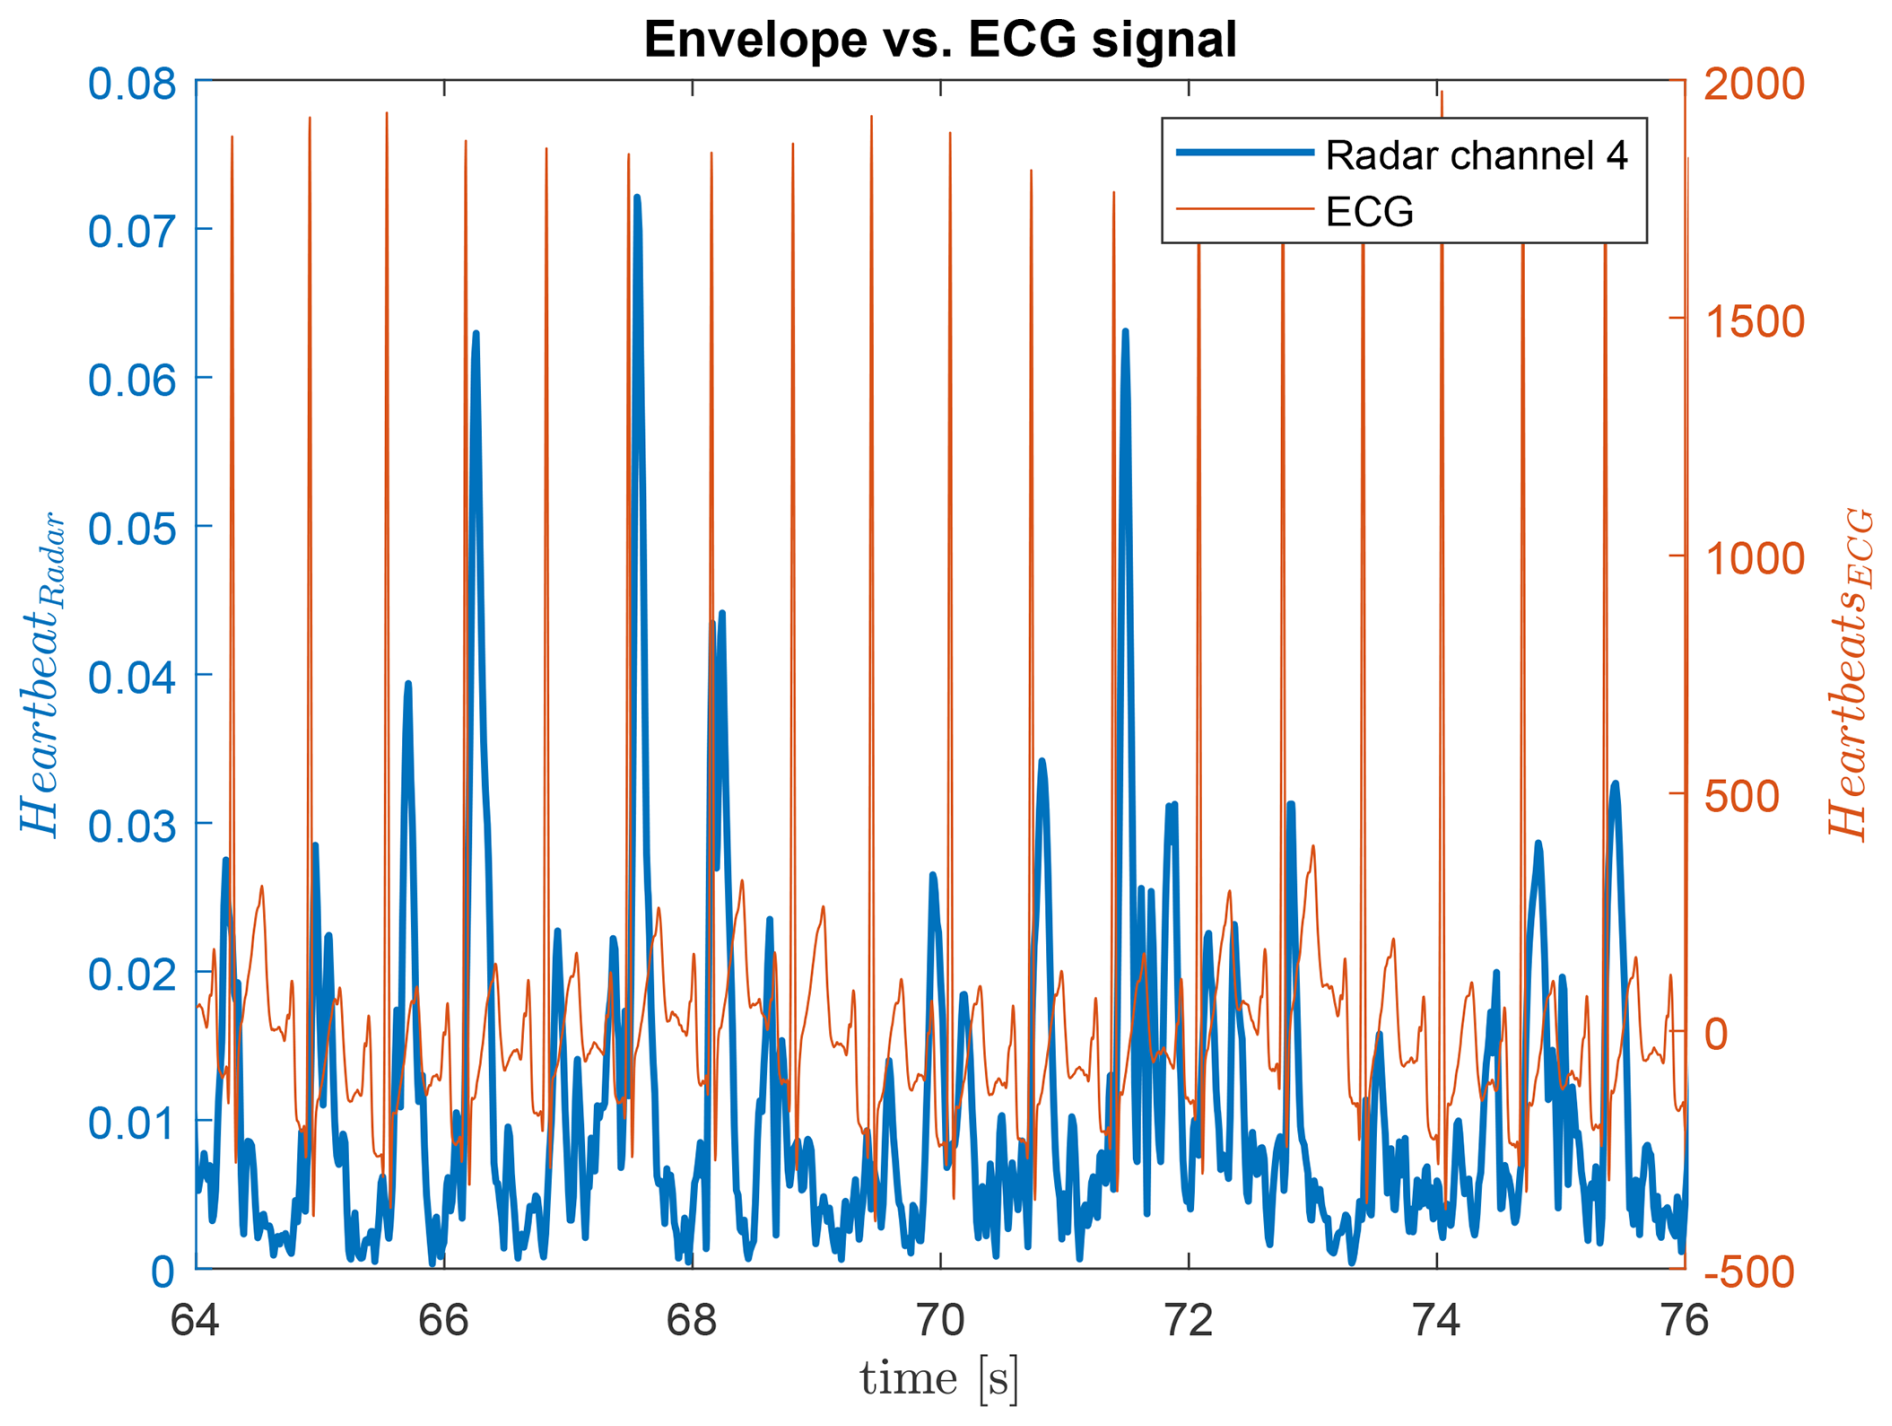
Figures 11 and 12 show the extracted envelope and its comparison to the ECG reference, respectively. Peaks in the envelope and ECG signals do not exactly coincide due to respiratory sinus arrhythmia, but the average peak distances match.
The findpeaks function is used to determine the heartbeat frequency. It returns peak amplitudes and timestamps. Parameters such as minimum peak distance, fixed at 0.3 s, ensure a maximum detectable heart rate of 180 bpm, see Eq. (7):
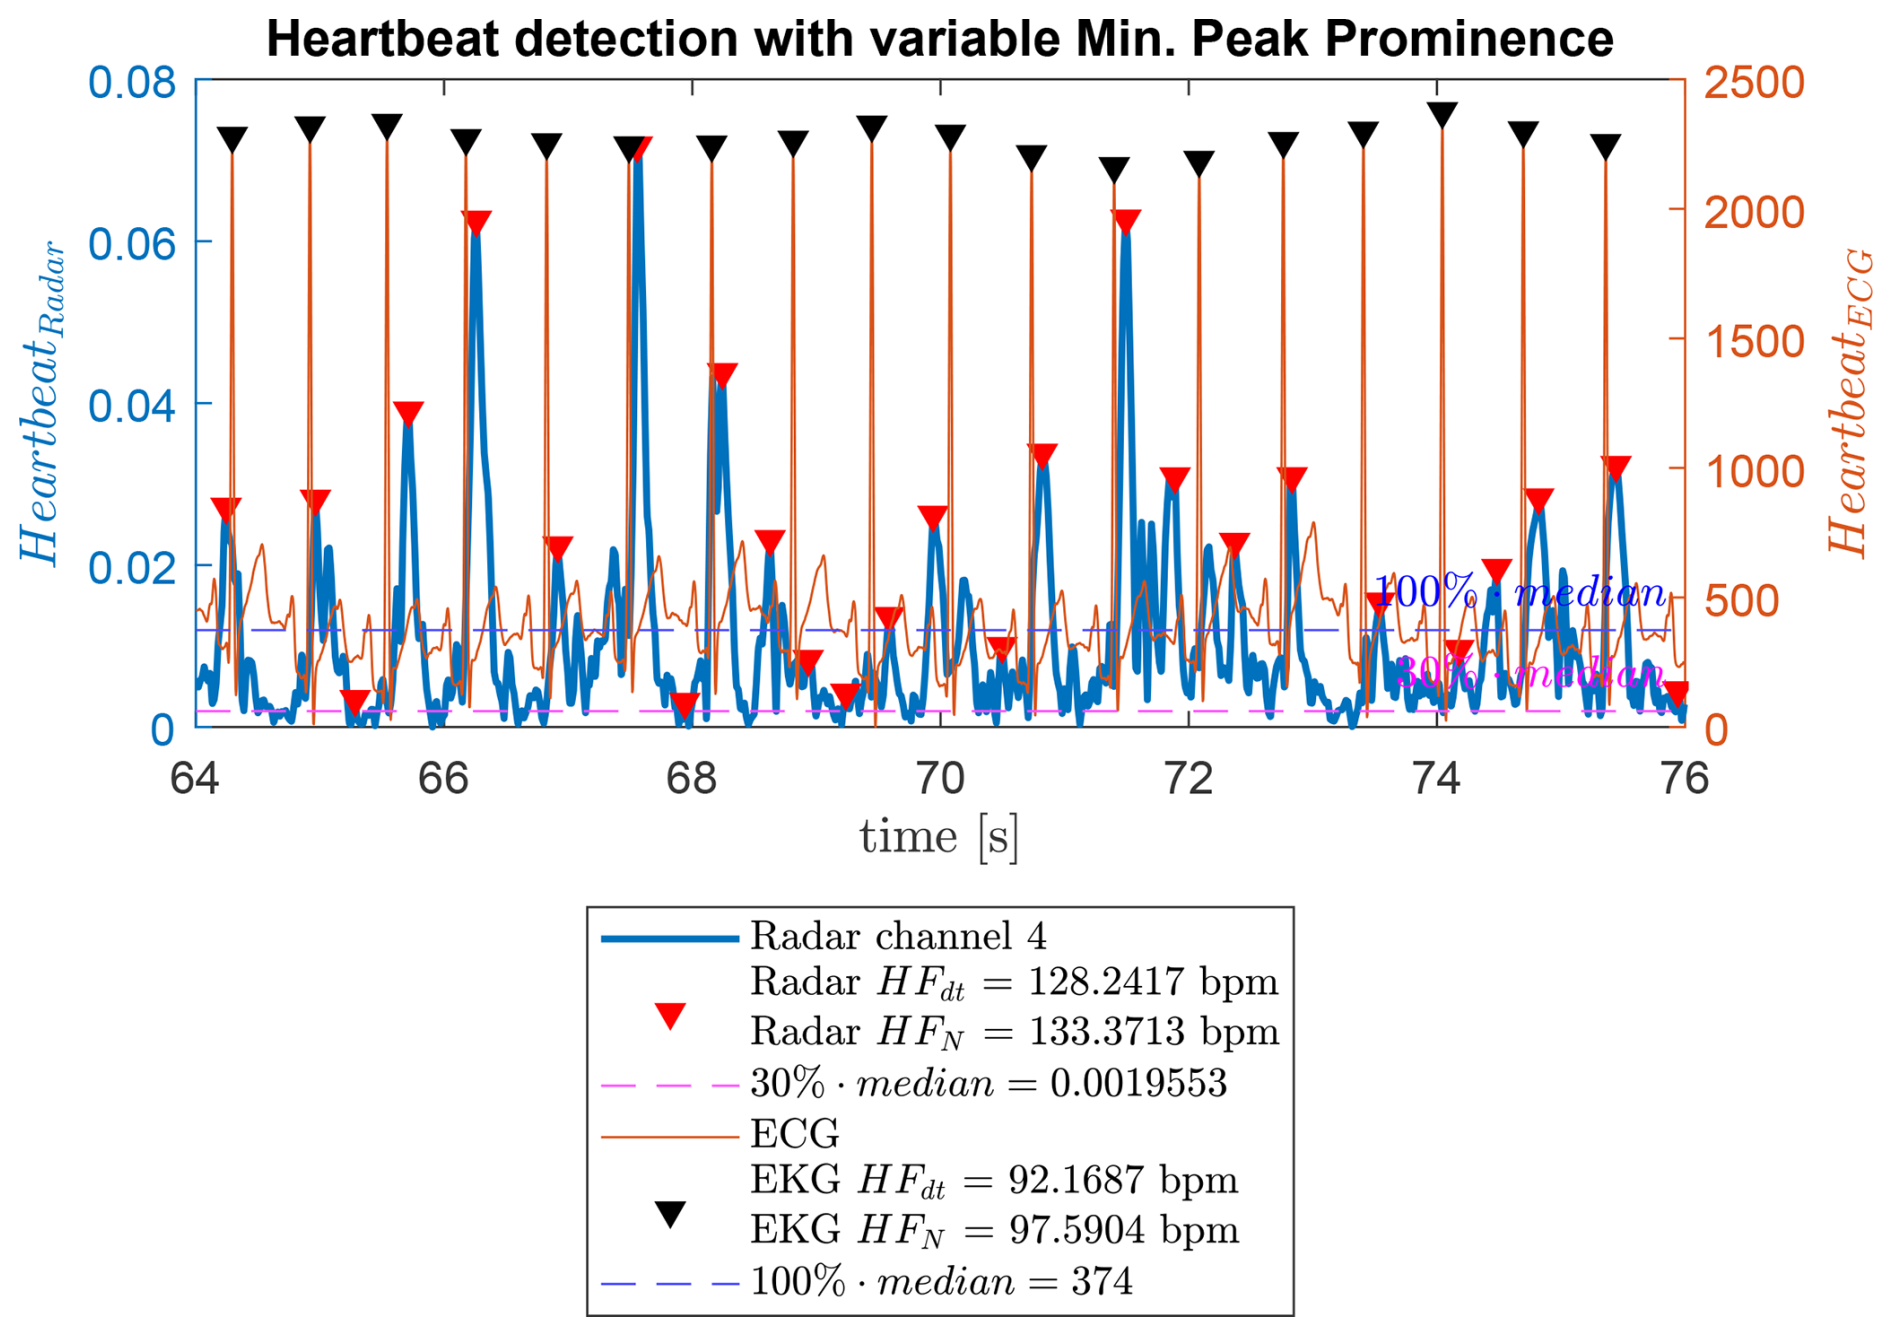
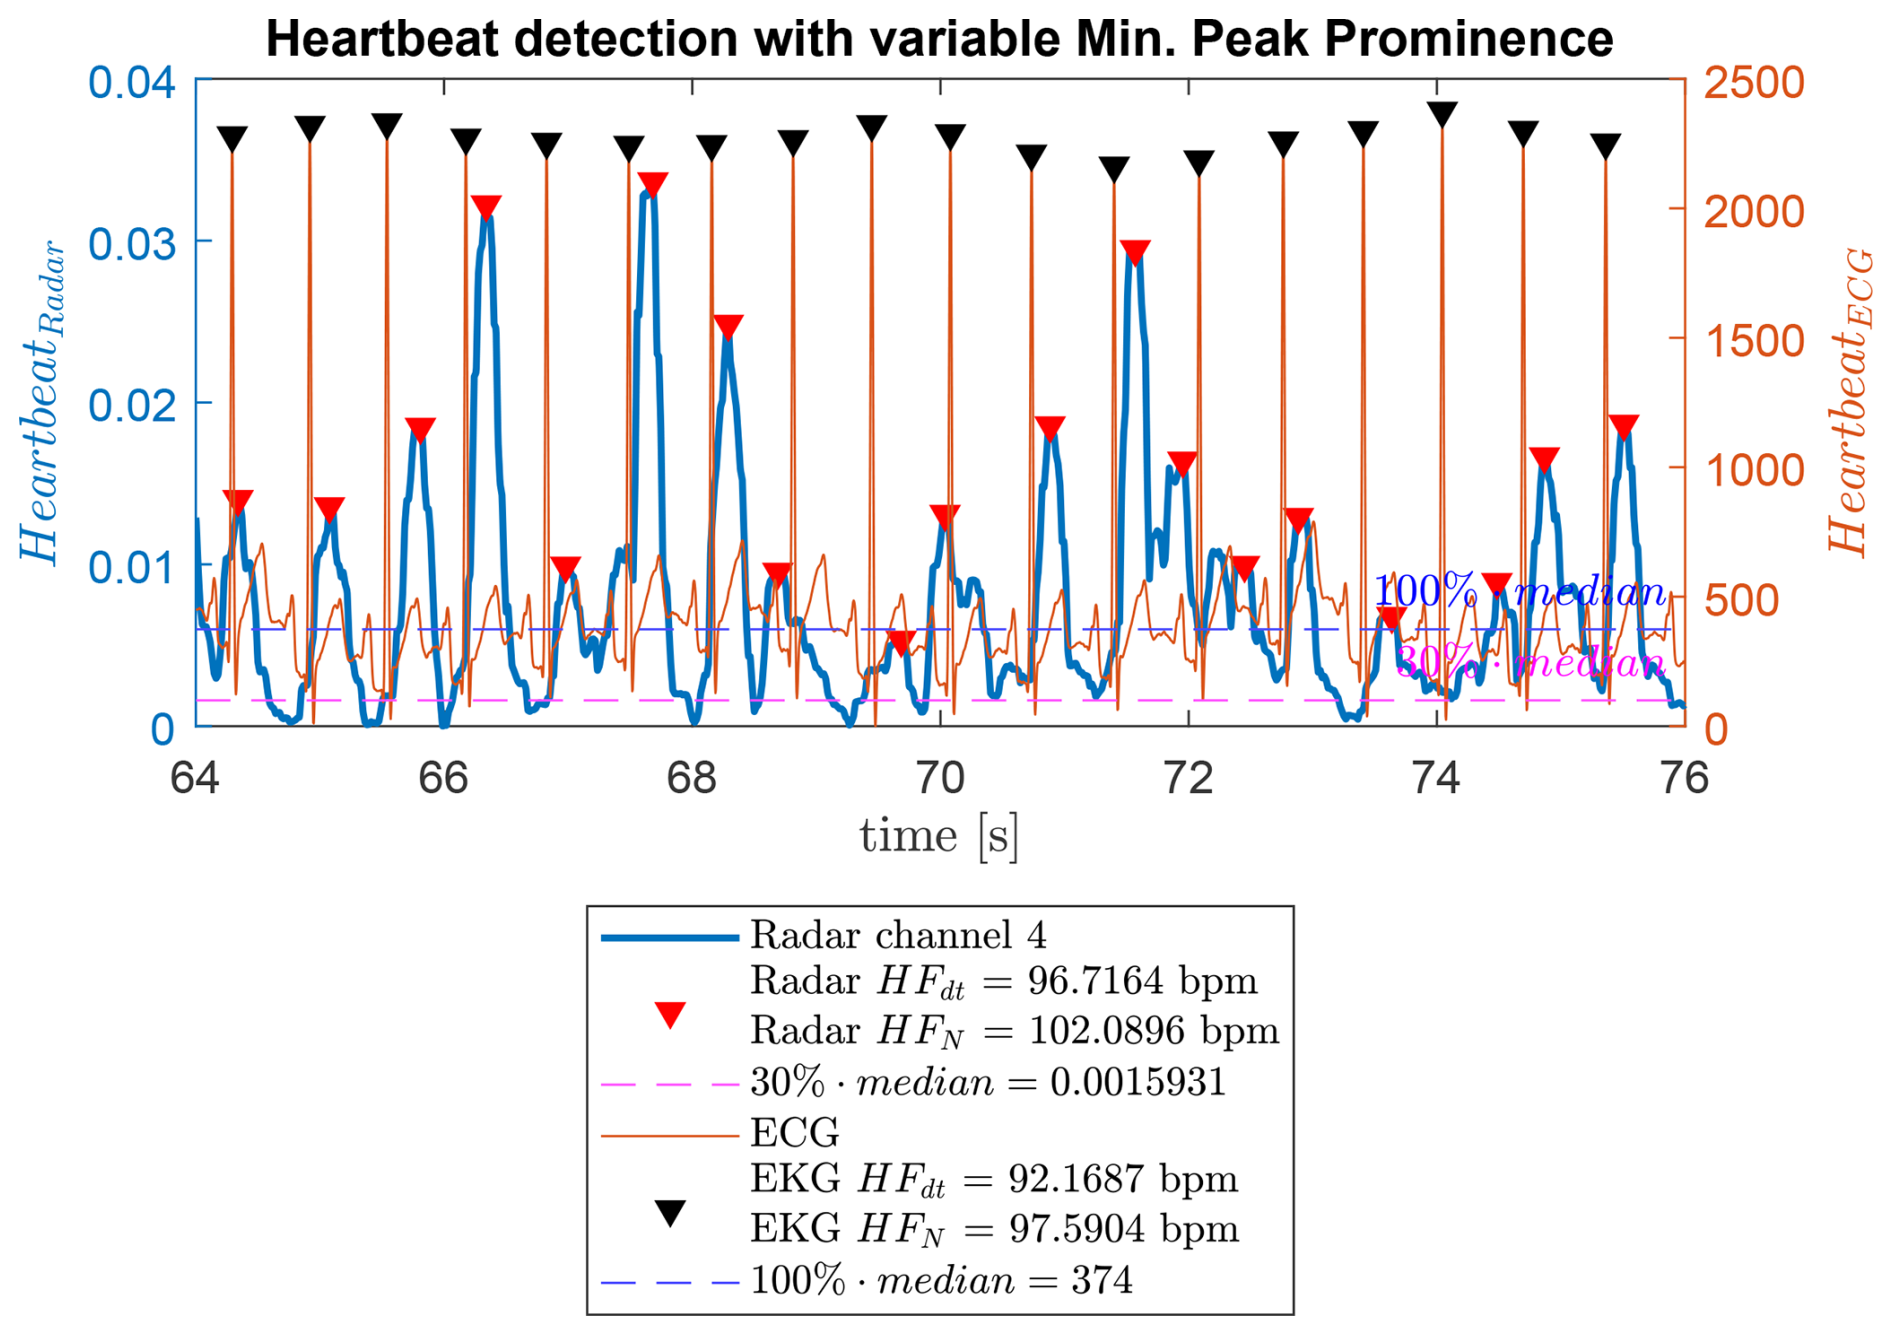
Since peak amplitudes vary, a fixed threshold may miss peaks. This is mitigated by calculating the median of the heartbeat envelope and using a fixed ratio of this median as the minimum peak prominence. The average heart frequency over the measurement is calculated from the timestamps of detected peaks:
4.2 Transition to Real-Time Suitable Algorithms
While Fig. 10 illustrates a non-real-time workflow where breathing removal is performed using the fastsmooth function (O’Haver, 1997) and the envelope is obtained with the Hilbert Transform, both methods are unsuitable for real-time applications.
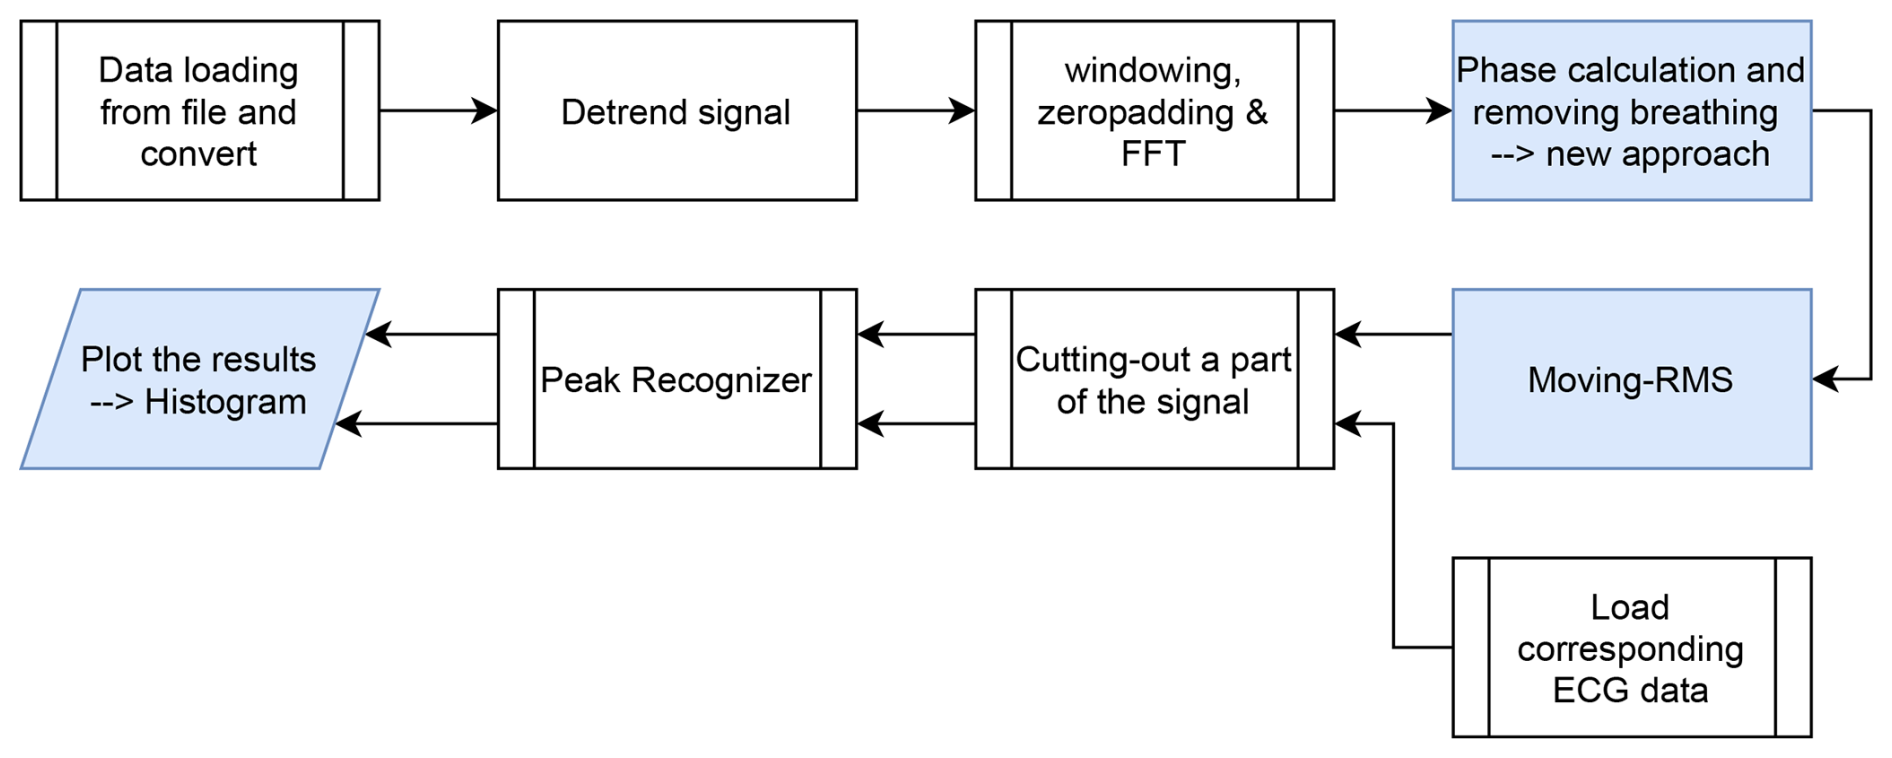
To enable real-time processing, the fastsmooth function is replaced by a moving-average filter, and the Hilbert Transform is replaced by a moving-RMS method (Fig. 13).
4.2.1 Moving-Average Filter
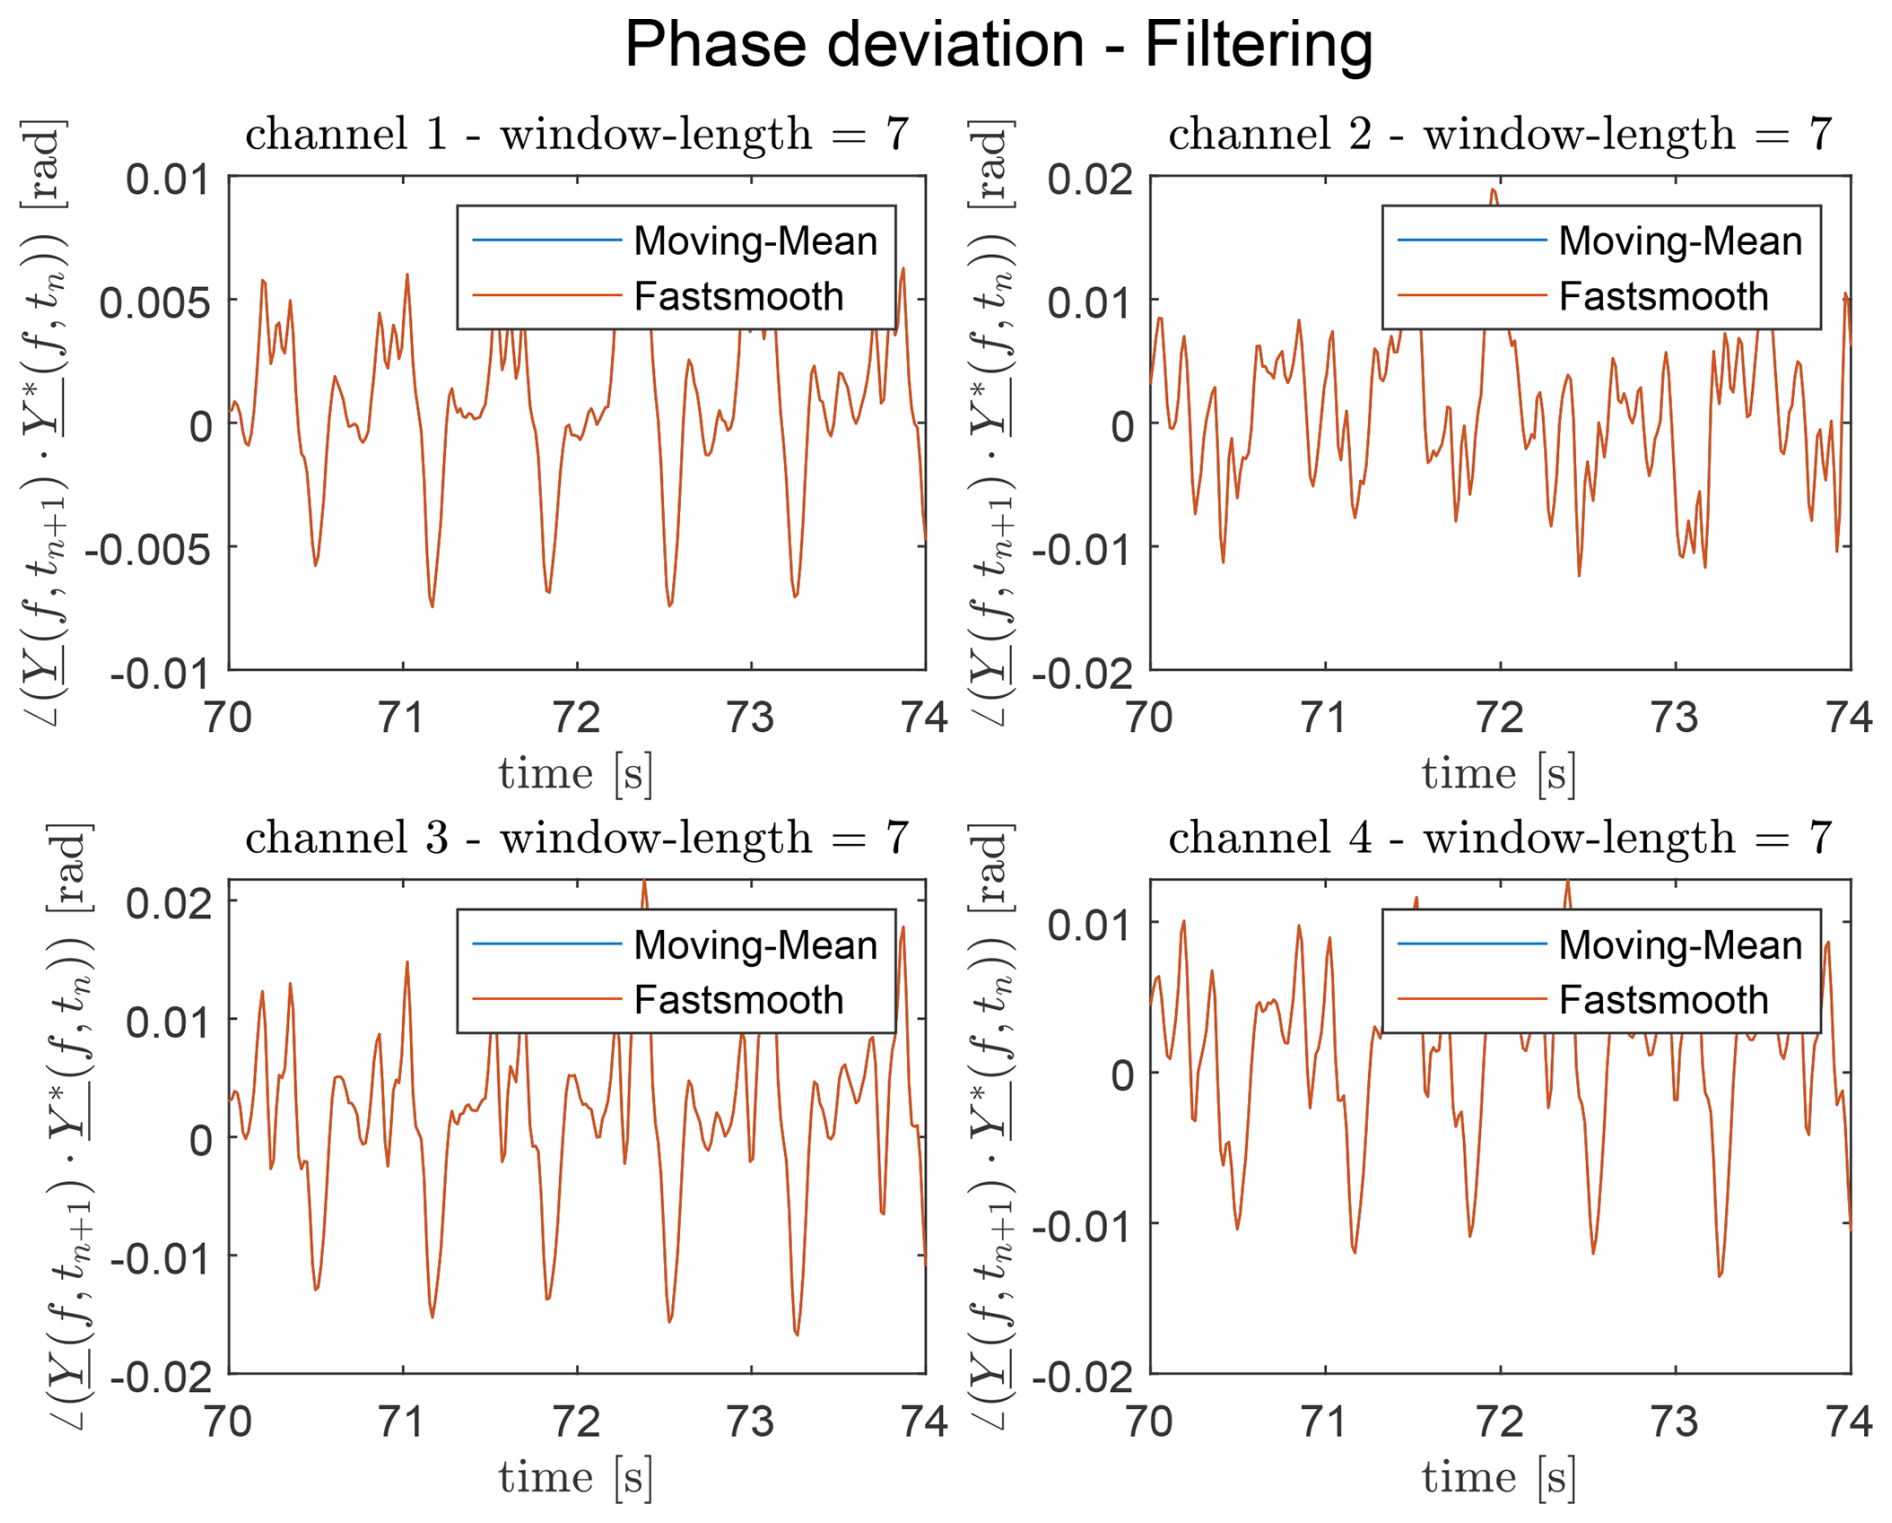
The moving-average filter reduces computation and memory requirements compared to fastsmooth. For odd window sizes, it reproduces the fastsmooth results exactly (Fig. 14); even window sizes introduce minor deviations. Changing the window type from rectangular to triangular increases differences. Optimal window sizes are 5–9 points for moving-average and 10–15 points for moving-RMS.
4.3 Convolution with Gaussian Sample Function
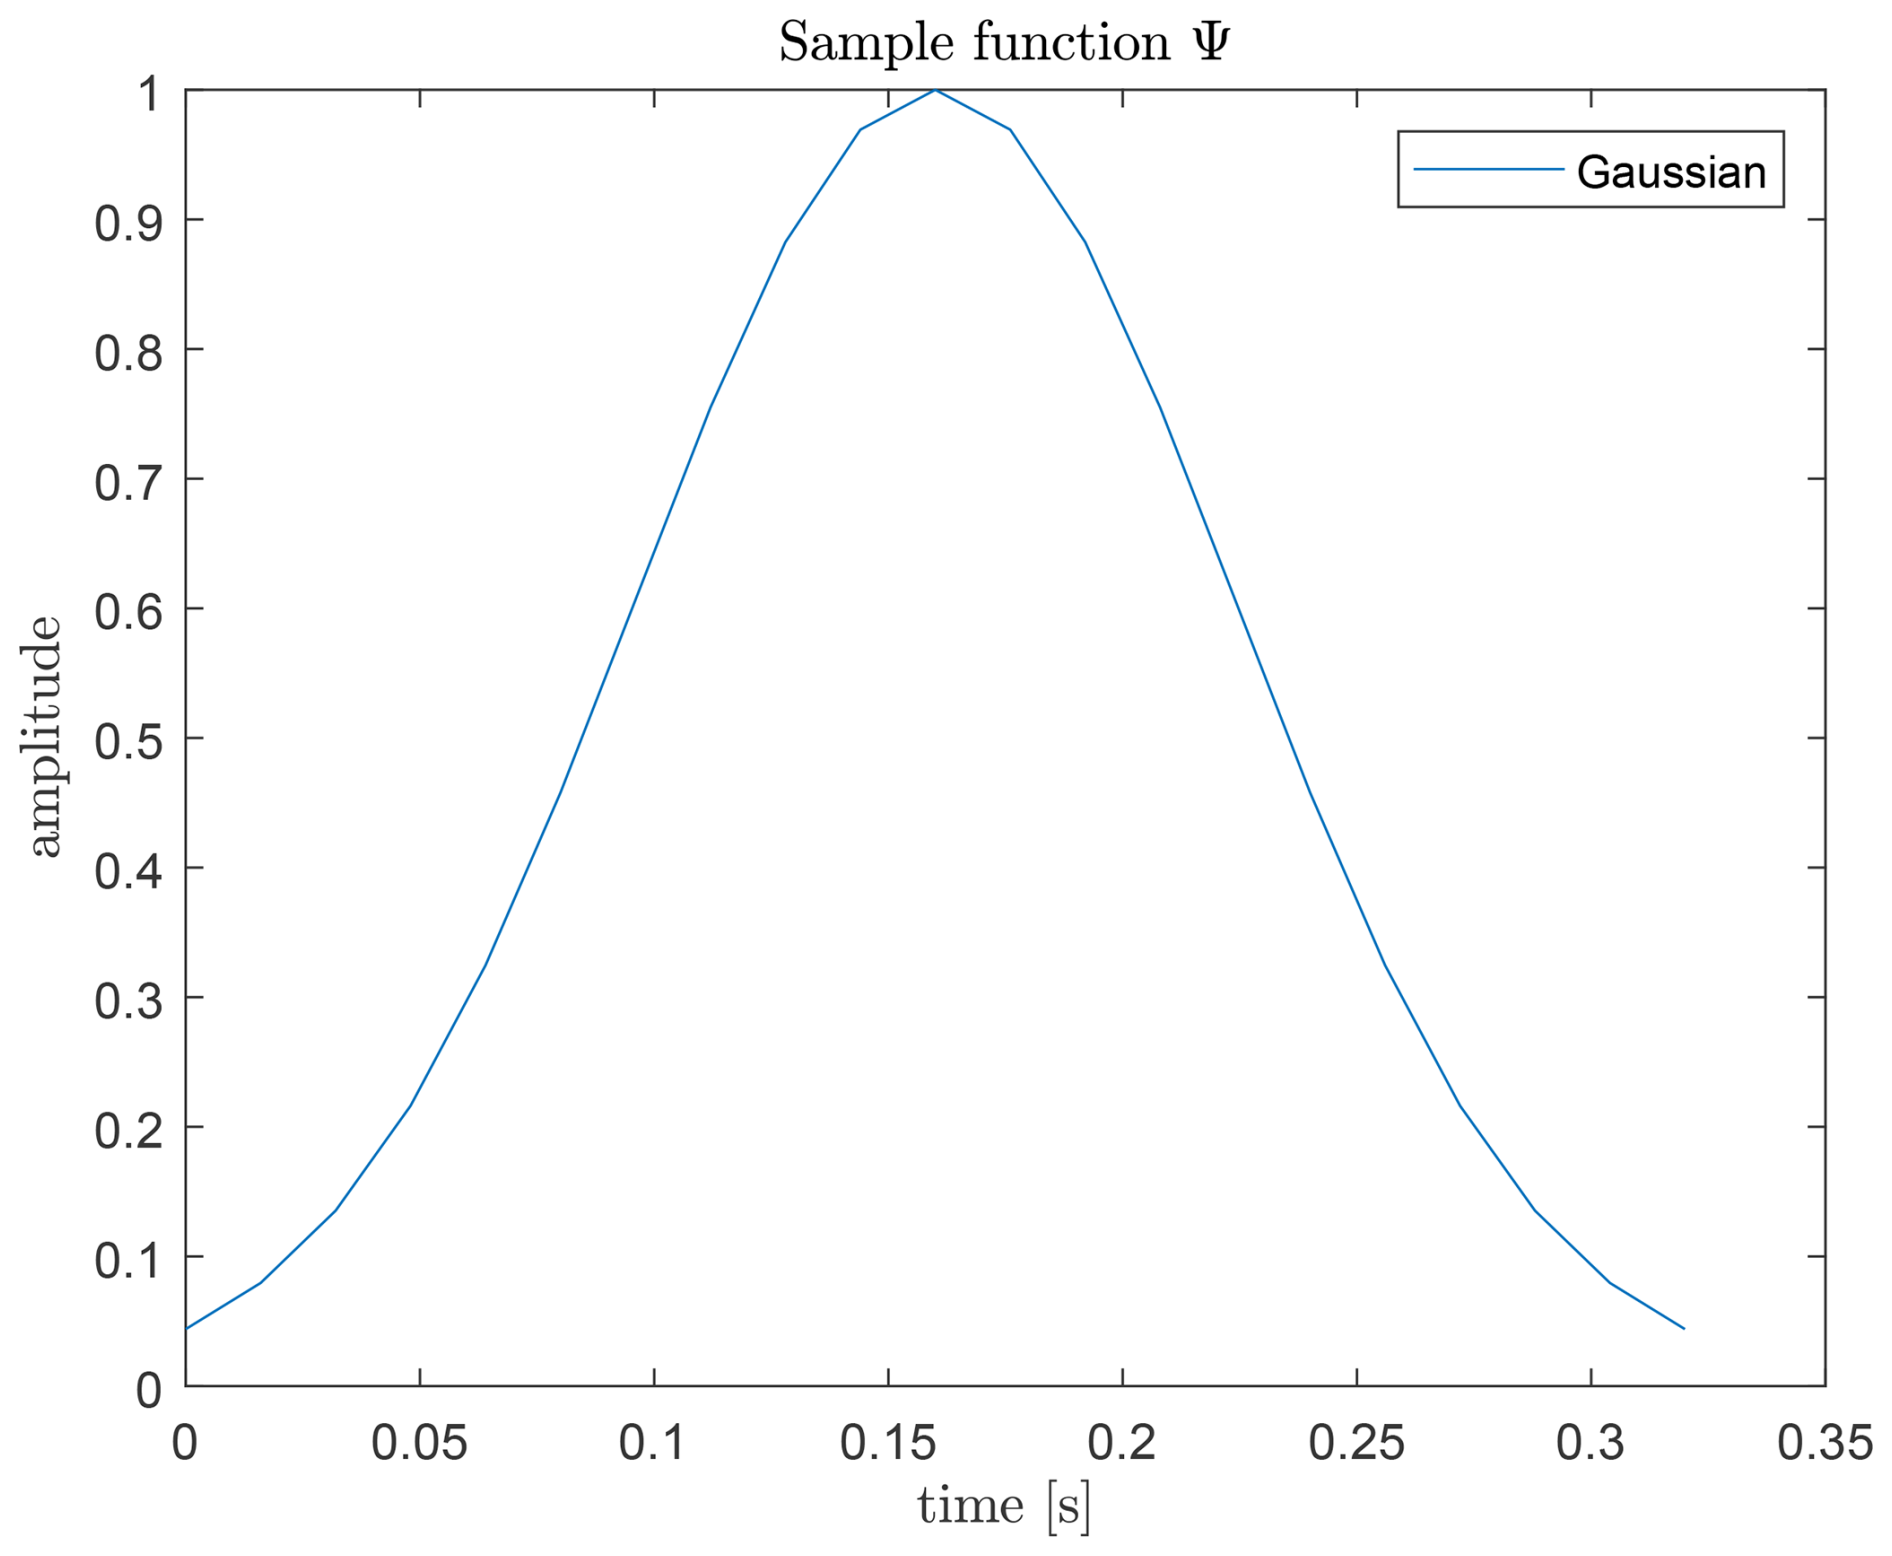
Each radar channel is convolved with a Gaussian sample function Ψ(t) shown in Fig. 17, assuming heartbeat peaks resemble Gaussian shapes. The systolic and diastolic phases occupy approximately and of a heartbeat, respectively (Huppelsberg and Walter, 2013; Grissmer, 2021). The number of points for the Gaussian sample is dynamically adapted according to the detected heart rate:
The convolution is expressed as:
4.4 Plausibility Check
A final plausibility check is applied using a sliding 12-second window, updated every second. Peaks are detected, and momentary heart frequencies are calculated.
Values outside the inter-quartile range (50 % around the median) are discarded, using MATLAB's built-in function (MathWorks Deutschland, 2026d) (Fig. 18).
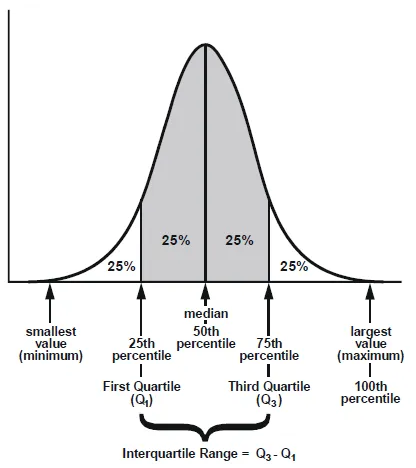
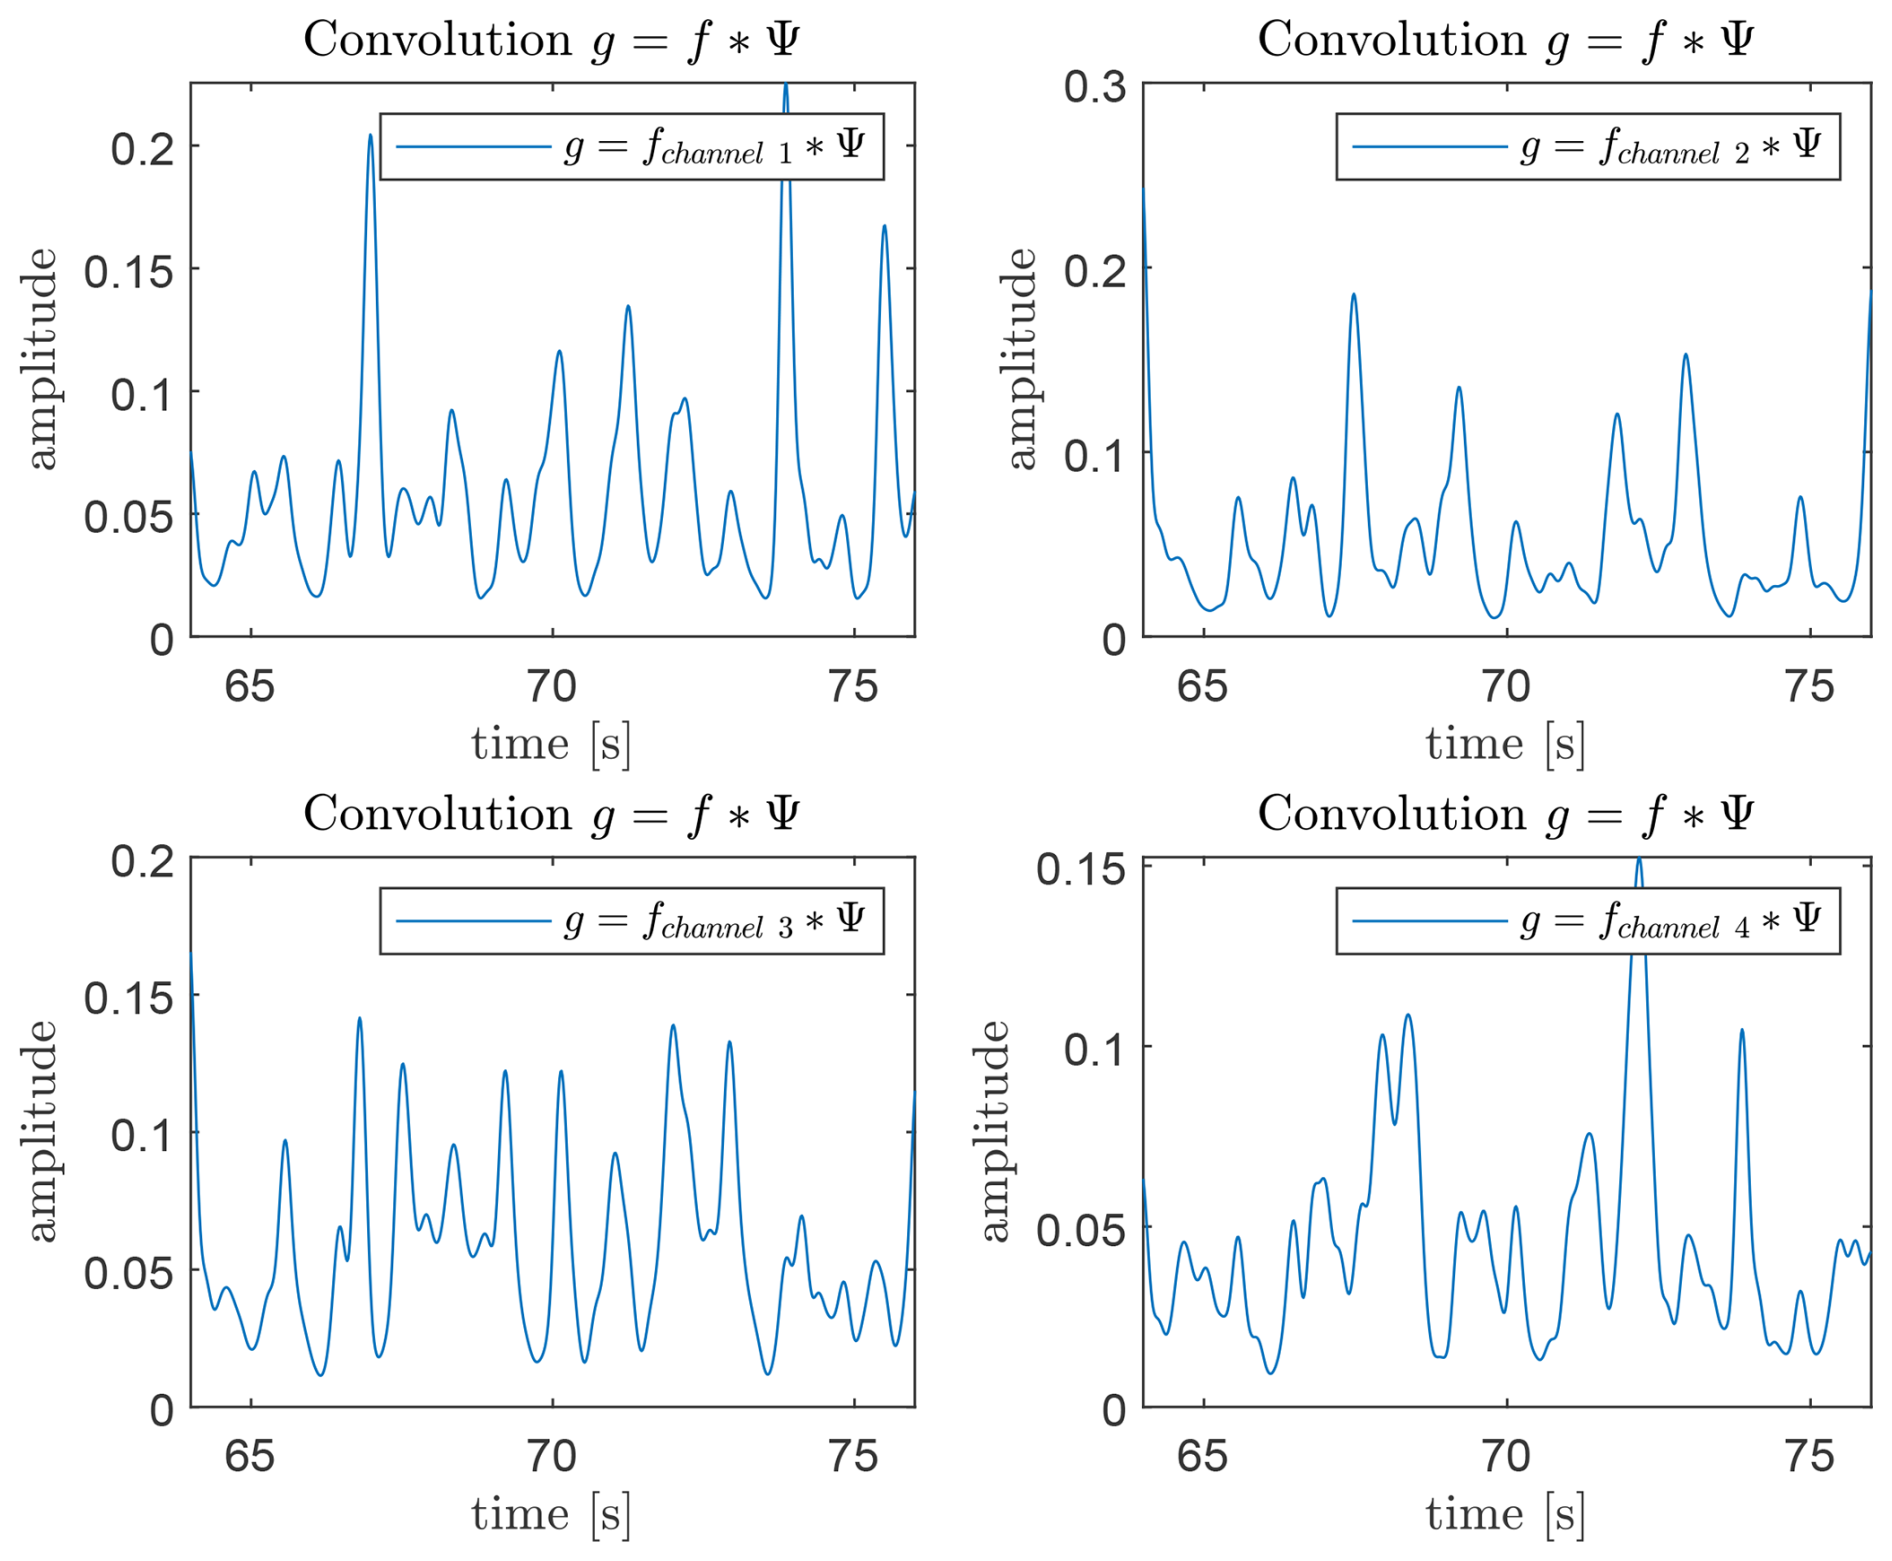
Figure 19 shows the convolution result for all radar channels with the Gaussian sample function.
This section presents the evaluation of the proposed signal processing pipeline for the final workflow given in Fig. 20 and its impact on the accuracy and robustness of heartbeat detection using the FMCW radar system. The results are structured according to the major processing stages of the algorithm. First, the effects of the convolution-based enhancement of the envelope signal are examined, highlighting improvements in noise suppression and heartbeat frequency detection. Subsequently, the influence of the plausibility check on the stability of the estimated heartbeat values is analyzed, demonstrating its contribution to reducing outliers and tightening the statistical distribution of the detected frequencies. Together, these results provide a comprehensive assessment of the system’s performance across all processing stages.
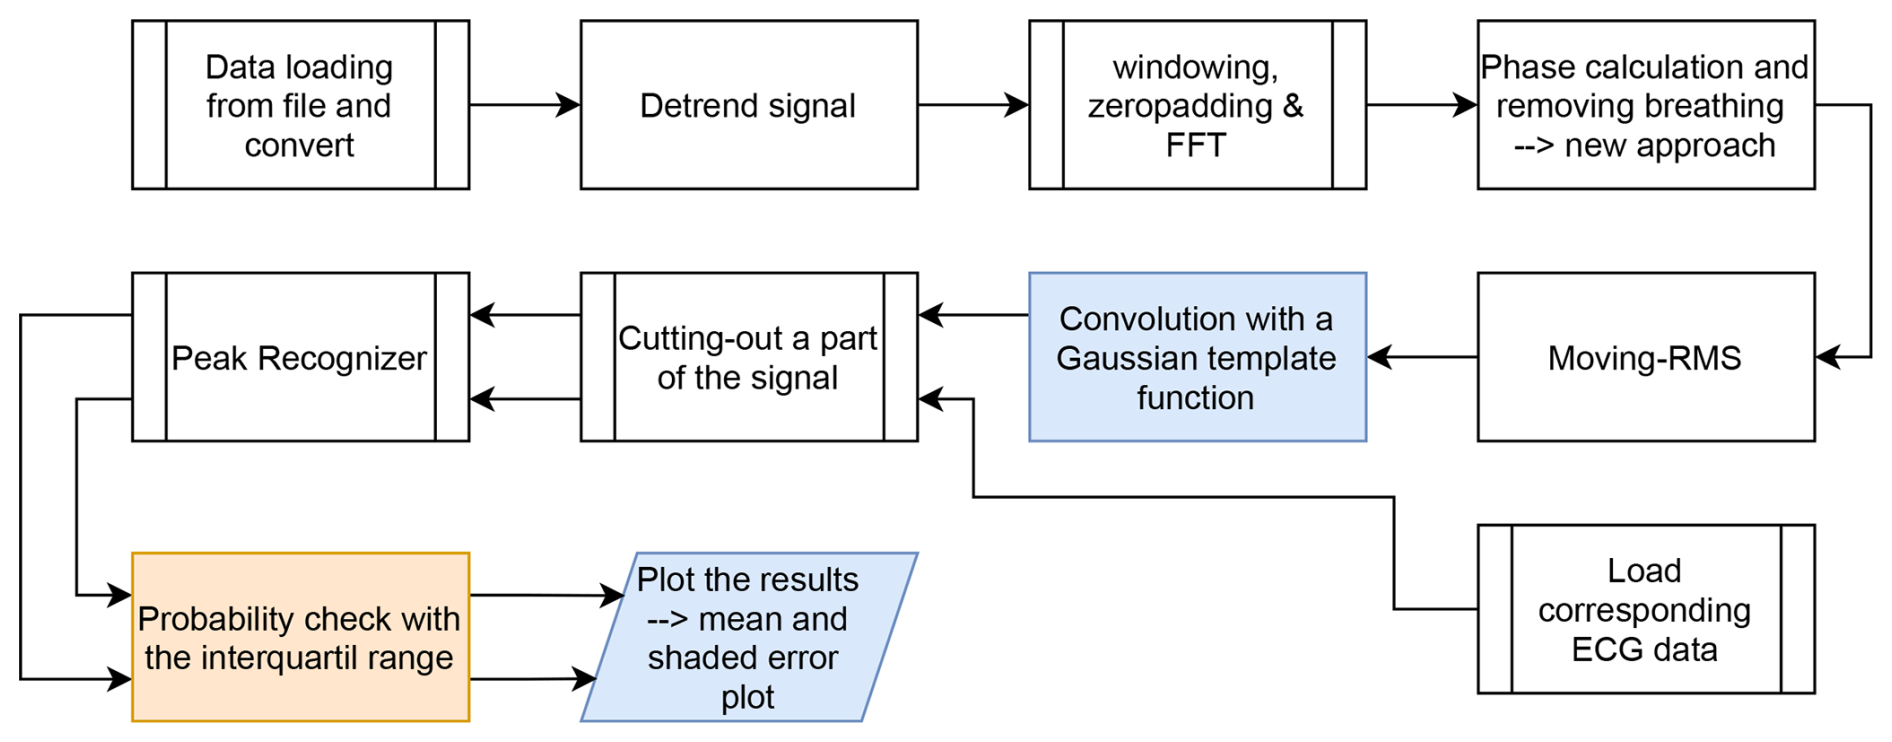
Figure 20Final workflow for heart frequency detection using envelope analysis, Gaussian convolution, and plausibility check.
5.1 Results of the Convolutional Signal Enhancement
In this first evaluation stage, the effect of convolving the Gaussian sample function with the envelope signal is analyzed. Figure 19 illustrates the resulting signal for all four radar channels. Compared to the raw envelope, the convolved signal exhibits a clearly reduced noise level and a suppression of the low-frequency breathing trend, which facilitates subsequent heartbeat peak detection.
To assess the impact on heartbeat frequency estimation, histograms of all detected heartbeat frequencies over a measurement period of three minutes are shown in Figs. 21 and 22.
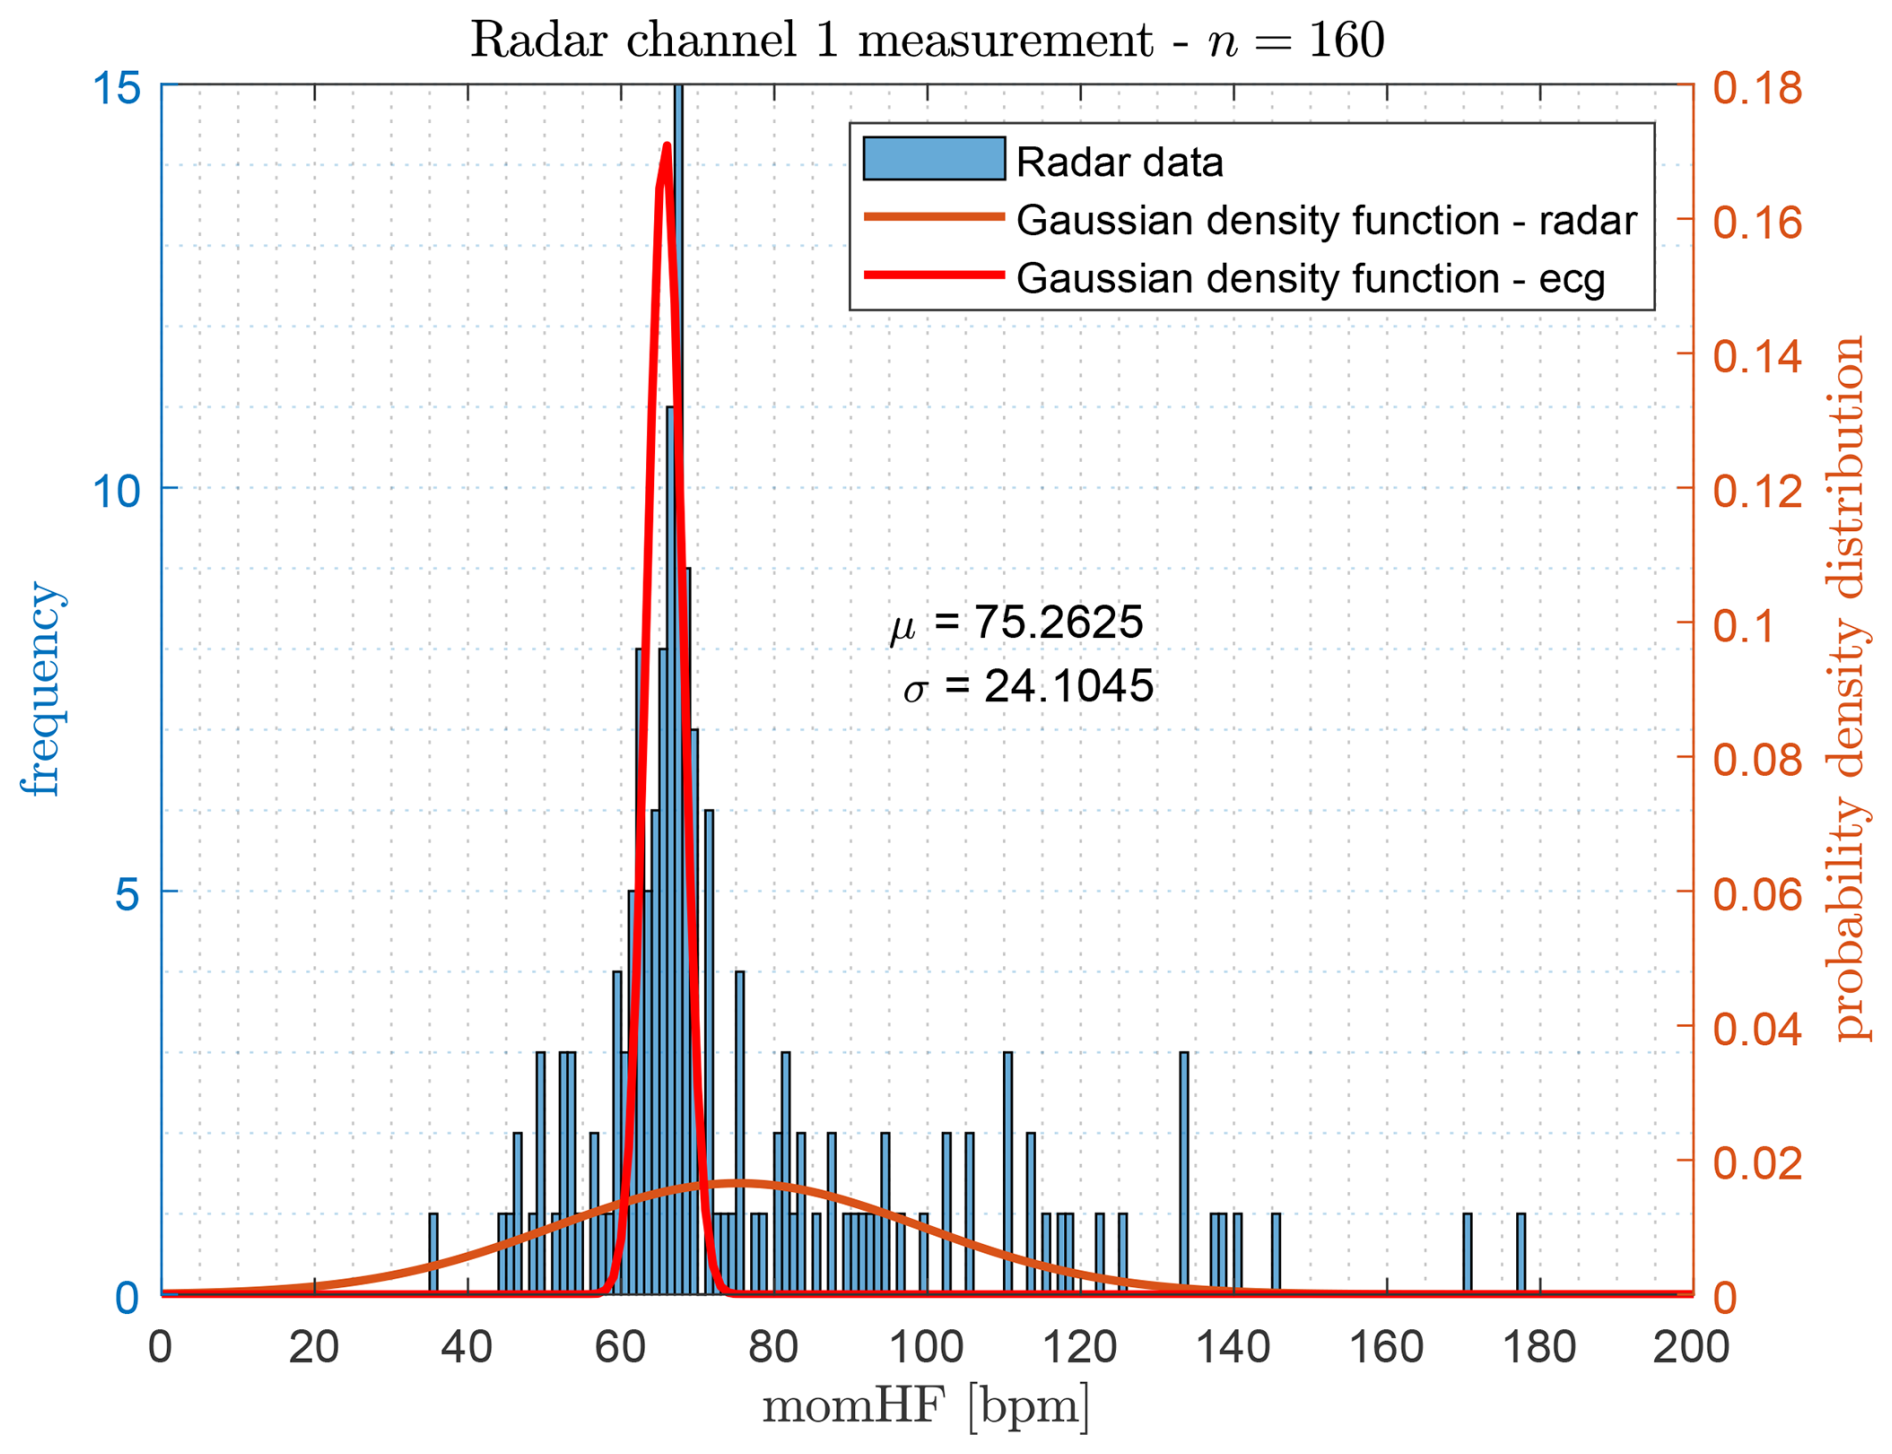
Figure 21Histogram of the detected heartbeat frequencies based on the pure envelope signal, shown together with the fitted normal distribution (green) and the ECG reference distribution (red).
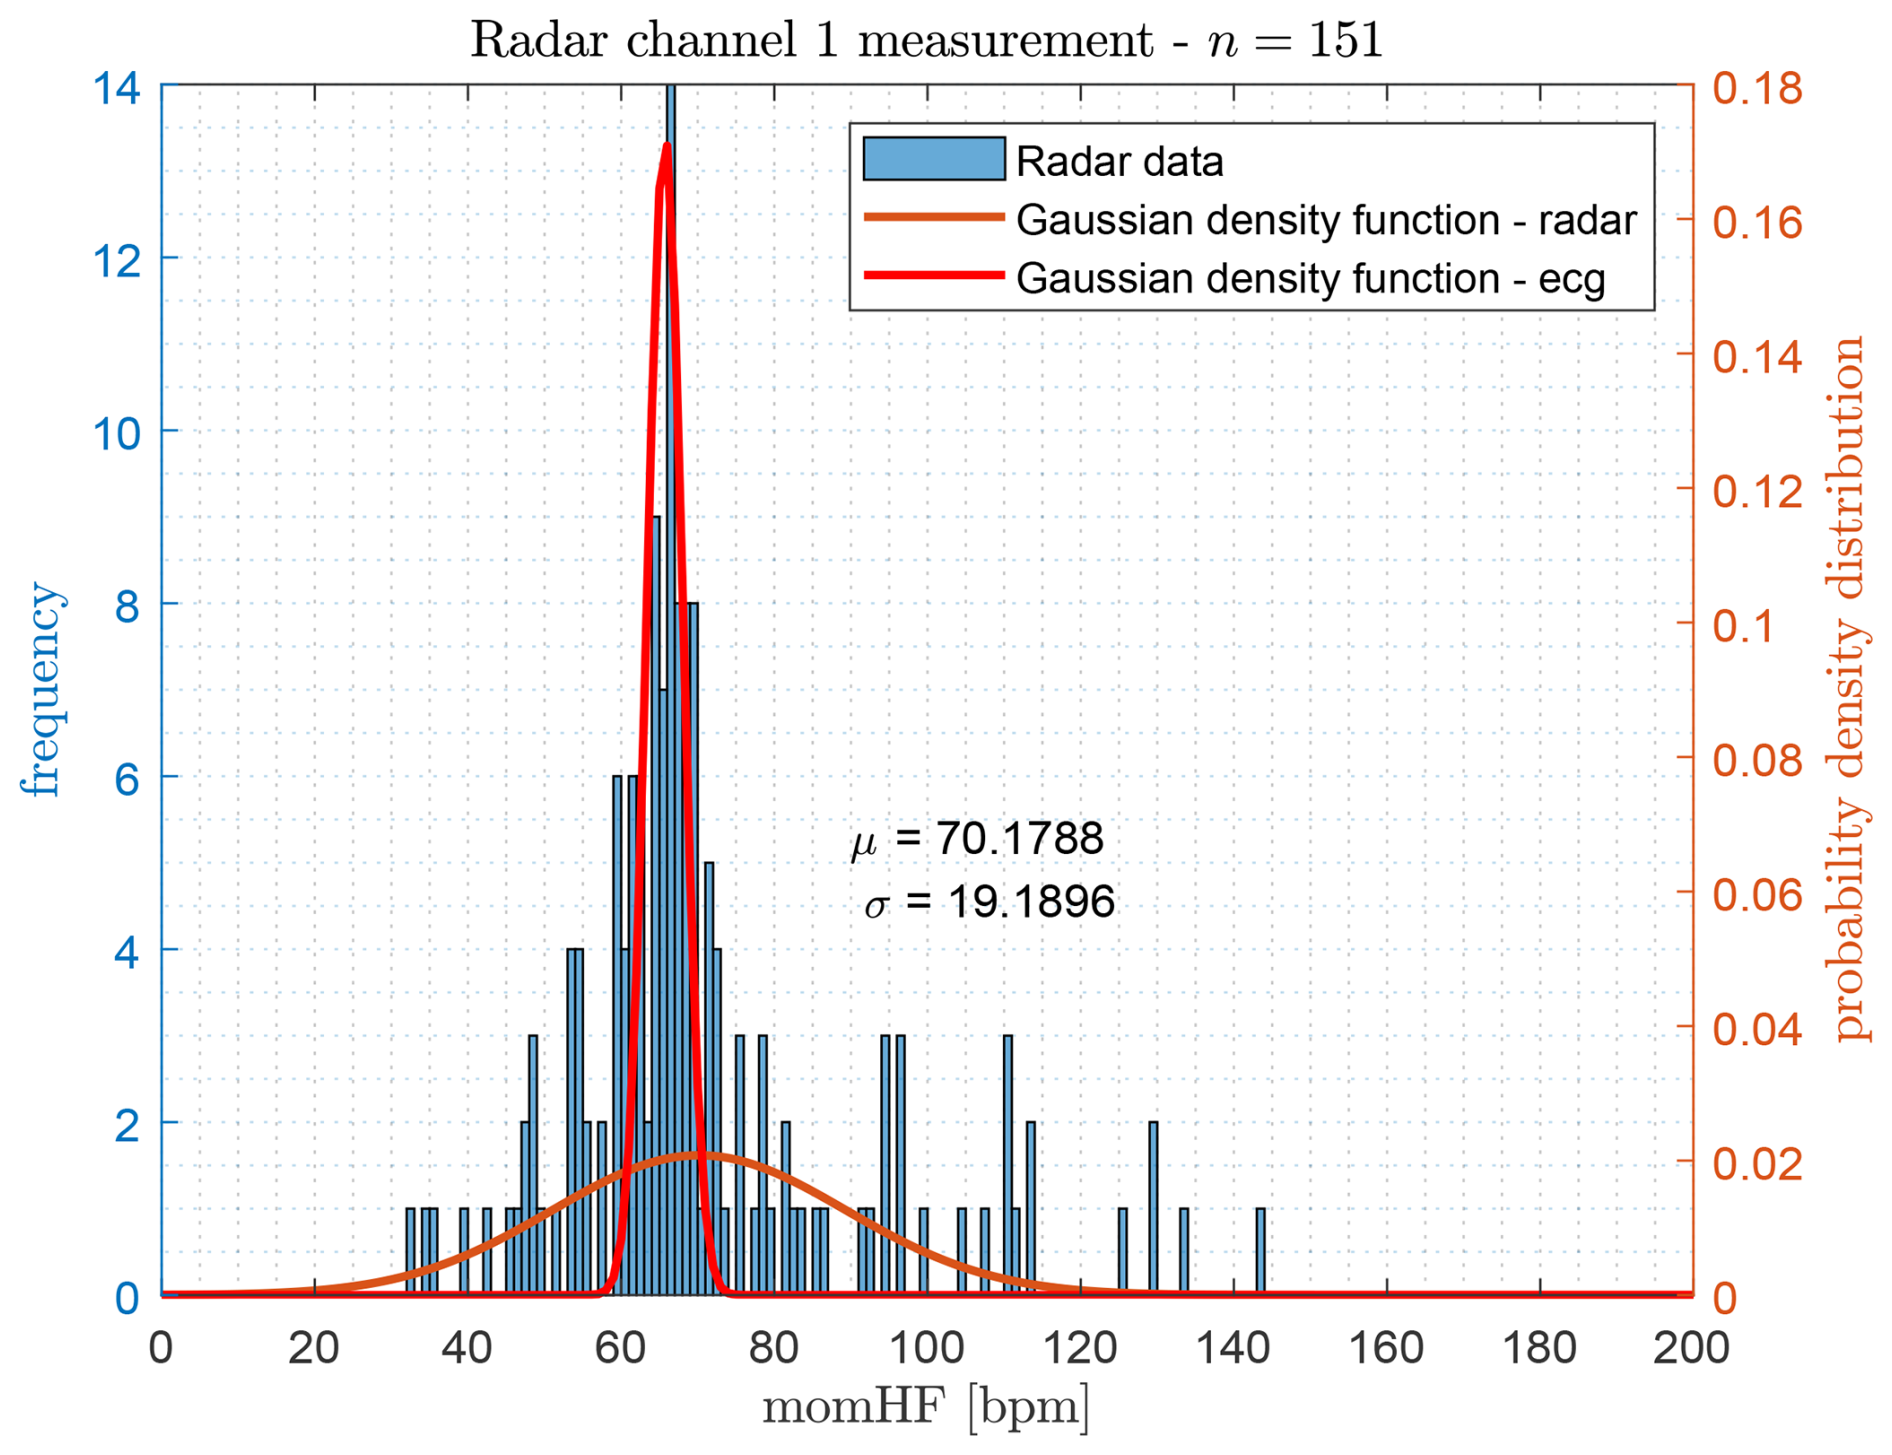
Figure 22Histogram of the detected heartbeat frequencies calculated by convolution with a Gaussian sample function, shown together with the fitted normal distribution (green curve) and the ECG reference distribution (red curve).
The histogram in Fig. 21 is based on peak detection performed directly on the original envelope signal, whereas Fig. 22 shows the distribution obtained after applying the convolutional stage. In total, n=152 heartbeat events were identified to compute the instantaneous heartbeat frequency via the inverse inter-peak interval.
A noticeable improvement is observed when comparing the statistical parameters of both approaches. The original envelope method yields a mean frequency of μ=75.26 bpm with a standard deviation of σ=24.10 bpm. After applying the convolutional enhancement, these values improve to μ=70.18 bpm and σ=19.19 bpm, indicating a reduction of extreme outliers and an overall more stable estimation. For reference, the gold-standard ECG measurement provides μ=65.70 bpm and σ=2.32 bpm, whose probability density function is included as a red curve (the corresponding ECG histogram is shown in Marnach et al., 2024a).
These results demonstrate that convolution alone already brings the radar-based estimation closer to the ECG reference, although the standard deviation remains relatively high.
5.2 Results Including the Plausibility Check Stage
In the second evaluation stage, the plausibility check is applied on top of the convolution-based heartbeat extraction. This step is designed to further suppress outliers by enforcing physiological consistency over time.
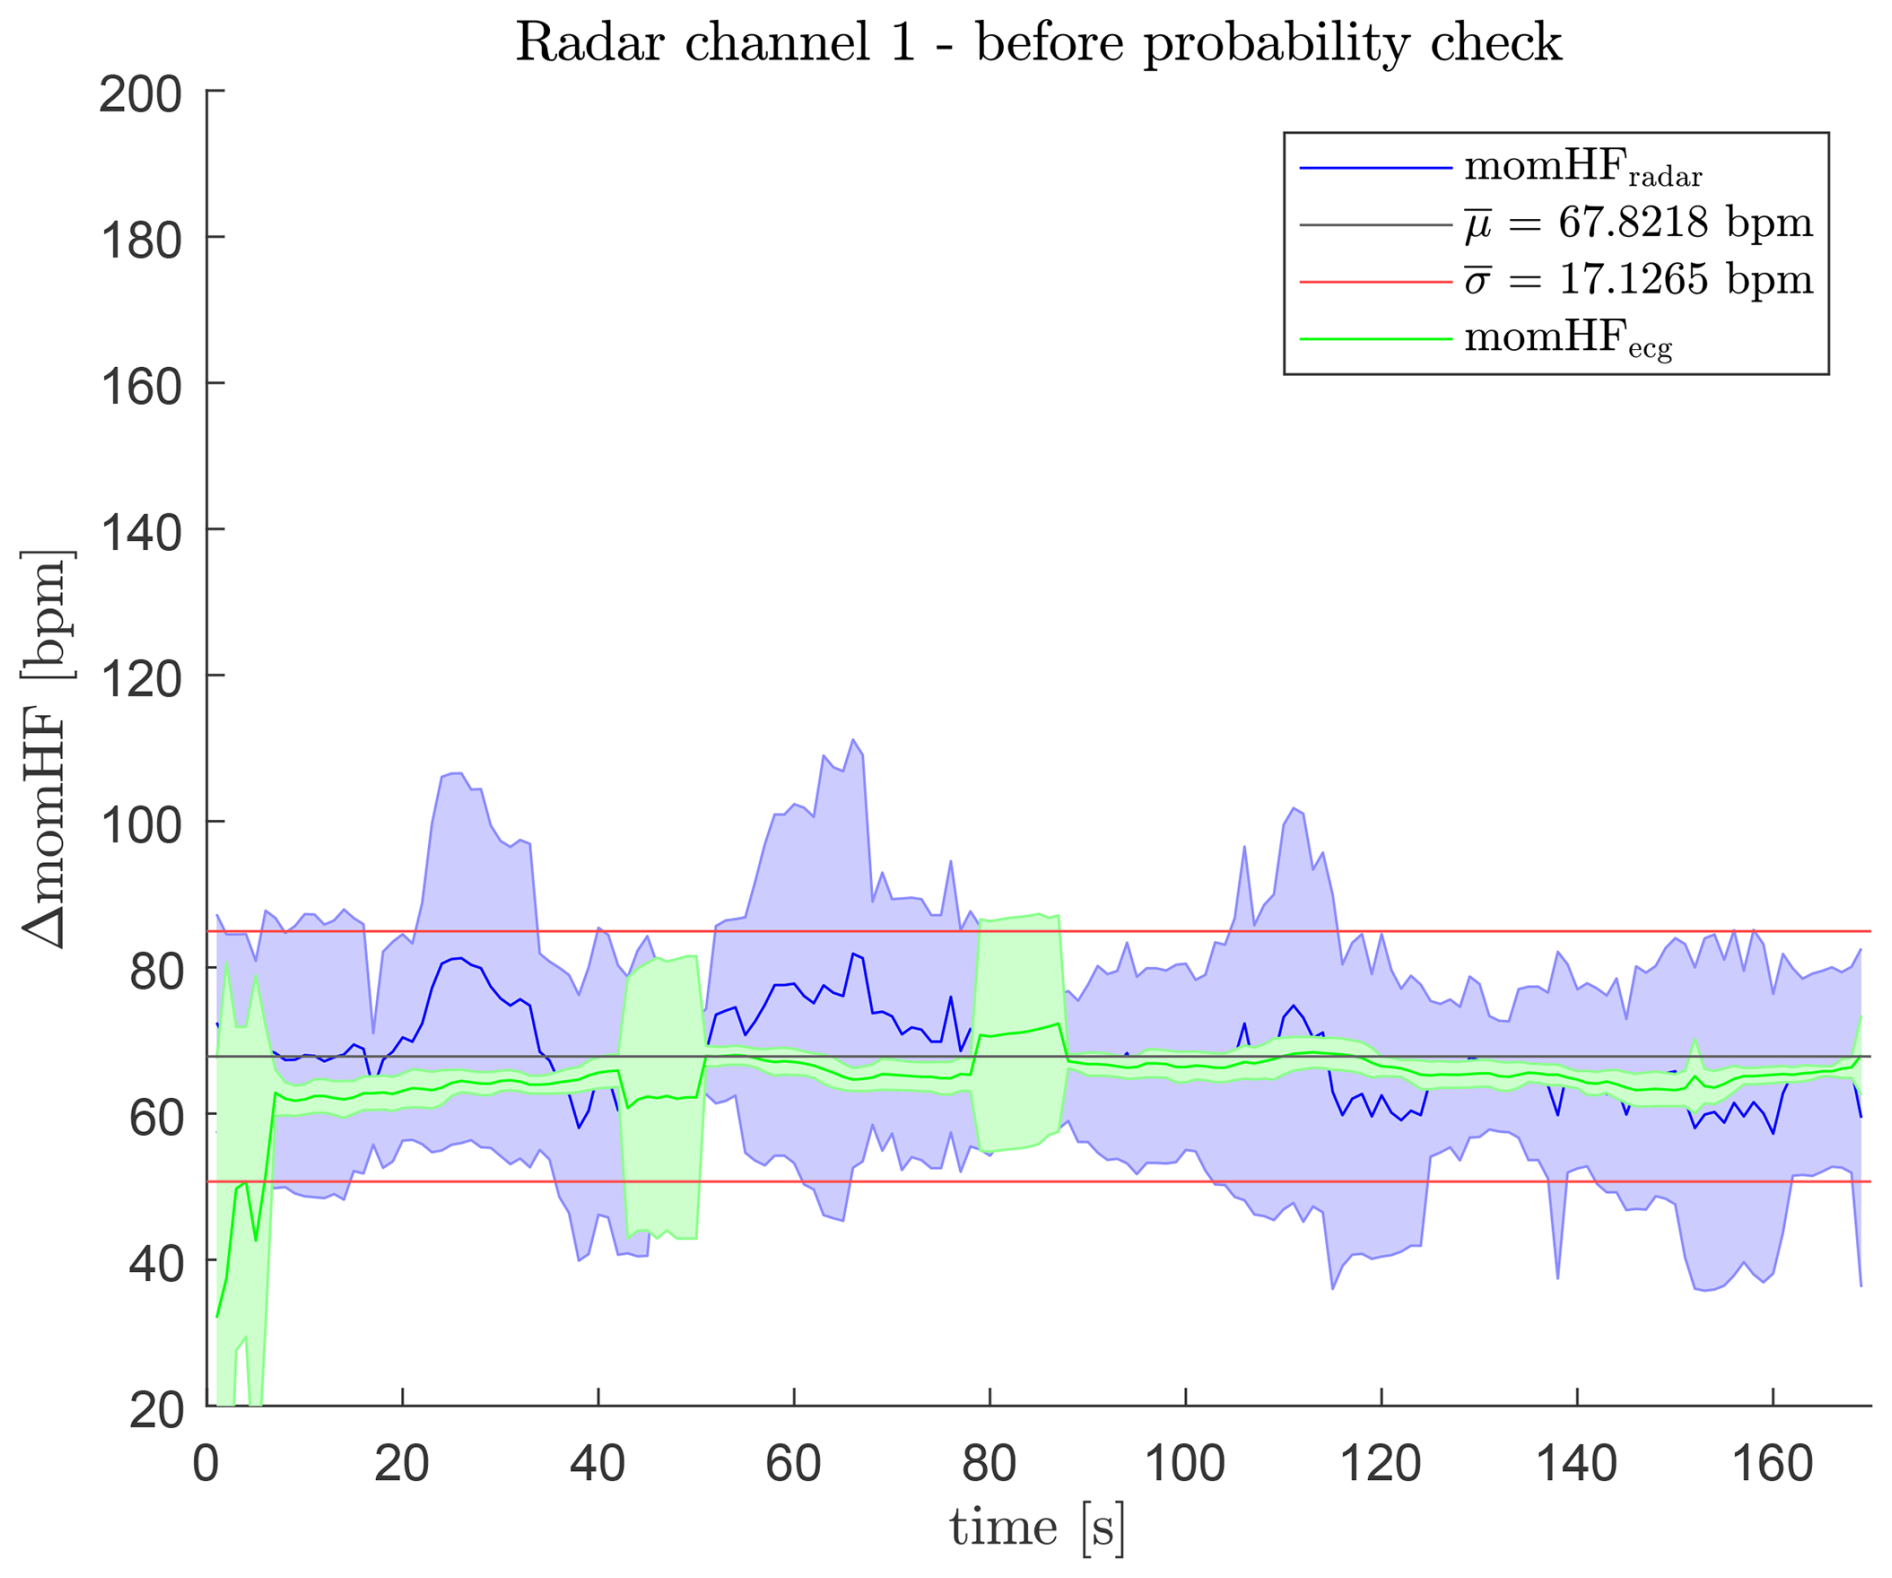
Figure 23 shows the μσ-evaluation (visualization based on (Campbell, 2021)) of the radar-derived heartbeat frequency before applying the plausibility check for a second, independent measurement dataset. Although this dataset differs from the one used in Sect. 5.1, the resulting statistical parameters are comparable:
The mean heartbeat frequency of 67.82 bpm is already close to the ECG reference. However, the large standard deviation of 17.13 bpm indicates significant temporal fluctuations and remaining spurious detections.
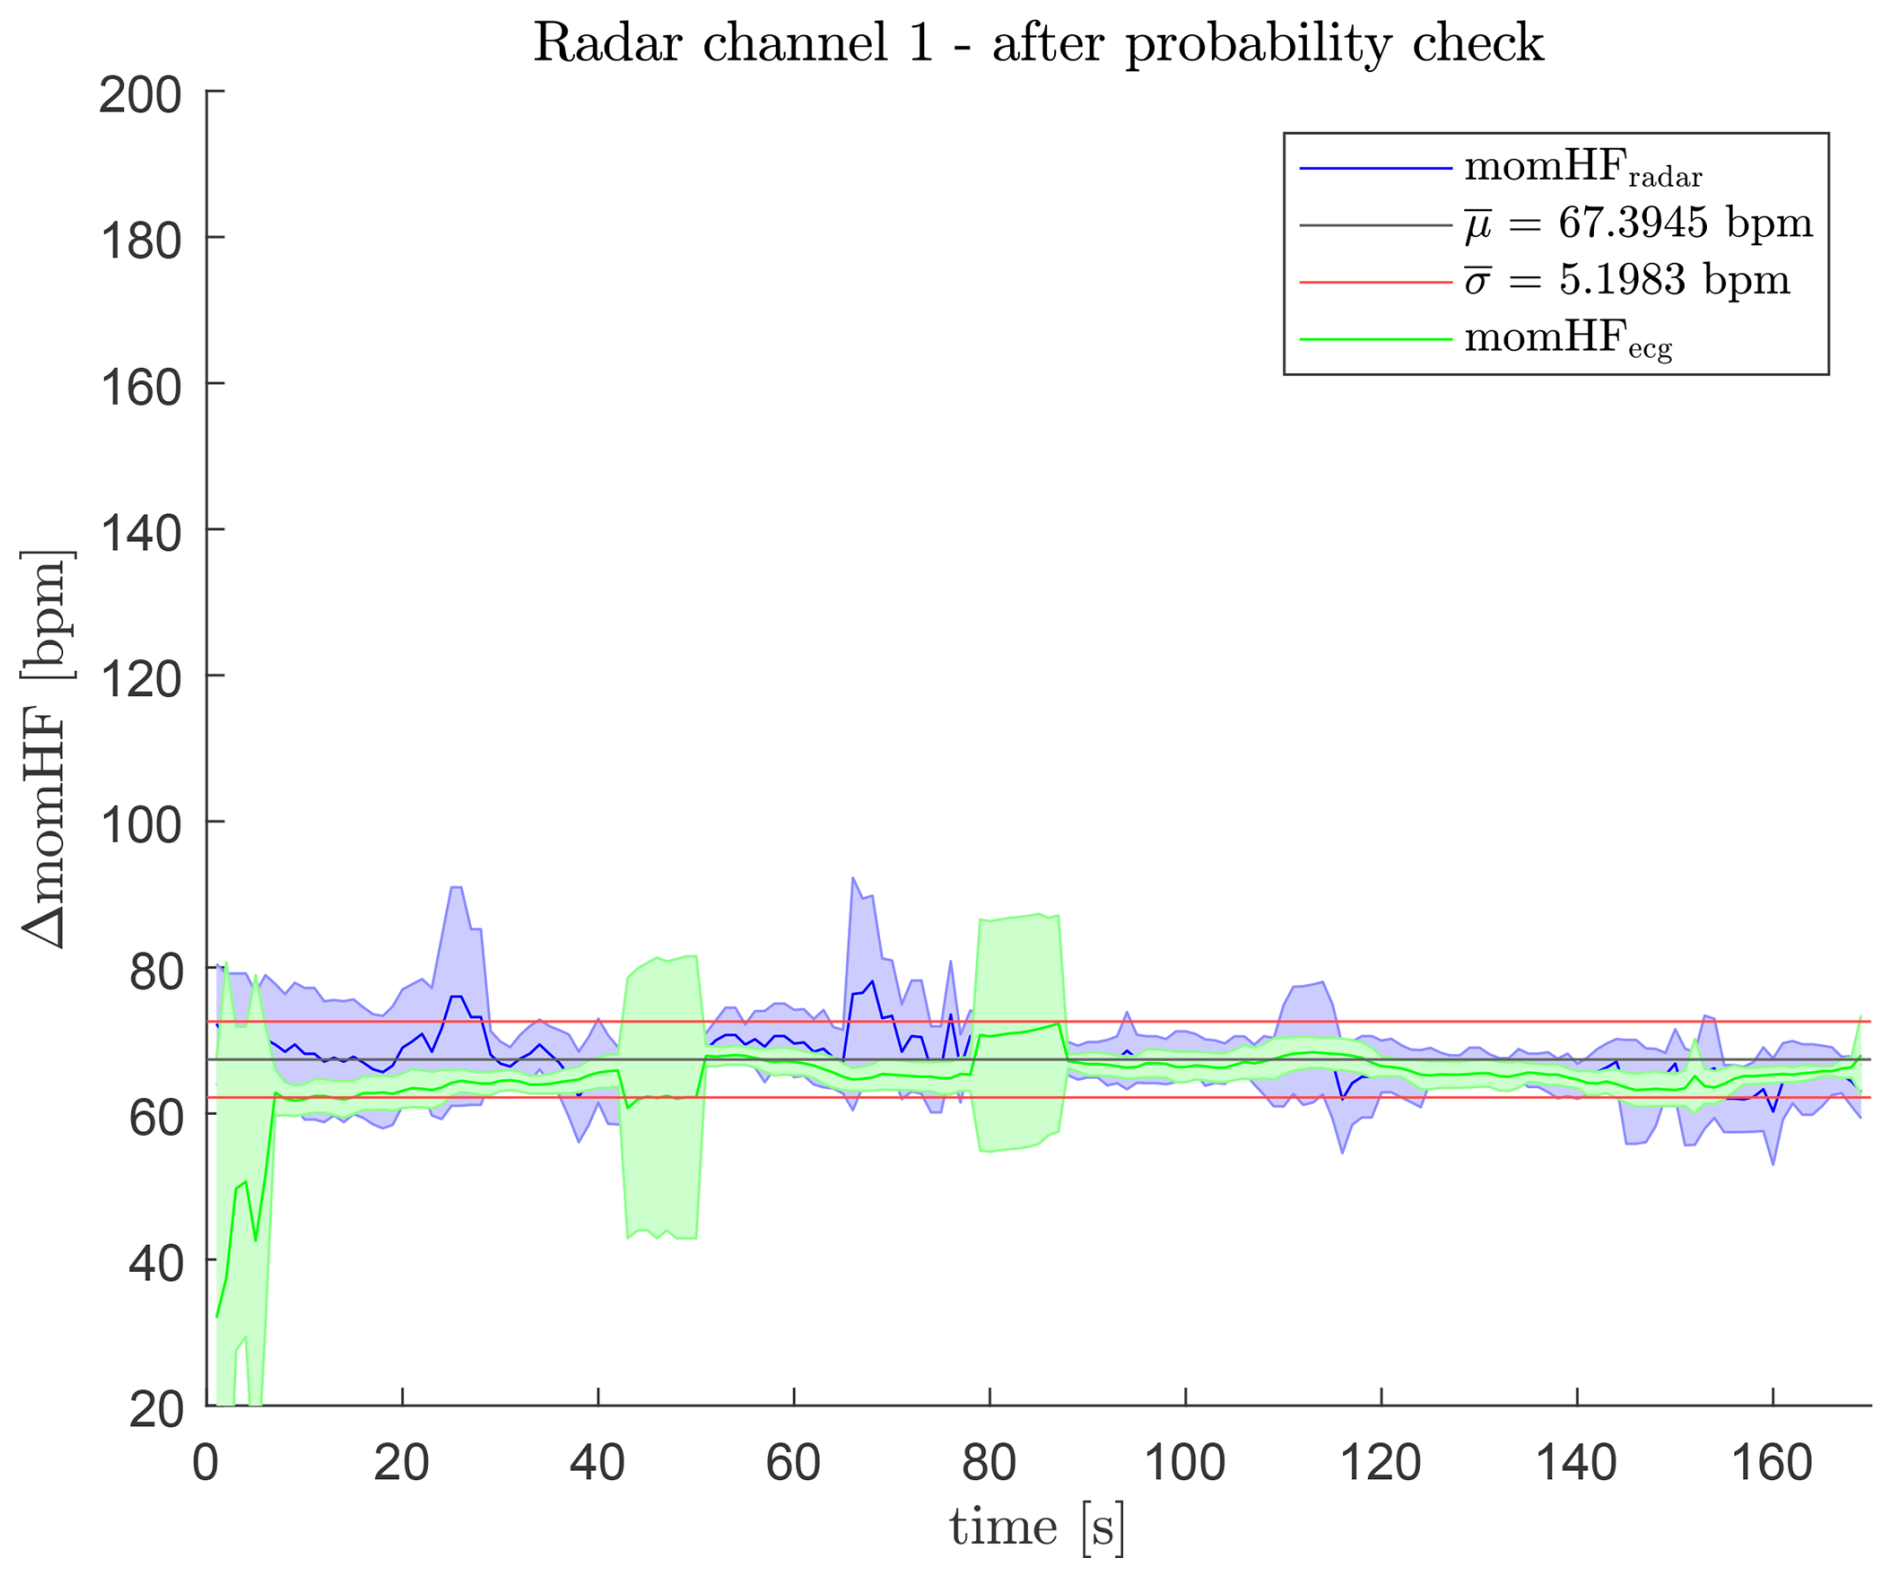
After applying the plausibility check, the distribution tightens considerably, as displayed in Fig. 24. The mean heartbeat frequency becomes 67.39 bpm, while the standard deviation drops sharply to 5.20 bpm. This reduction reflects the primary benefit of the plausibility stage: unreliable peak candidates are removed, and the resulting heartbeat trajectory becomes smoother and more physiologically consistent. Compared to Fig. 23, the improvement in stability is substantial and represents the major contribution of this processing step.
Together with the results of Sect. 5.1, these findings show that the convolutional enhancement primarily improves noise robustness and reduces extreme outliers, while the plausibility check provides the decisive reduction of variance, thereby enabling reliable radar-based heartbeat tracking.
In this work, the advancements in radar-based vital sign monitoring using a 24 GHz FMCW radar system have been presented, combining different methodologies for breathing and heartbeat detection. The proposed approaches demonstrate significant progress in non-contact heartbeat detection for arbitrary and previously unknown subjects, in contrast to methods that depend on subject-specific sample functions, and achieve reliable results through both foundational and advanced signal processing techniques.
Initially, the envelope analysis method proved to be a feasible approach for extracting heartbeat data, as validated against a synchronized ECG system. However, the need for real-time application drove the replacement of computationally intensive functions with real-time suitable alternatives. The Moving-Average function effectively substituted the Fastsmooth function, while the Moving-RMS replaced the Hilbert transform, achieving comparable results and enabling real-time processing – a crucial requirement for practical healthcare applications.
Additionally, the envelope analysis was extended by integrating a Gaussian sample function convolution and a plausibility check to enhance reliability and reduce outlier sensitivity. These enhancements improve the robustness of the system, ensuring consistent performance across various conditions. Despite these advancements, the impact of body movements on the measurement accuracy remains a challenge that warrants further exploration.
Overall, the presented work establishes a robust framework for radar-based vital sign monitoring, emphasizing the transition to real-time capability and the importance of advanced signal processing techniques. Future efforts will focus on improving resilience to motion artifacts and expanding the application of the system in dynamic real-world environments.
The software code used in this study was developed as part of a collaborative project with an industry partner and is based on measurements conducted by the company. The authors are permitted to publish the methodology but are not authorized to disclose the software code or the measurement data. Therefore, neither the code nor the data can be made publicly available.
A.M. developed and tested the software code, A.M. wrote the initial paper, V.L. implemented the data acquisition and reviewed the final paper, A.D. developed the mathematical foundations of the algorithm and wrote the final paper, A.D. also developed the 24 GHz radar module for the measurements.
The contact author has declared that none of the authors has any competing interests.
Publisher's note: Copernicus Publications remains neutral with regard to jurisdictional claims made in the text, published maps, institutional affiliations, or any other geographical representation in this paper. The authors bear the ultimate responsibility for providing appropriate place names. Views expressed in the text are those of the authors and do not necessarily reflect the views of the publisher.
This article is part of the special issue “Kleinheubacher Berichte 2024”. It is a result of the Kleinheubacher Tagung 2024, Miltenberg, Germany, 24–26 September 2024.
The authors would like to thank Eric Rietzke and Joachim Bremm from SilverCreations AG for the strong collaboration.
This paper was edited by Lars Ole Fichte and reviewed by Thomas Fickenscher and one anonymous referee.
Ahmed, A. K., Harness, J. B., and Mearns, A. J.: Respiratory Control of Heart Rate, Europ. J. Appl. Physiol., 50, 95–104, https://doi.org/10.1007/BF00952248, 1982. a
Avram, R., Tison, G. H., Aschbacher, K., Kuhar, P., Vittinghoff, E., Butzner, M., Runge, R., Wu, N., Pletcher, M. J., Marcus, G. M., and Olgin, J.: Real-World Heart Rate Norms in the Health eHeart Study, npj Digital Medicine, 2, 1–10, https://doi.org/10.1038/s41746-019-0134-9, 2019. a
Betancur, J.: Multimodal Image Registration for the Characterization of the Hypertrophic Cardiomyopathy and the Cardiac Asynchronism, Doctoral Thesis, University of Rennes, https://theses.hal.science/tel-01127642 (last access: 12 February 2026), 2014. a, b
Campbell, R.: Raacampbell/shadedErrorBar, MATLAB Source Code from GitHub, https://github.com/raacampbell/shadedErrorBar (last access: 12 February 2026), 2021. a
Diewald, A. R. and Müller, S.: “Design of a six-patch series-fed traveling-wave antenna”, 2019 IEEE-APS Topical Conference on Antennas and Propagation in Wireless Communications (APWC), Granada, Spain, 2019, pp. 395–399, https://doi.org/10.1109/APWC.2019.8870368, 2019. a
Eller-Berndl, D.: Herzratenvariabilität, Verlagshaus der Ärzte, Wien, ISBN 978-3-99052-093-2, 2015. a
Franke-Gricksch, N.: Atmung bewegt Herzschlag | Herzratenvariabiliät (HRV), Online Resource, https://hrv-herzratenvariabilität.de/2016/03/atmung-bewegt-herzschlag/ (last access: 11 February 2026), 2021. a, b
Grissmer, S.: Herzzyklus: Phasen der Herzaktion, Thieme via medici, https://viamedici.thieme.de/lernmodul/541075/subject/physiologie/herz/mechanik+und+regulation+des+herzens/herzzyklus+phasen+der+herzaktion (last access: 12 February 2026), 2021. a
Hoffman, T.: Beyond heart rate: heart rate variability. Firstbeat Technologies, https://www. firstbeat.com/en/blog/beyond-heartrate-heart-rate-variability (last access: 12 February 2026), 2021. a
Huppelsberg, J. and Walter, K.: Kurzlehrbuch Physiologie: + campus.thieme.de, Georg Thieme Verlag, 4., aktualisierte auflage edn., ISBN 978-3-13-136434-0, 978-3-13-150764-8, 978-3-13-168114-0, 2013. a
Kinderspital Luzern: Kispi-Wiki – Normwerte Vitalparameter Online Ressource, https://www.kispi-wiki.ch/application/files/3115/4392/8244/Normale_Vitalparameter_KispiLUA6.pdf (last access: 12 February 2026), 2021. a
Lemmer, E., Schmiech, D., Müller, S., Marnach, A., Thull, R., and Diewald, A. R.: Development of a 24 GHz Front-End and First Test Measurements for Breathing and Heartbeat Monitoring inside a Cot, in: 2019 23rd International Conference on Applied Electromagnetics and Communications (ICECOM), pp. 1–5, https://doi.org/10.1109/ICECOM48045.2019.9163655, 2019. a
Marnach, A., Dirksmeyer, L. J., Lücken, V., and and Diewald, A. R.: “A Comparison of ECG and FMCW Radar Heart Beat Measurements Based on an Envelope Analysis”, 2024 International Conference on Electromagnetics in Advanced Applications (ICEAA), Lisbon, Portugal, pp. 71–76, https://doi.org/10.1109/ICEAA61917.2024.10701736, 2024a. a, b
Marnach, A., Lücken, V., and Diewald, A. R.: Adaptations of Computational-Intensive Methods for Real Time Vital Sign Detection using FMCW Radar, in: 2024 IEEE International Symposium on Antennas and Propagation and INC/USNC‐URSI Radio Science Meeting (AP-S/INC-USNC-URSI), Firenze, Italy, pp. 2735–2736, https://doi.org/10.1109/AP-S/INC-USNC-URSI52054.2024.10687119, 2024b. a
MathWorks Deutschland: Envelope Extraction, https://de.mathworks.com/help/signal/ug/envelope-extraction-using-the-analytic-signal.html (last access: 11 February 2026), 2026a. a
MathWorks Deutschland: MATLAB Help – Envelope, https://de.mathworks.com/help/signal/ref/envelope.html (last access: 11 February 2026), 2026b. a
MathWorks Deutschland: MATLAB Help – Findpeaks, https://de.mathworks.com/help/signal/ref/findpeaks.html (last access: 11 February 2026), 2026c. a
MathWorks Deutschland: MATLAB Help – Iqr, https://www.mathworks.com/help/stats/prob.normaldistribution.iqr.html (last access: 11 February 2026), 2026d. a
Nandi, K.: Explore Your Data: Range, Interquartile Range and Box Plot, http://makemeanalyst.com/explore-your-data-range-interquartile-range-and-box-plot/ (last access: 12 February 2026), 2021. a
Neff, R. A., Wang, J., Baxi, S., Evans, C., and Mendelowitz, D.: Respiratory Sinus Arrhythmia: Endogenous Activation of Nicotinic Receptors Mediates Respiratory Modulation of Brainstem Cardioinhibitory Parasympathetic Neurons, Journal: Circulation Research, 93, 565–572, https://doi.org/10.1161/01.RES.0000090361.45027.5B, 2003. a
O’Haver, T.: A Pragmatic Introduction to Signal Processing, University of Maryland at College Park, https://terpconnect.umd.edu/~toh/spectrum/index.html (last acces: 12 February 2026), 1997. a, b
Ruhepuls: Normalwerte nach Alter & Geschlecht, Praktisch Arzt – pA Medien Gmbh, Online Resource, https://www.praktischarzt.de/untersuchungen/puls-messen/ruhepuls/ (last access: 12 February 2026), 2021. a
Schäfer, S., Diewald., A. R., Schmiech, D., and Müller, S.: One-dimensional Patch Array for Microwave-based Vital Sign Monitoring of Elderly People, in: 2018 19th International Radar Symposium (IRS), pp. 1–10, https://doi.org/10.23919/IRS.2018.8448260, 2018. a
Schmiech, D., Müller, S., and Diewald, A. R.: 4-Channel I/Q-Radar System For Vital Sign Monitoring In A Baby Incubator, in: 2018 19th International Radar Symposium (IRS), pp. 1–9, https://doi.org/10.23919/IRS.2018.8448163, 2018. a
Steins, M., Leuck, S., and Diewald, A. R.: Universal Programmable Low Cost Signal Source for 24 GHz ISM Band, The Loughborough Antennas and Propagation Conference (LAPC), Loughborough, https://doi.org/10.1109/LAPC.2016.7807591, 2016. a
Tchameni, M. R., Lücken, V., Schroeder, U., and Diewald, A. R.: Detection of Respiratory Arrhythmia in Radar Based Heartbeat Estimation, in: 2024 IEEE INC-USNC-URSI Radio Science Meeting (Joint with AP-S Symposium), pp. 28–29, https://doi.org/10.23919/INC-USNC-URSI61303.2024.10632217, 2024a. a
Tchameni, M. R., Lücken, V., Schroeder, U., and Diewald, A. R.: Heartbeat Estimation and Respiratory Arrhythmia Detection Using 24 GHz Radar Signals, in: 2024 IEEE 22nd Mediterranean Electrotechnical Conference (MELECON), pp. 362–366, https://doi.org/10.1109/MELECON56669.2024.10608756, 2024b. a
Tchameni, M. R., Schiffer, C., Lücken, V., Diewald, A. R., and Schroeder, U.: Radar Based Heartbeat Estimation in Time Domain, in: 2024 15th German Microwave Conference (GeMiC), pp. 129–132, https://doi.org/10.23919/GeMiC59120.2024.10485355, 2024c. a
Van Diest, I., Verstappen, K., Aubert, A. E., Widjaja, D., Vansteenwegen, D., and Vlemincx, E.: Inhalation/Exhalation Ratio Modulates the Effect of Slow Breathing on Heart Rate Variability and Relaxation, 39, 171–180, https://doi.org/10.1007/s10484-014-9253-x, 2014. a
Will, C., Shi, K., Schellenberger, S., Steigleder, T., Michler, F., Weigel, R., Ostgathe, C., and Koelpin, A.: Local Pulse Wave Detection Using Continuous Wave Radar Systems, IEEE Journal of Electromagnetics, RF and Microwaves in Medicine and Biology, 1, 81–89, https://doi.org/10.1109/JERM.2017.2766567, 2017. a
Breathing cycles per minute.