 | 19 Sep 2019
Disturbing impact of multiple wind turbines on the indicated DVOR bearing
Sergei Sandmann
Heyno Garbe
Radio navigation aids, like the Doppler Very High Frequency Omnidirectional Radio Range (DVOR), provide their navigation service by specific radiation of electromagnetic waves depending on the direction in space and according to their specific antenna characteristics. Therefore, these navigation aids are reliant on undisturbed wave propagation in their operation range. Certainly, a propagation disturbance can be implicated by the presence of scattering objects like large buildings or wind turbines (WT) in the surrounding area of the DVOR, which potentially leads to deviations of the transmitted navigation content.
In order to comply with the specified flight safety limits, especially respecting WTs, there is a necessity to predict the prospective bearing error due to installations not only of individual WTs but also of additional ones in a present wind farm or repowering projects. Accordingly, this paper is aimed at ascertaining the bearing deviations' dependency on the quantity of WTs in a realistic wind farm close to a DVOR, calculated in space areas of practical relevance.
- Article
(3583 KB) - Full-text XML
- BibTeX
- EndNote


The potential of scattering objects disturbing the DVOR is well known and was addressed in several investigations (Hirasawa, 1984; Morlaas et et al., 2008; Fernandes et al., 2014). Subject of these investigations is mostly the question for the resulting bearing error of an object. A novel aspect is the blurring effect of bearing error contributions in presence of multiple objects. Herewith, besides the question for the magnitude of bearing error caused by scattering objects another object of investigation arises: The change of the bearing error implicated by installation of additional scattering objects to a present one. This question is especially important for repowering or expansion projects of wind farms (WF).
Therefore, in this paper the bearing error's dependency on the quantity of WTs is investigated in a realistic scenario of an existing WF. Especially the practical relevance of the investigation results is considered by, first, simulating the bearing errors in the lower level of DVOR operation area, for previous investigations as well as practical expertise are indicating the most bearing deviations in this altitudes. Second, to avoid flight security doubts, in practice, restriction zones are established around DVOR navigation aids in which building permissions are refused (EUR DOC 015, 2019). In international comparison the radii of theses zones are different, which often leads to scientific and juristic disputes. Therefore, in order to contribute to a technical expertise, in this work a WF is regarded which is located straight in a restriction zone, while the bearing error is calculated both in the beginning as well as in the end of the DVOR's operation distance.
In this way, besides the practical relevance of the investigation results the scientific question for superposition of bearing errors is considered.
After a short introduction of the DVOR's functionality in Sect. 2 the simulation setup is described in detail in Sect. 3. Subsequently, in Sect. 4 the bearing error results are presented and discussed especially concerning the errors' dependence on the WTs' quantity. Finally, a conclusion is made in Sect. 5.
The navigation service provided by the DVOR consists of emitting electromagnetic waves in a specific manner, which allows aircraft to determine the bearing angle ϕ, designated in Fig. 1.

The bearing angle ϕ is transmitted as the phase difference of an amplitude modulated (AM) and a frequency modulated (FM) signal content. In detail, a sine wave with a carrier frequency between 108 and 118 MHz is amplitude modulated with 30 and 9960 Hz±ΔfFM, while ΔfFM=480 Hz is the frequency deviation of a 30 Hz-FM (DOC 8071, 2019).
The 30 Hz-AM signal part is radiated omnidirectional, whereas the FM-phase of the radiated 30 Hz-FM signal part is linear dependent on the azimuth. As a result the receiving aircraft can determine their bearing angle related to the specific DVOR by directly subtracting the phases of the 30 Hz-AM and 30 Hz-FM signal content.
The directional dependent signal part of the DVOR is realized using the Doppler effect by 50 individually fed Alford Loop antennas arranged a circle, while the omnidirectional signal part is radiated by a single Alford Loop Antenna in the center of the circle (Anderson and Flint, 1959).
As indicated, an existing wind farm, shown in Fig. 2, is used as archetype for modelling the scenario.
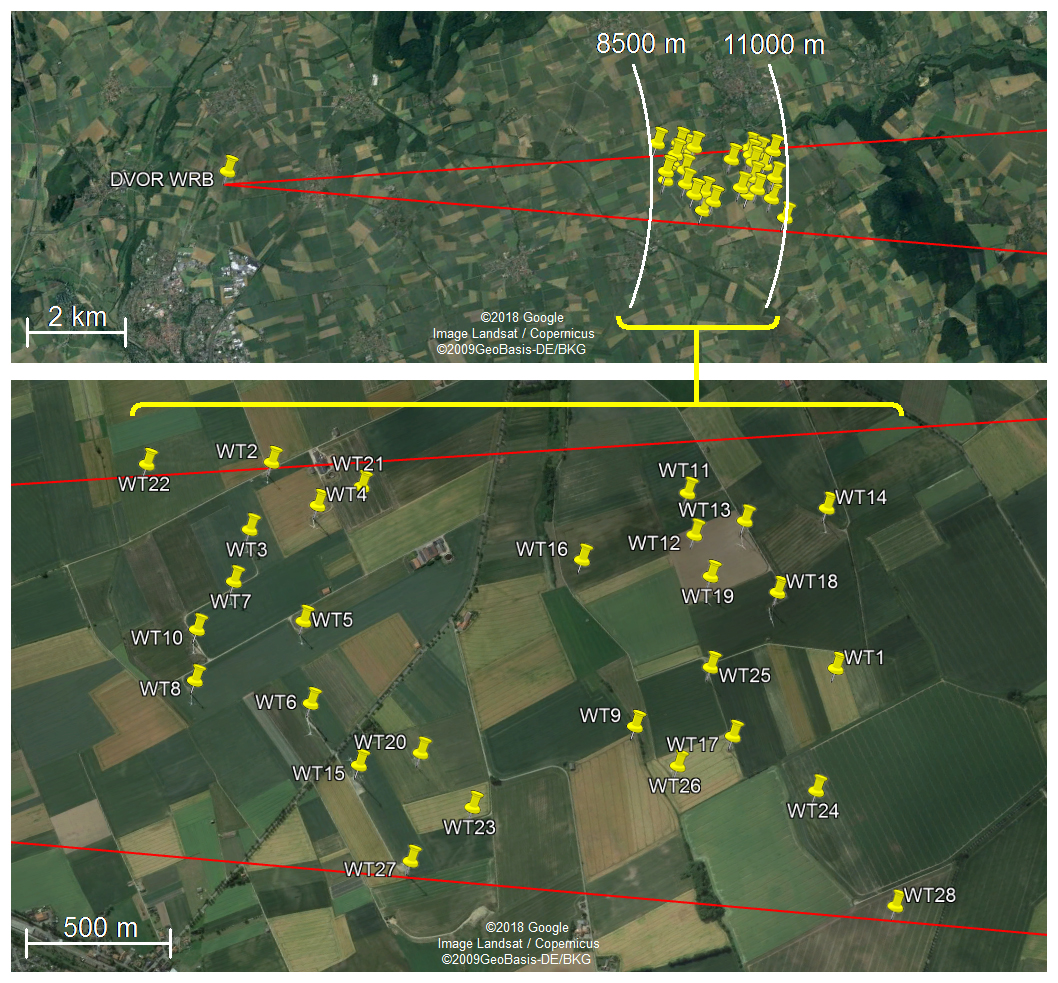
Figure 2Bird's eye view of the modelled wind farm and the DVOR radials bordering it.
The wind farm, consisting of 28 WTs, is located in a distance between 8.5 and 11 km from the DVOR with the identifier “WRB”. For simplicity reasons each WT is defined identically with 65 m nacelle height and 67 m rotor diameter above a plane ground. All WTs' rotors are oriented towards the DVOR and are rotated with one blade in upward position. The WTs as well as the ground plane are modelled as perfect electrical conductors (PEC).
Two analysis surfaces (AS) AS1 and AS2, illustrated in Fig. 3, were defined in the radio shadow of the WF exceeding its 8.5∘ cone angle by ±3∘ concerning the horizontal axis (HAX).
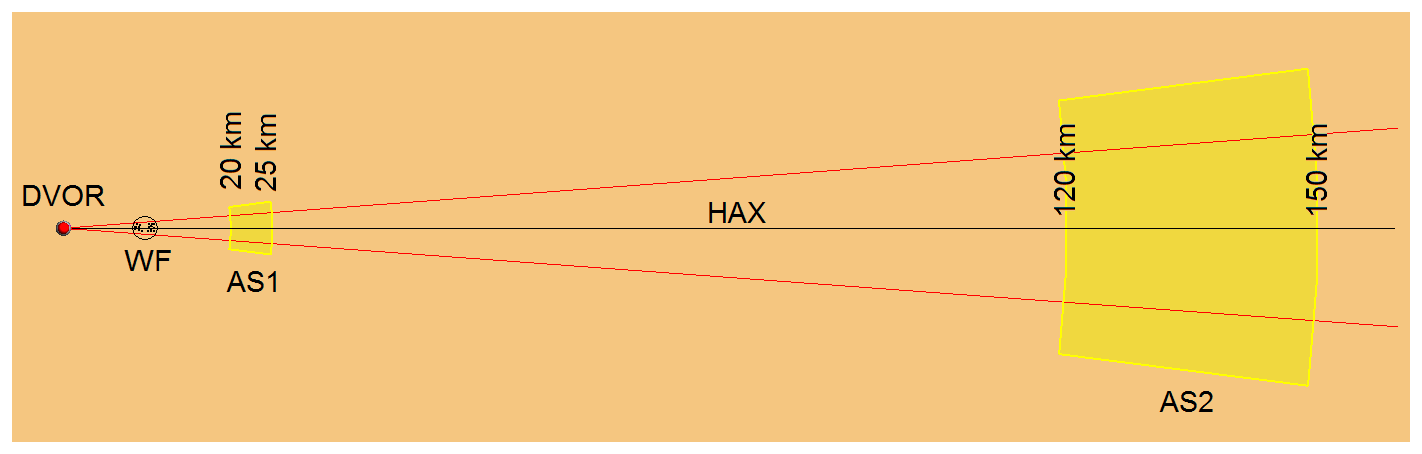
In order to produce practically significant investigation results AS1 is located at the DVOR's shortest operating distance of 20–25 km, while AS2 is located in a distance of 120–150 km, which marks the end of the operating area.
For the highest bearing errors are expected at lower altitudes, the chosen ASs' height is 525 m for AS1 and 3150 m for AS2, according to the lowest used operating altitude at the corresponding distance, considering the height differences between the earth's curvature and plane ground model.
On each AS 25 600 analysis points are defined, in which the electric field strength is simulated for all Alford Loop antennas of the DVOR. As previous investigations show, the resolution on the more distant AS2 has not to be increased because the bearing error pattern is geometrically expanded with rising distance as well.
The simulations are carried out at a frequency of 113.7 MHz with the Multi Level Fast Multipole Method (MLFMM) (van Tonder and Jakobus, 2005) of the electromagnetic simulation tool FEKO (FEKO kernel version 2018-209, 2019).
The described scenario is simulated in two simulation series with WT and as a reference without any WT at all. The first simulation series S consists of 28 simulations each with one separated WT out of the WF. In the second simulation series C also 28 simulations are carried out, with the only difference that the quantity of the considered WTs is cumulating in every simulation step. Accordingly, in the 1st step of the simulation series C only WT1 is considered, while in the 5th simulation step WT1-WT5 are included and the last step contains all WT.
For every simulation step of the two simulation series S and C the bearing values in every analysis point of the ASs are calculated in postprocessing, based on the simulated field strengths. Subsequently, in each point the corresponding bearing value of the reference simulation is subtracted in order to determine the bearing error.
As a first result, the two ASs' bearing error values of the simulation series S and C with each 28 simulation steps are calculated. The results on one of the altogether calculated ASs is shown as an example in Fig. 4.
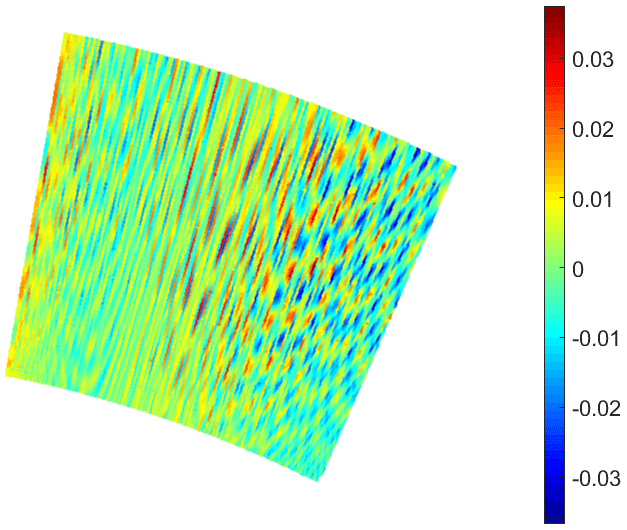
Figure 4Exemplary illustration of bearing error in ∘ on an AS1, calculated in presence of WT1-WT6.
In a first consideration, in Sect. 4.1 the results of the simulation series S are used to obtain an assessment for the separated bearing error contribution of every WT on the two ASs. Subsequently, in Sect. 4.2 an investigation is carried out on the cumulation of the bearing error caused by multiple WTs from simulation series C and the possibility to estimate this error by the separated error values from simulation series S.
4.1 Simulation series S
For the bearing error constitutes a complex pattern, as shown in Fig. 4, the generated results are regarded statistically. For this purpose boxplot diagrams are used as explained on the example AS in Fig. 5. In this diagram the boxplot designates the median, the 25 %- and 75 %-quantiles, the whiskers and the outliers of the bearing error shown in Fig. 4. While the bearing error resolution equals 0.005∘ per div, the zero-level is not indicated on the ordinate but designated by the corresponding reference mark. Due to every boxplot has its own reference mark, the ordinate is, as well as the abscissa, available for indication of other parameters.
This advantage is used for creation of an overview diagram of all AS boxplots in dependence on the WT location, which the results are referring to. Shown in Fig. 7, every boxplot indicates the statistical bearing error on AS1 caused by a WT of which the location parameters, defined in Fig. 6, are given by the corresponding axis values of the boxplot. While the ordinate value is designated by the reference line of the boxplot, the vertical boxplot axis is arranged on the corresponding abscissa value.
Accordingly, the statistical bearing error on AS2 is shown in Fig. 8.
Interpreting the bearing errors it can be stated that the median errors as well as the statistical distributions are approximately in the same range. Nevertheless the tendency can be recognised that the bearing errors a getting smaller with rising distance between the WT and the DVOR as well as they in general are slightly smaller on AS2 than on the AS1, which is closer to the DVOR.
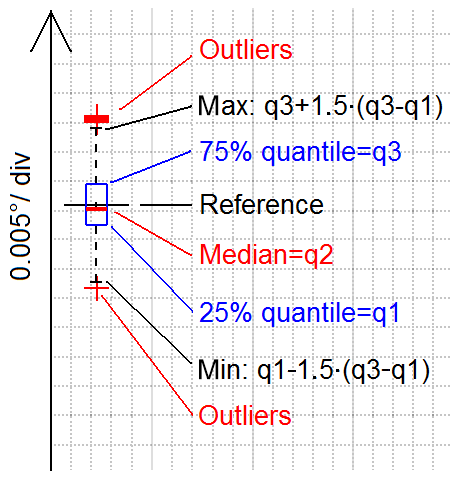
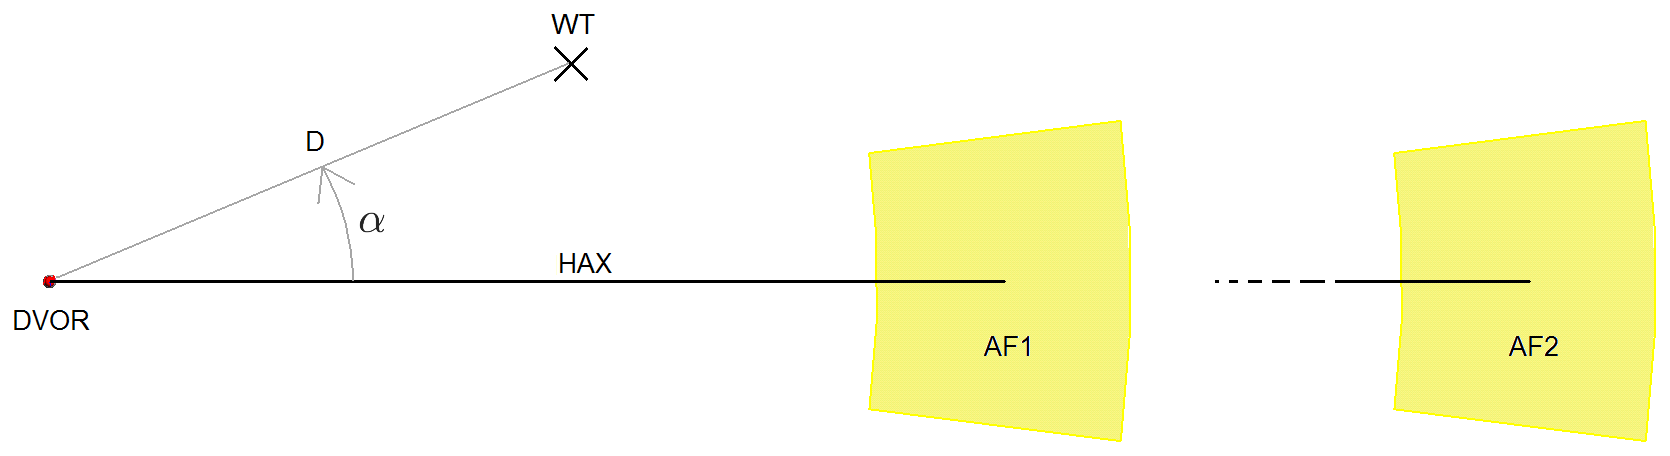
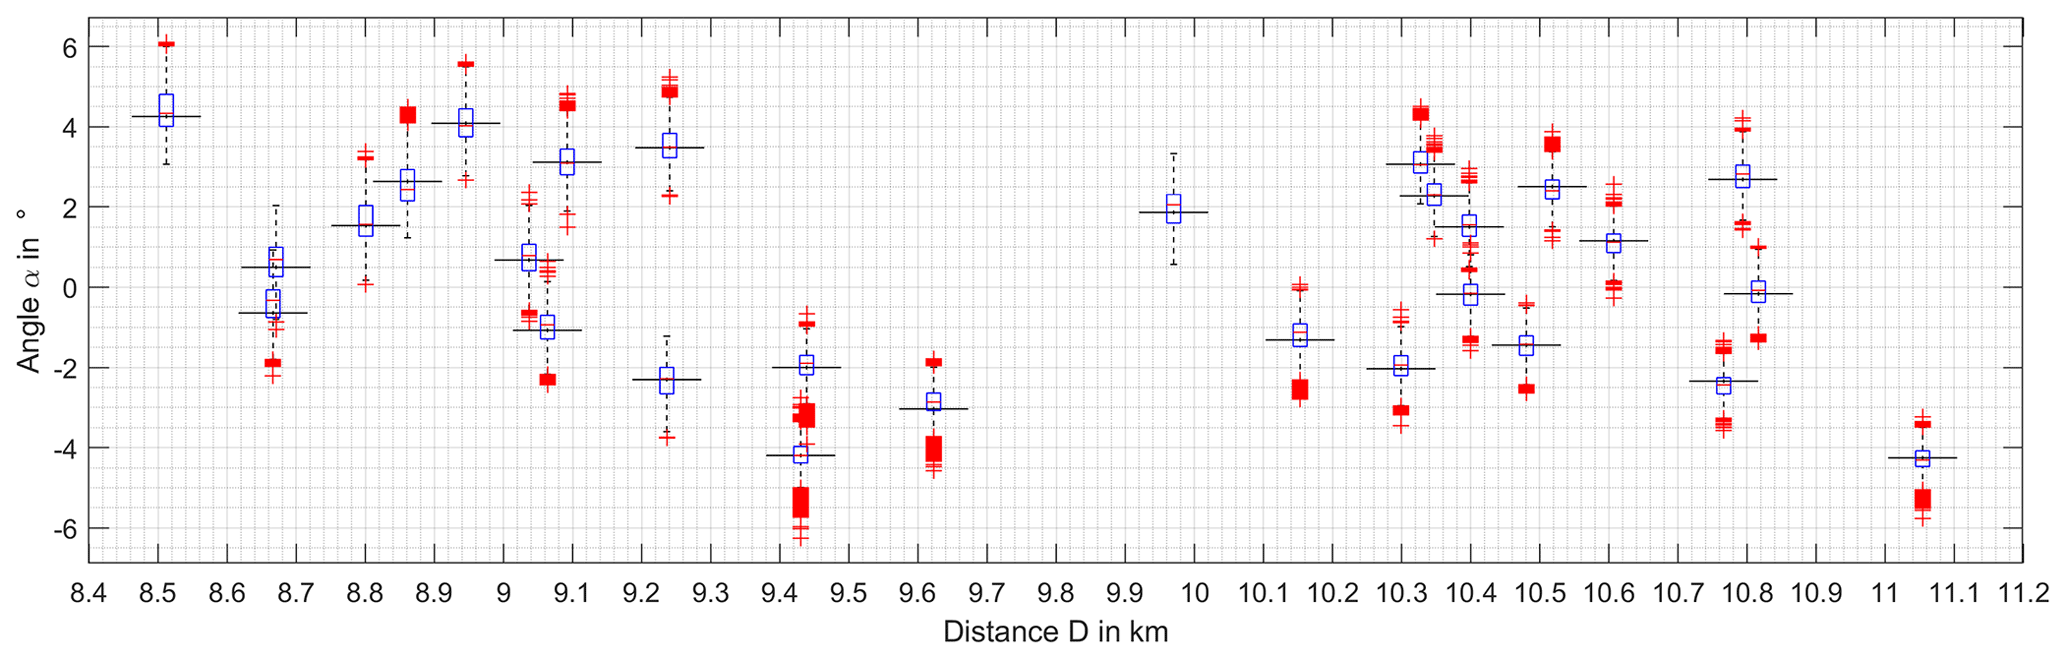
Figure 7Boxplot overview for AS1 in dependence of WT location. Bearing resolution: 0.005∘ per div.
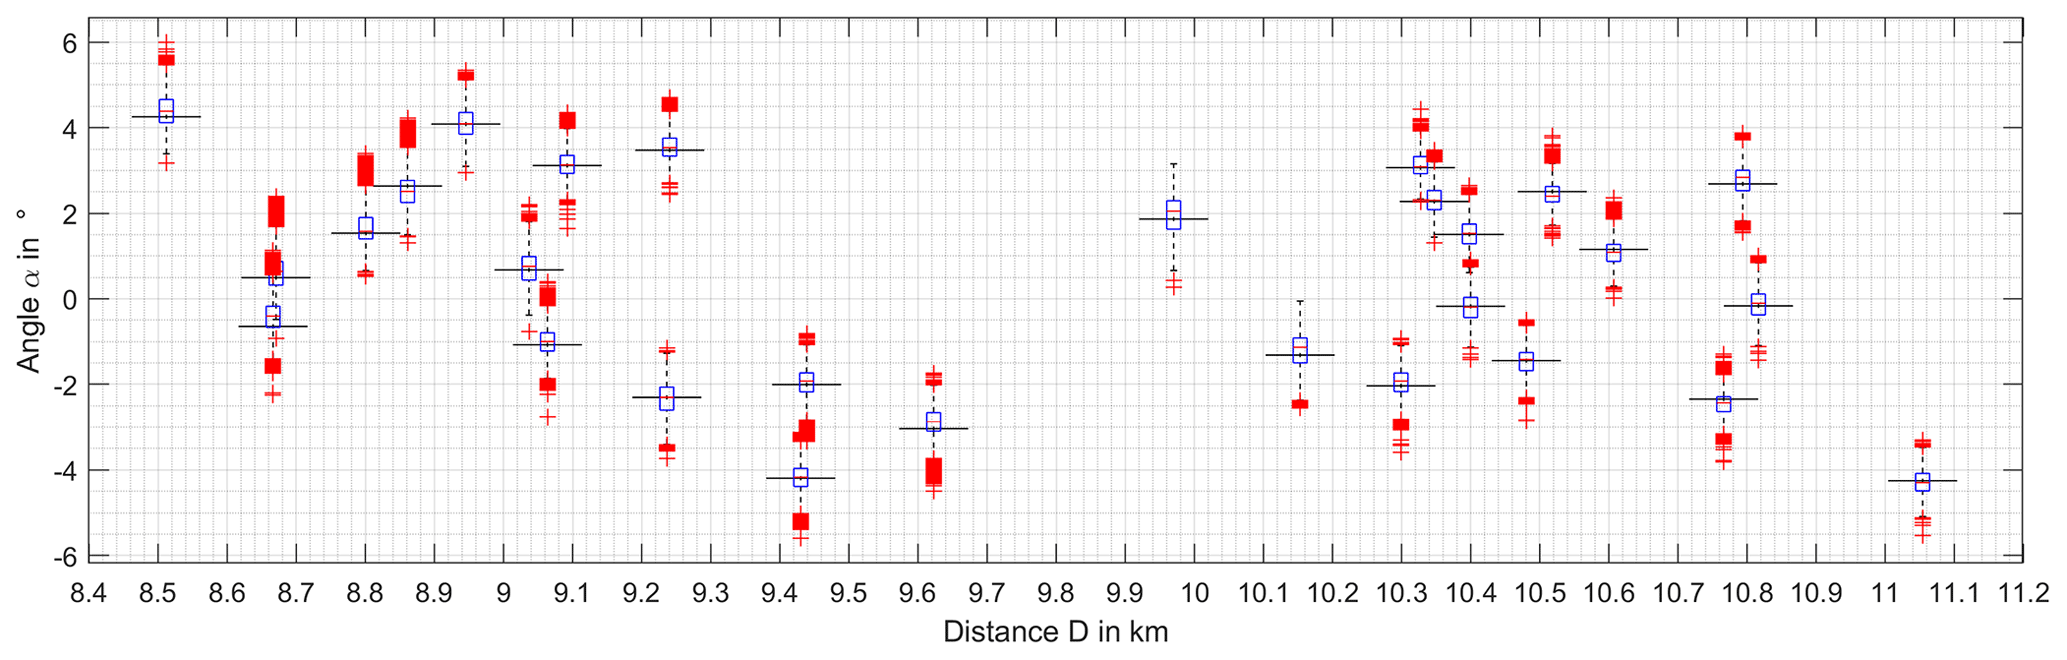
Figure 8Boxplot overview for AS2 in dependence of WT location. Bearing resolution: 0.005∘ per div.
4.2 Simulation series C
For the investigations on the cumulative bearing error the mean and maximum rectified bearing errors, given in Eqs. (1) and (2), are calculated for the ASs. In order to estimate the cumulatively calculated error values of simulation series C by summation of the separated error values calculated in series S the following summation methods are used: linear summation given in Eq. (3), geometrical summation given in Eq. (4) and cognate summations with freely choosable root factor K given in Eq. (5).
As previous investigations in generic scenarios show (Sandmann and Garbe, 2017), the linear summation tends to exaggerate the cumulatively calculated values but was carried out in this work as well for comparison reasons due to the linear summation of bearing error contributions is often handled as a kind of worst case calculation in expert discussions.
As explained in Sandmann et al. (2016), the bearing errors constitute a complex pattern of negative and positive values which constitutes the assumption of the individual bearing error contributions to be uncorrelated. Therefore it is reasonable to apply the geometrical summation (GUM, JCGM, 2008). Considering the summation formulas in Eqs. (3) and (4) it is perspicuous that the same summation principle is applied, merely the factor K, given in Eq. (5), is adapted. Based on this consideration the summation with freely choosable factor K is introduced, while K is found by an optimisation algorithm.
As shown in Fig. 9 for AS1, the linear summated mean rectified bearing error values exaggerate the cumulatively calculated ones by far. Even the geometrical added results overstate the cumulative values systematically. Best conformity is achieved with a factor K of 2.68.
Regarding the corresponding values for AS2, shown in Fig. 10, similar characteristics can be observed. The cumulative results are slightly less than the results of the addition with factor K, analogue to the behavior of decreasing bearing error with rising distance, already observed in Figs. 7 and 8.
The results concerning the maximum rectified bearing error , shown in Fig. 11 for AS1 and Fig. 12 for AS2, are less smooth than the mean rectified values, for only one, accordingly the maximum bearing deviated point is considered per AS. Nevertheless familiar graph progression can be recognized. A good estimation of the maximum rectified bearing error of AS1 is achieved by the geometrical addition. As known from the mean bearing error , the maximum error values on AS2 are slightly lower than the one for AS1.
Furthermore, especially for AS2, decreasing maximum rectified bearing error with rising WT quantity can be observed. This effect has outstanding significance since it demonstrates the blurring character of bearing errors caused by multiple scattering objects.
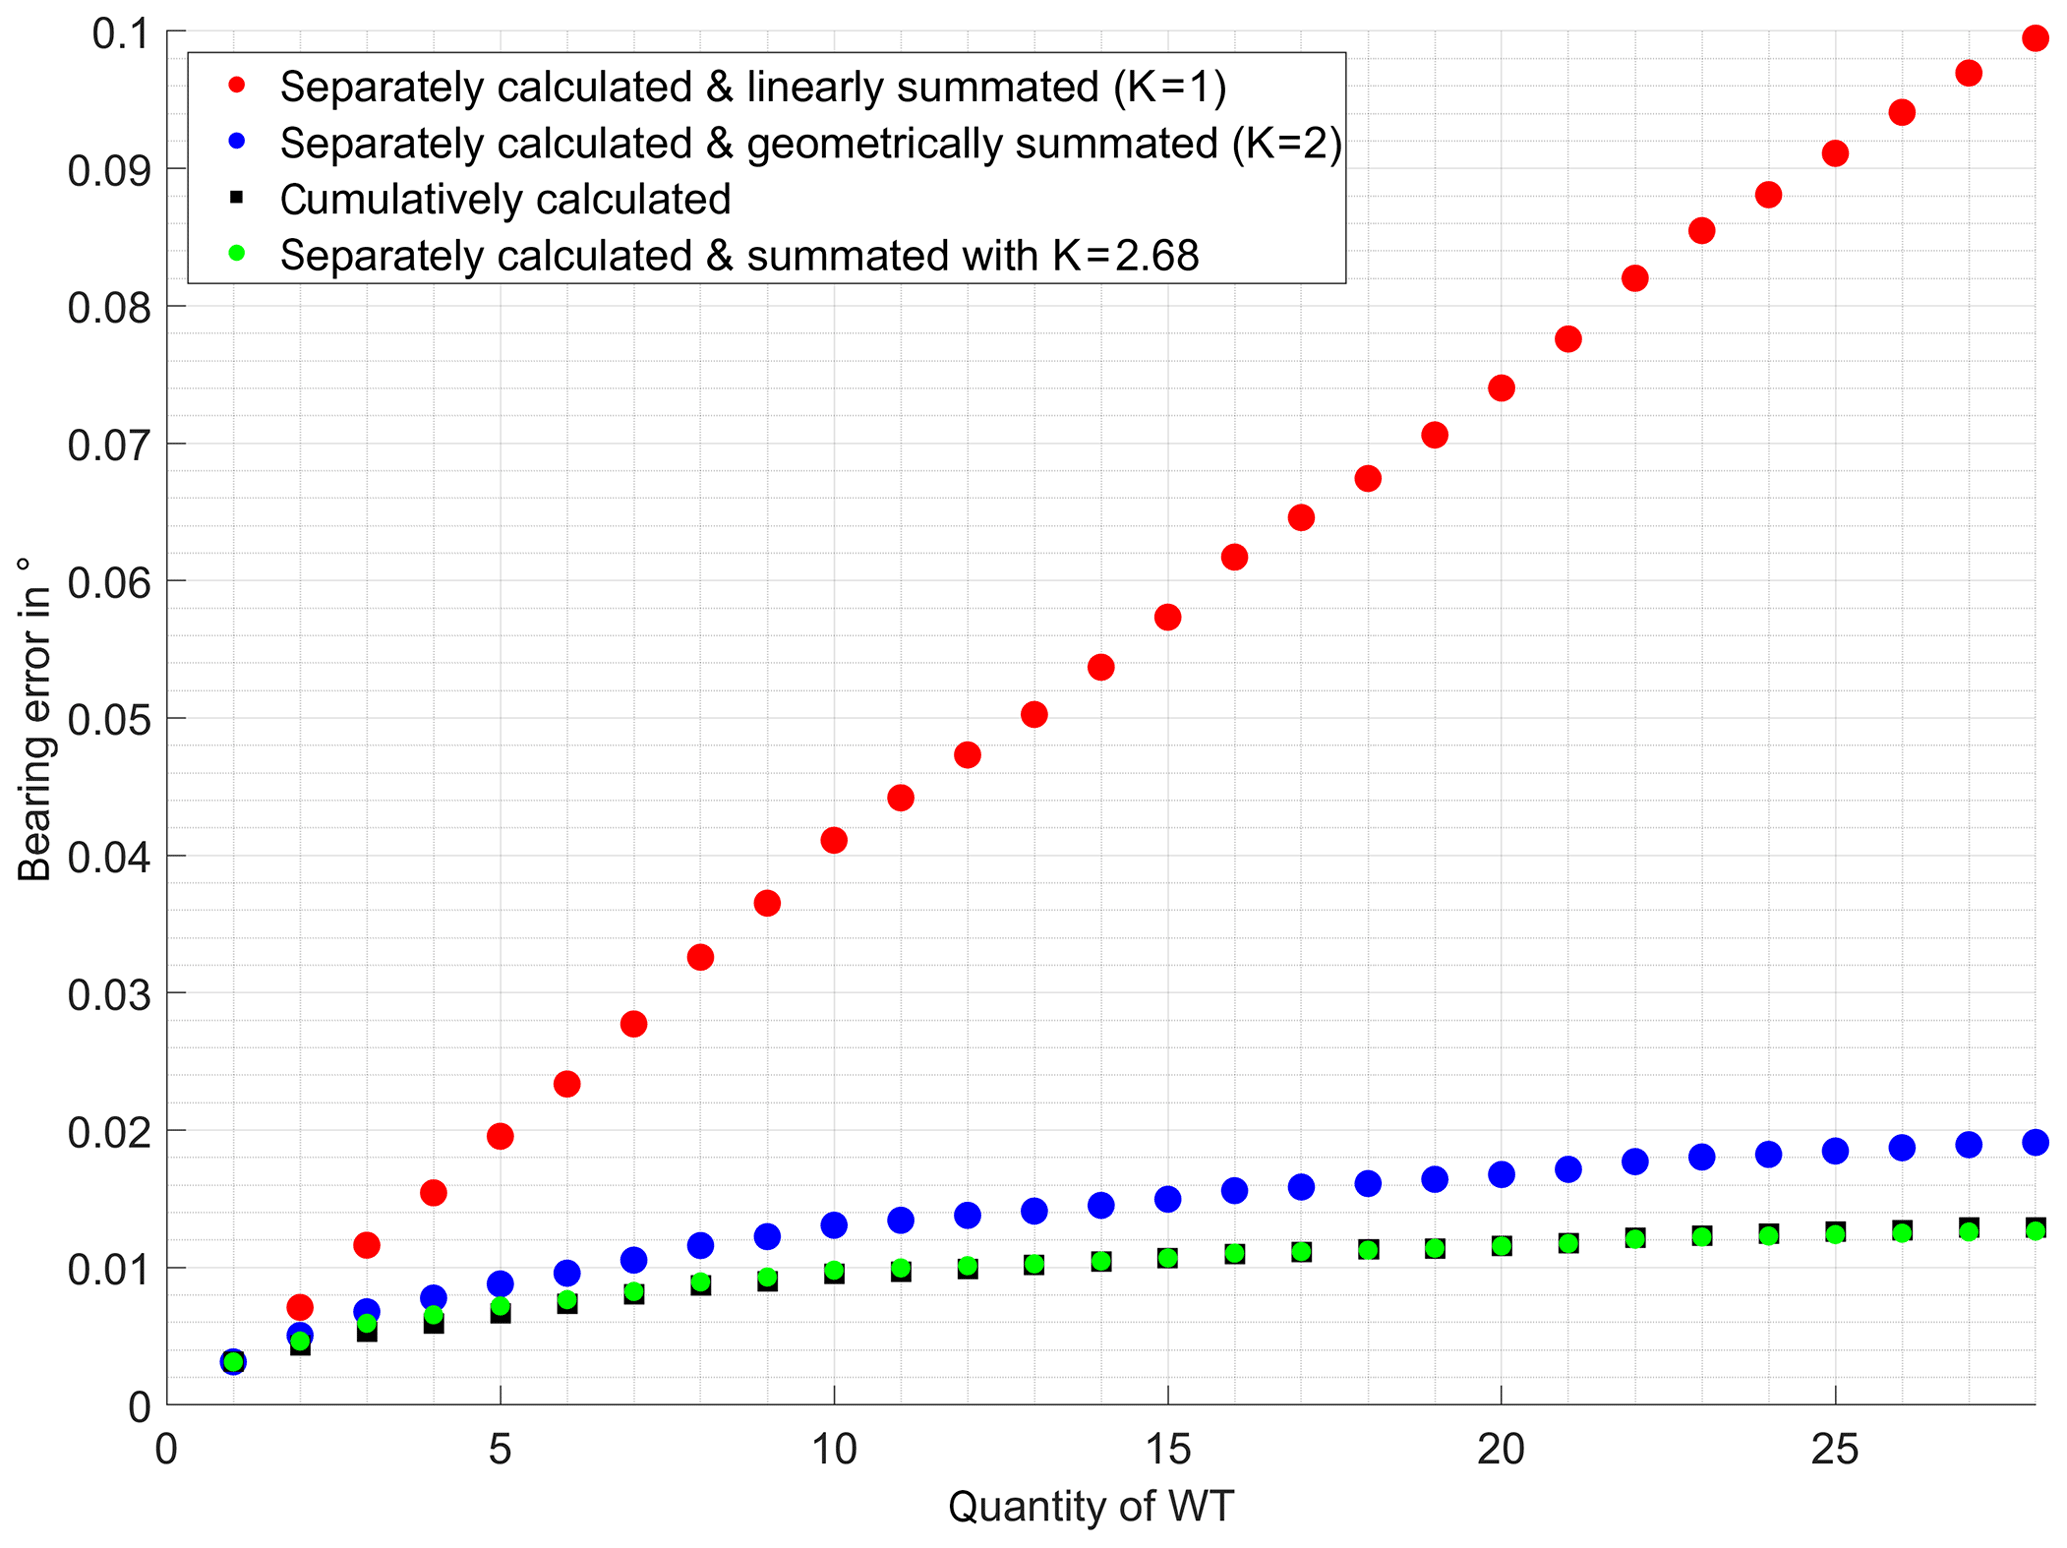
Figure 9Variously summated vs. cumulatively calculated mean rectified bearing error caused by multiple WT on AS1.
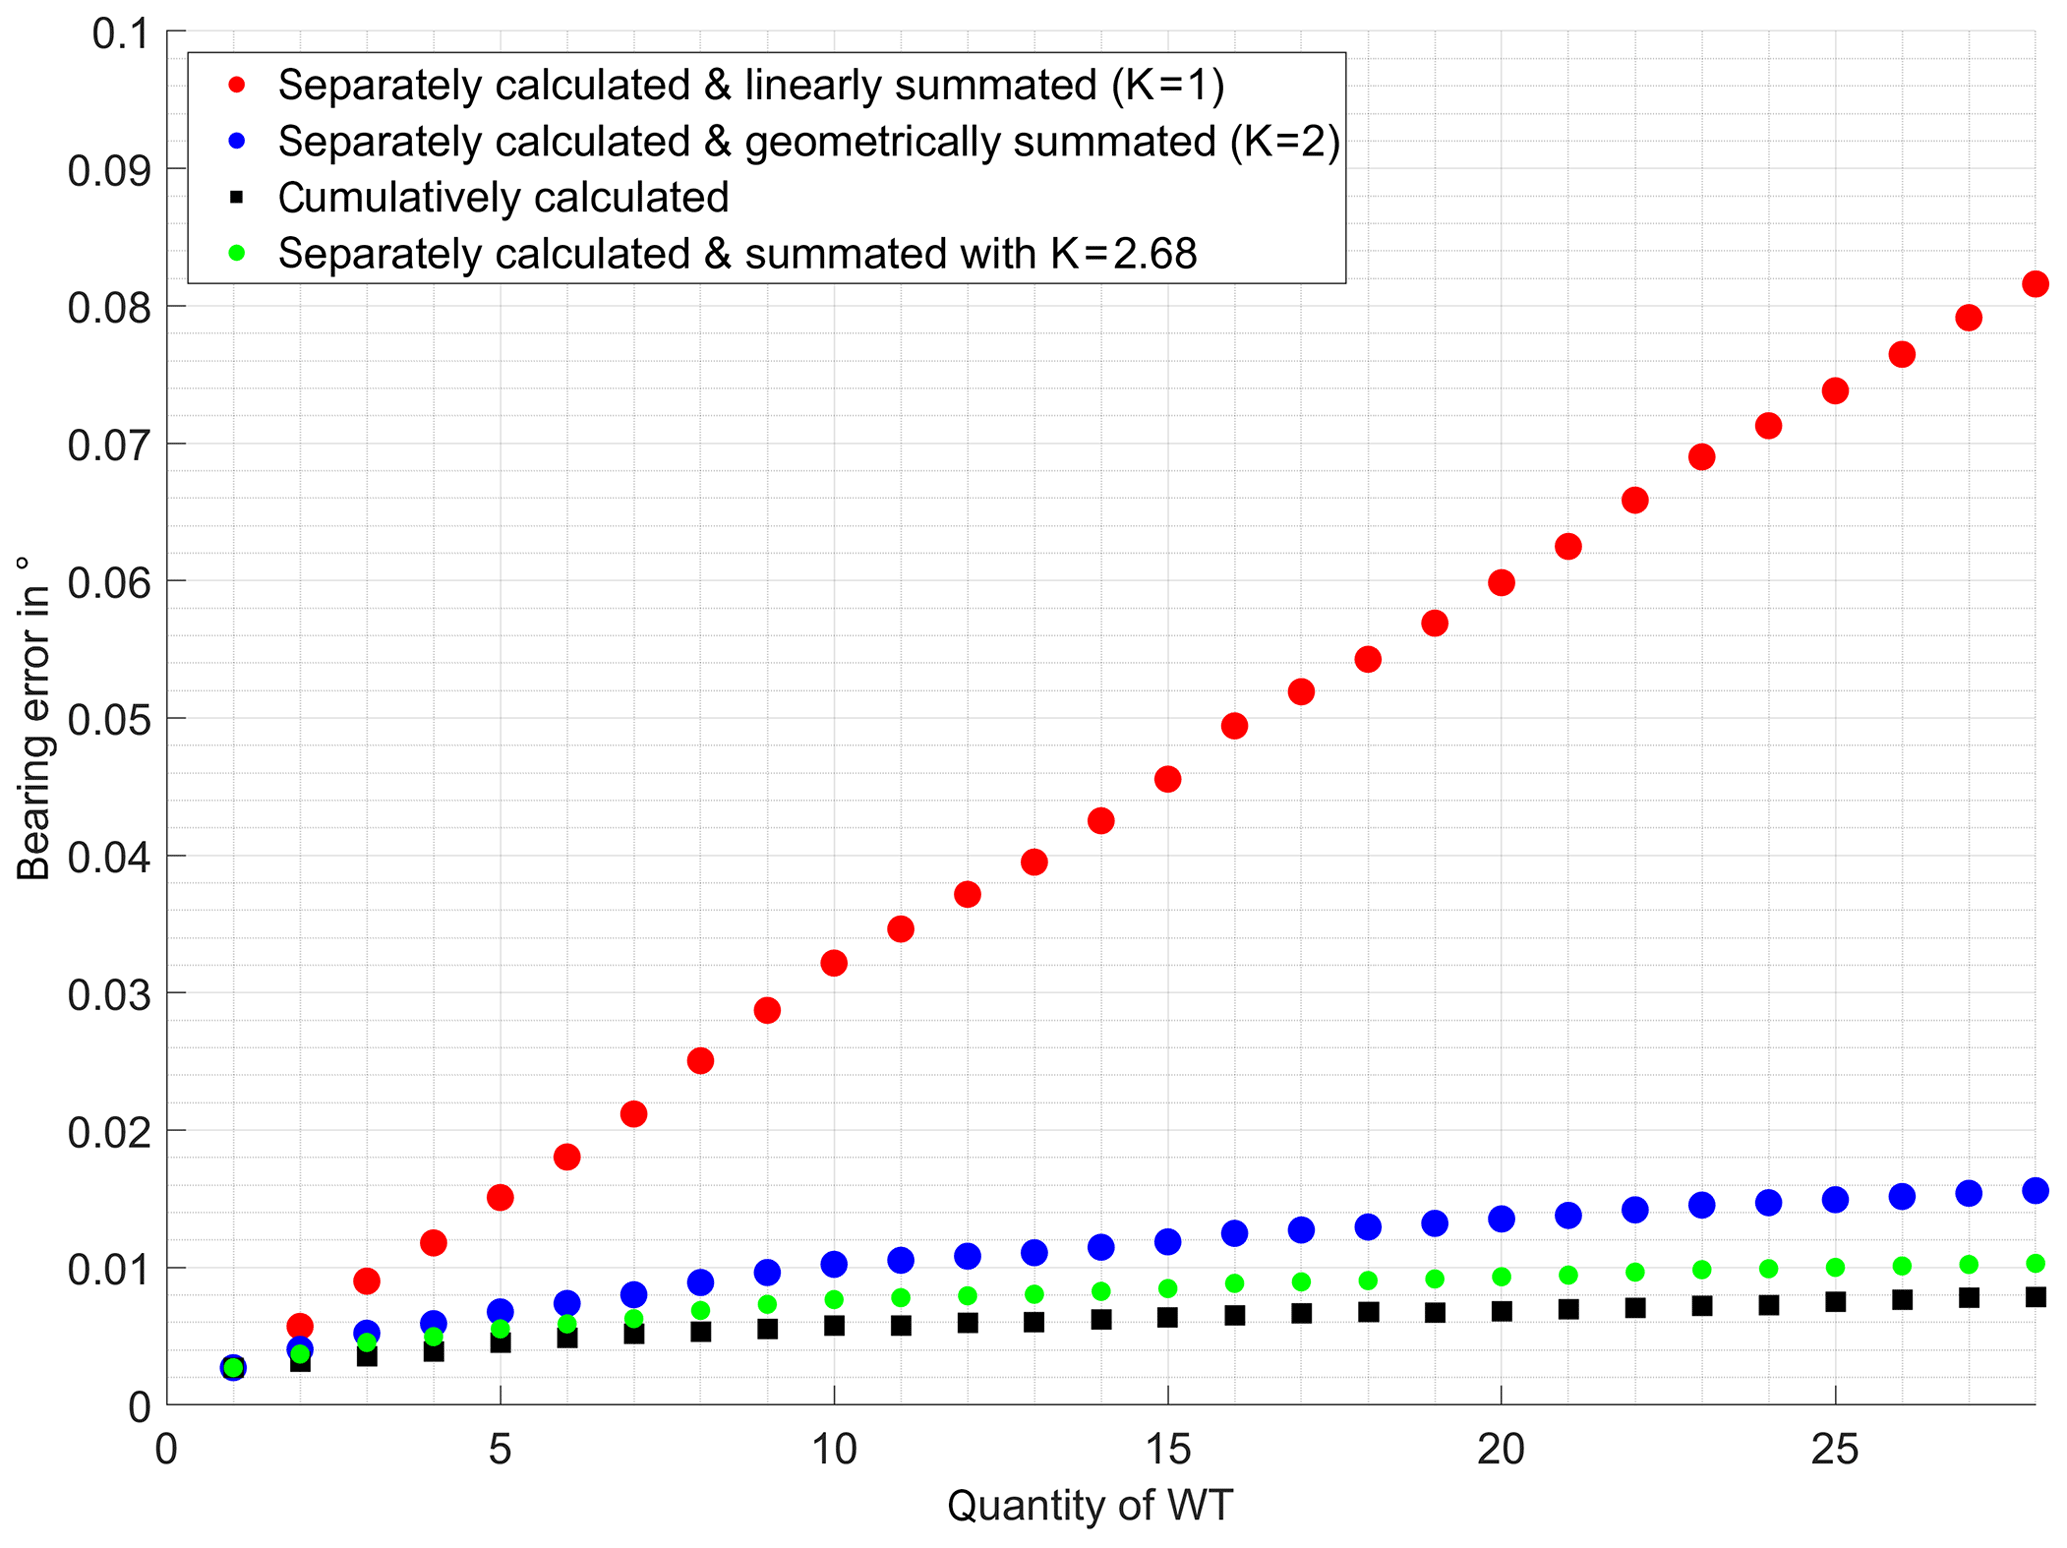
Figure 10Variously summated vs. cumulatively calculated mean rectified bearing error caused by multiple WT on AS2.
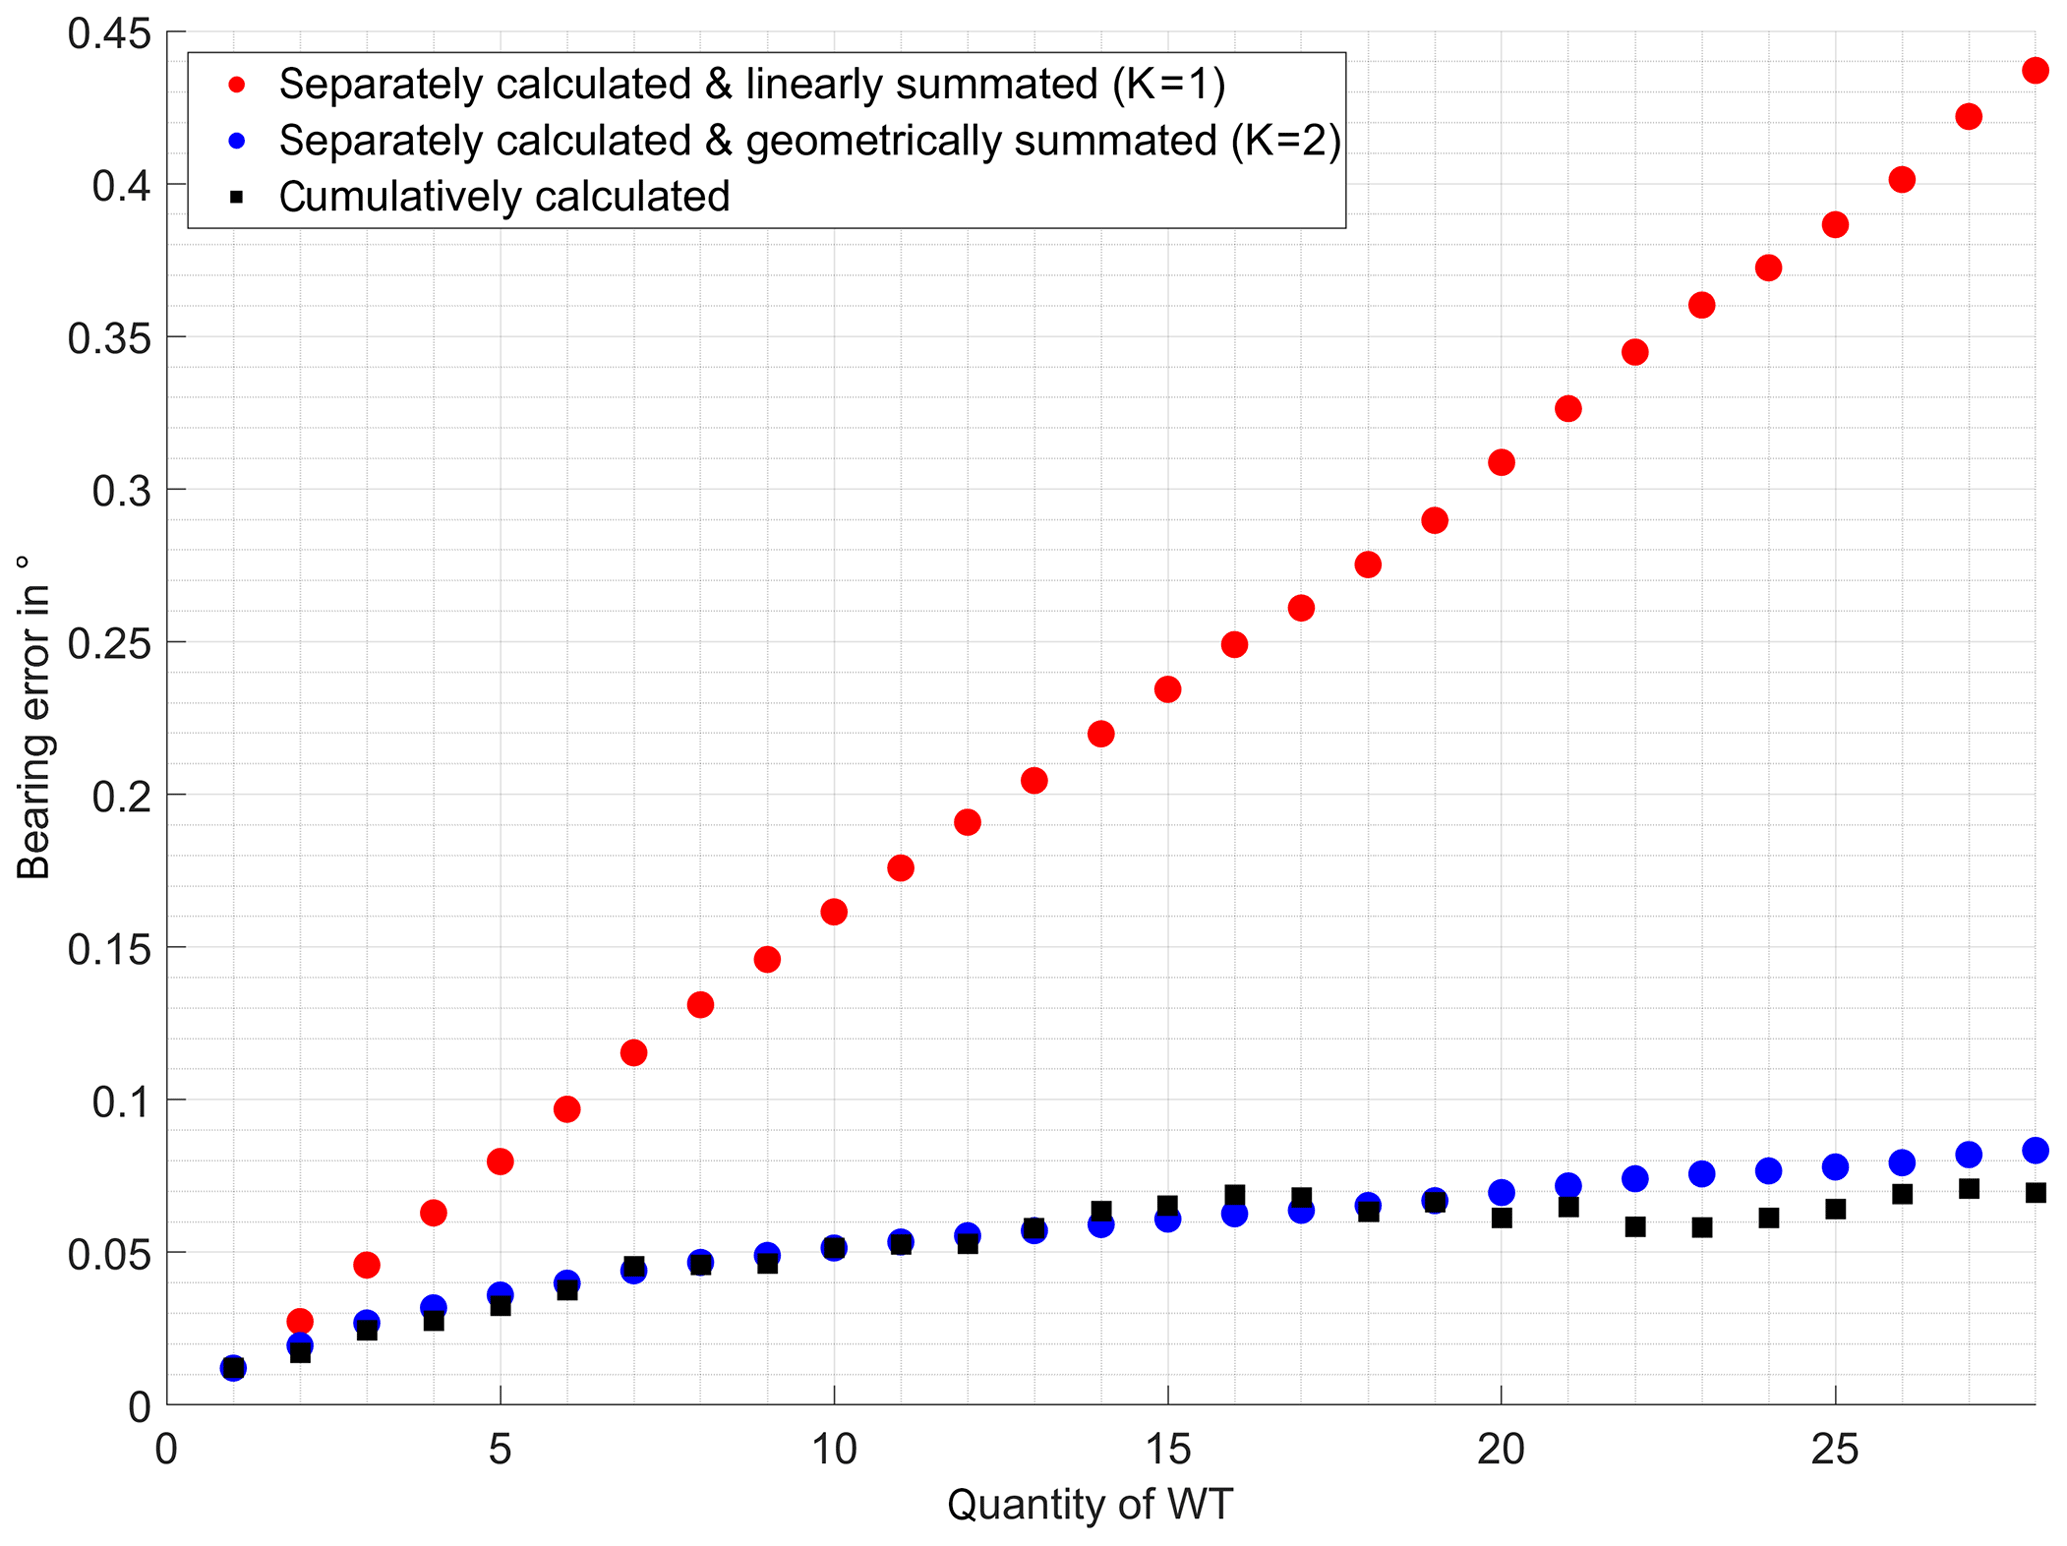
Figure 11Linear and geometrically summated vs. cumulatively calculated max. rectified bearing error caused by multiple WT on AS1.

Figure 12Linear and geometrically summated vs. cumulatively calculated max. rectified bearing error caused by multiple WT on AS2.
As a conclusion it must be clearly stated that the linear addition of bearing error contributions is not suitable for use as a worst case estimation, for it exorbitantly exaggerates the actual values. Whereas the geometrical addition offers good estimations for the superposition of the maximum bearing errors in proximal operation distances. For the corresponding superposition of mean rectified bearing errors best results are achieved with a summation root factor K=2.68. The investigation results confirmed the assessment, made in prior investigations, of scattering objects in general causing less bearing deviations when located more distant from the DVOR. The mean as well as the maximum rectified bearing error is found to be higher on the proximal analysis surface than on the surface at the end of the DVORs operating range. This encourages the assumption of slightly decreasing bearing error with rising distance from the scattering object, which constitutes to interpret the estimations for the proximal analysis surface as a kind of worst case bearing error for more distant locations. Furthermore, especially at the end of the DVOR's operation range, a blurring behaviour of the bearing error has been observed by a decreasing maximum rectified bearing error with rising quantity of WTs.
The simulation data are available on request.
SS elaborated the concept for the research subject. He carried out the investigations by determining the scenario, defining the simulation models, programming the postprocessing algorithms and analysing the data. Furthermore, he visualized the results, wrote the final paper and presented the work on the corresponding conference.
HG was supervising the entire process taking part in advising discussions and performed the final review.
The authors declare that they have no conflict of interest.
This article is part of the special issue “Kleinheubacher Berichte 2018”. It is a result of the Kleinheubacher Tagung 2018, Miltenberg, Germany, 24–26 September 2018.
The results presented here were partially carried out on the LUIS cluster system at the Leibniz University Hannover, Germany.
This work has been partially supported by the research project WERAN plus. Support granted by the Federal Ministry of Economy and Energy according to a resolution by the German Federal Parliament (FKZ, grant no. 0324252B).
The publication of this article was funded by the open-access fund of Leibniz Universität Hannover.
This paper was edited by Thorsten Schrader and reviewed by two anonymous referees.
Anderson, S. R. and Flint, R. B.: The CAA Doppler Omnirange, in: Proceedings of the IRE, 47, 808–821, https://doi.org/10.1109/JRPROC.1959.287274, 1959. a
DOC 8071: Manual on testing of radio navigation aids. Testing of ground-based radio navigation systems, ICAO, 2000, available at: https://www.icao.int, last access: 9 July 2019. a
EUR DOC 015: European guidance material on managing building restricted areas, ICAO, 2015, available at: https://www.icao.int, last access: 9 July 2019. a
FEKO kernel version 2018-209: Altair Engineering GmbH, Calwer Straße 7, 71034 Böblingen, Germany, available at: https://altairhyperworks.com, last access: 9 July 2019. a
Fernandes, J. A., Correia, L. M., Alves, C., Pissarro, L., and Teixeira, M.: Assessment of wind turbines generators influence in VOR aeronautical navigation systems, 2014 IEEE Antennas and Propagation Society International Symposium (APSURSI), Memphis, TN, 709–710, https://doi.org/10.1109/APS.2014.6904685, 2014. a
GUM, GUM, JCGM: Evaluation of measurement data – Guide to the expression of uncertainty in measurement (GUM), available at: http://www.bipm.org (last access: 9 July 2019), 2008. a
Hirasawa, K.: VOR Bearing Errors Due to Scattering from Conducting Bodies, 1984 International Symposium on Electromagnetic Compatibility, Tokyo, 1–5, https://doi.org/10.1109/ISEMC2.1984.7568114, 1984. a
Morlaas , C., Fares, M., and Souny, B.: Wind turbine effects on VOR system performance, IEEE T. Aero. Elec. Sys., 44, 1464–1476, https://doi.org/10.1109/TAES.2008.4667722, 2008. a
Sandmann, S. and Garbe, H.: Überlagerung der Störeinflüsse mehrerer Streuobjekte auf die Zielgröße eines Doppler-Drehfunkfeuers (DVOR), Technisches Messen, 84, 549–556, https://doi.org/10.1515/teme-2016-0073, 2017. a
Sandmann, S., Garbe, H., Bredemeyer, J., and Schrader, T.: Ermittlung der gesamten Unsicherheit des Winkelfehlers eines Doppler-Drehfunkfeuers (DVOR), in: XXX. Messtechnisches Symposium 2016, Walter de Gruyter GmbH, Berlin/Boston, 175–182, https://doi.org/10.1515/9783110494297-023, 2016. a
van Tonder, J. J. and Jakobus, U.: Fast multipole solution of metallic and dielectric scattering problems in FEKO, Wireless Communications and Applied Computational Electromagnetics, IEEE/ACES International Conference, Honolulu, HI, 511–514, 2005. a