 | 14 Oct 2019
Verification and first test measurement of a microwave-based vital sign monitor
Daniel Schmiech
Aly Marnach
Andreas R. Diewald
The authors present a microwave-based vital sign monitoring system to detect the breathing rate of premature infants in a baby incubator. The sensor is a four channel I/Q-radar system with adapted antennas to cover the predefined region of interest on the patient surface of the incubator. In order to prove the correct illumination of the reclining area an electromotive actuator and a pneumatic dummy is used. With a periodic and repeatable breathing simulation the reflected signal in the sensor system is measured and evaluated. In the publication the radar system in the baby incubator, the electromotive actuator and the infant dummy are presented.
- Article
(4878 KB) - Full-text XML
- BibTeX
- EndNote


One of the most important signs of a living body demonstrating its life-sustaining functions is the respiration rate. State of the art for measuring this vital sign is using a monitoring system (e.g ECG) cable connected to electrodes which are attached to the patients' skin. Especially in the case of newborn infants this method is not always suitable and causing several problems, like skin injuries, high stress levels and random loosening of the sensor. To avoid these, non-contact vital sign detection systems has been researched for decades, see Lin (1975), Will et al. (2017), Lin and Li (2008) as well as Droitcour et al. (2009) to mention just a few.
This paper presents the development process of a microwave-based vital sign monitor. In Sect. 2 the authors give a short overview of the used hardware system. The first verification of the sensor, using a simple but very practical simulation system, is presented in Sect. 3.1. Section 3.2 shows the verification of the system in a more realistic dummy environment.
The used radar system has four receiving and two transmitting antennas. All receiving channels are designed to get I/Q - quadrature signals. Operating at 24 GHz a frequency-modulated continuous-wave (FMCW) radar with a bandwidth of 250 MHz and a centre frequency of 24.125 GHz is used. Figure 1a shows the front side of the RF-hardware. As the radar system is applied to the top of an incubator, the antenna structure must radiate into broadside direction. To reduce incoming clutter, it has been optimized to get a radiation foot print on the incubator's surface, which is just as big as needed to monitor the respiration rate of the infant. The incubator used has a bed width of 380 mm and a length of 600 mm. The sensor is mounted at a height of 420 mm. Normal born infants are expected to be around 500 mm tall, so the region of interest in this work is set to a length of 300 mm and a width of 130 mm. This results in a minimum 3 dB opening angle of 39.31∘ regarding the H-plane and 17.6∘ regarding the E-plane, see Fig. 2 for a schematic overview and the real build-up.
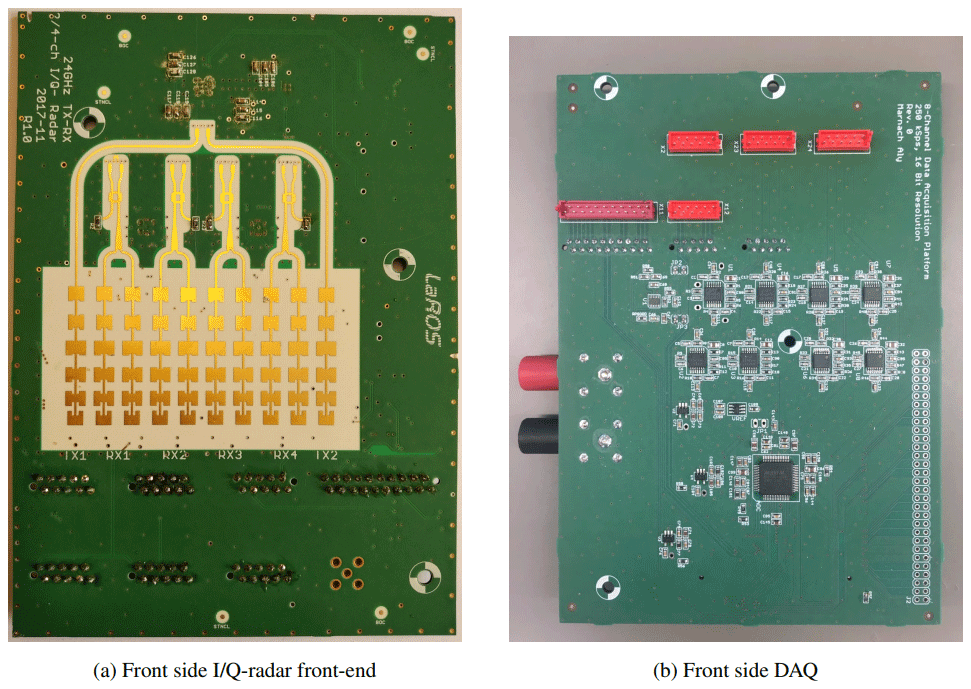

To achieve these requirements a travelling wave inline series-fed patch array is used. The patch array itself has been presented at the “Kleinheubacher Tagung 2017”, it's optimization is shown in Schmiech et al. (2018). For the signal recording, the data acquisition platform (DAQ) from Marnach et al. (2018) is used. It has an eight channel ADC where all the channels are simultaneously sampled. The used ADC has a 16 bit resolution and a maximum sampling rate of 250 kHz for each channel. Further, the data acquisition platform has a 3rd order lowpass filter with a cut-off frequency at 4 kHz and an amplifier for the preprocessing of the received signals. Figure 1b shows the front side of the DAQ where the I/Q-radar PCB can directly be attached. On the back of the DAQ there is the connection to the microcontroller board. The tasks of the microcontroller are as follows:
-
Receive the parameter settings and set up the radar chips for the desired ramp (triangle or sawtooth, number of points per ramp, etc. …). All these settings are defined in a graphical user interface on a computer and transferred to the microcontroller over Ethernet.
-
Trigger each single ramp step.
-
Buffering the ADC values for all channels.
-
After a complete ramp, send all ADC values to the computer and store the data in a file for the later signal processing.
In this section the measurement setup for all different types of measurements is presented. First of all, the sensor system is tested and validated with an electromotive actuator as target. After that, in the second series the sensor is tested with a breathing dummy.
For all of the measurements, the settings shown below are used:
-
FMCW mode
-
128 points per ramp
-
Sampling frequency of each channel: 8192 Hz
-
Ramp repetition rate: 32 Hz
-
Bandwidth: 250 MHz
-
All steps of the ramps are triggered by the microcontroller
3.1 Electromotive actuator
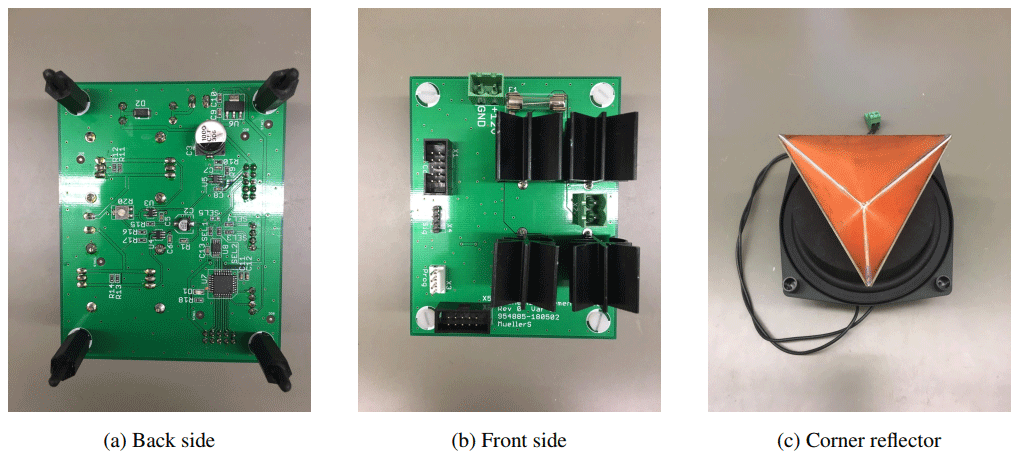
To test the basic functions of the developed sensor, an electromotive actuator is used. Figure 3 shows the developed control module. The microcontroller generates different sinus-wave signals. These signals have a frequency between 0 and 20 Hz and the amplitude is variable. This is needed to create a realistic environment for the later application in the incubator. It is possible to generate two superimposed sinus signals but for the following measurements, one pure sinus wave has been used. To generate the sinus signal for the actuator, a graphical user interface is used to parametrize the desired signal. This will create a lookup-table, which will be loaded to the EEPROM of the microcontroller. After that, the signal will be generated by the internal digital analog converter (DAC).
On top of the electromotive actuator a trihedral corner reflector is mounted to represent a single target, see Fig. 4. The used corner reflector has a radar cross section of 1 m2 which represents the surface of a human body, it is calculated as shown in Eq. (1).
a represents the depth of the corner reflector and f represents the carrier frequency of the transmitting patch antenna. Because the radar system is running in FMCW mode, the middle frequency is used ().
3.2 Pneumatic Dummy
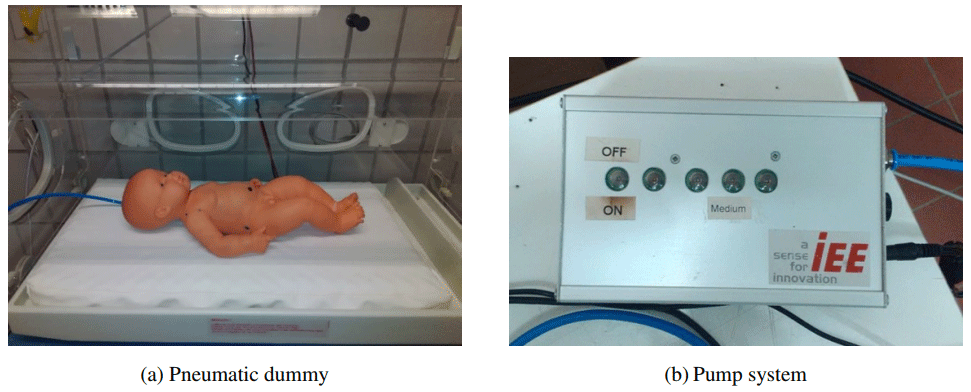
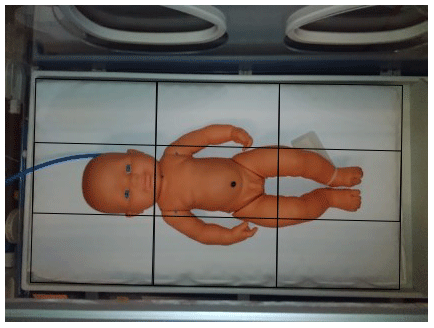
In order to prove the correct illumination of the reclining area in a more realistic scenario, a pneumatic infant dummy is used. Fabricated by IEE S.A. Luxemburg and kindly provided to test the radar sensor, the dummy is based on a baby doll with a ballon inside. The ballon is controlled by a pneumatic pump system, with adjustable frequency of the breathing motion. Figure 5 shows both parts of the dummy. As there is one ballon inside of the doll it is expected that only the stomach region is moving as a single target object. This should result in a circle in the complex domain, see Sect. 4.2.
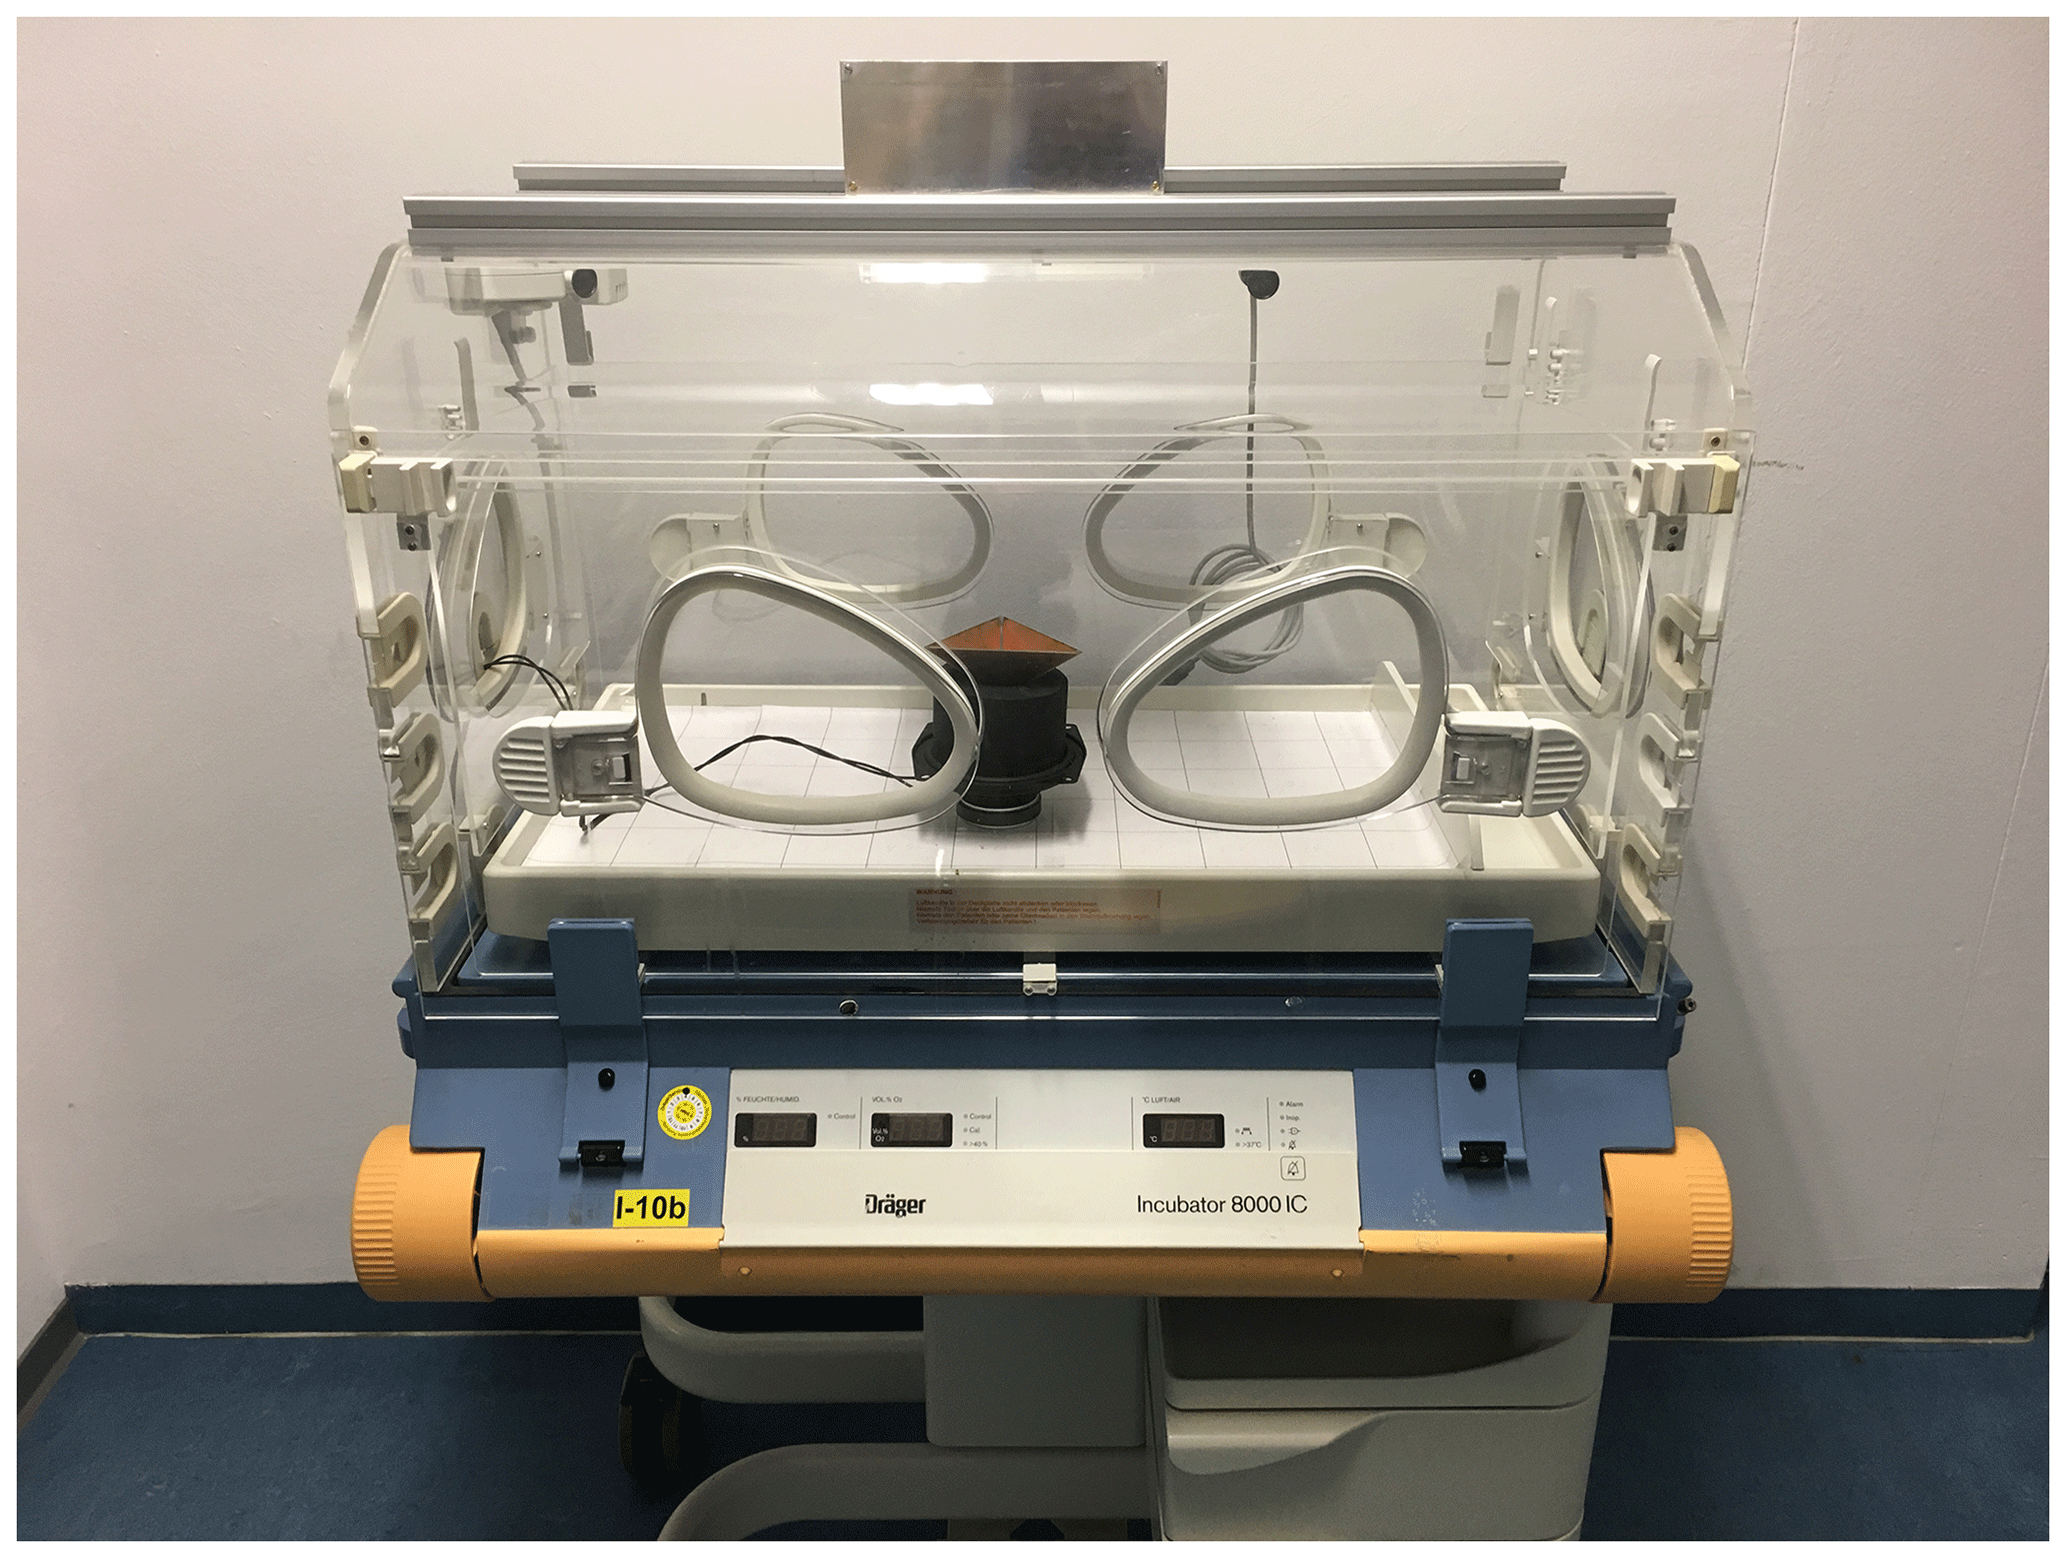
With a periodic and repeatable breathing simulation the reflected signal in the sensor system is measured and evaluated. To test the whole illumination area the dummy is measured on nine different positions in the incubator. Figure 6 shows exemplary the center-center position.
Due to the fact that the target is closer to the sensor than the minimum range resolution, see Eq. (2), the phase response of the RX signal is observed to detect the breathing rate or movement of the actuator.
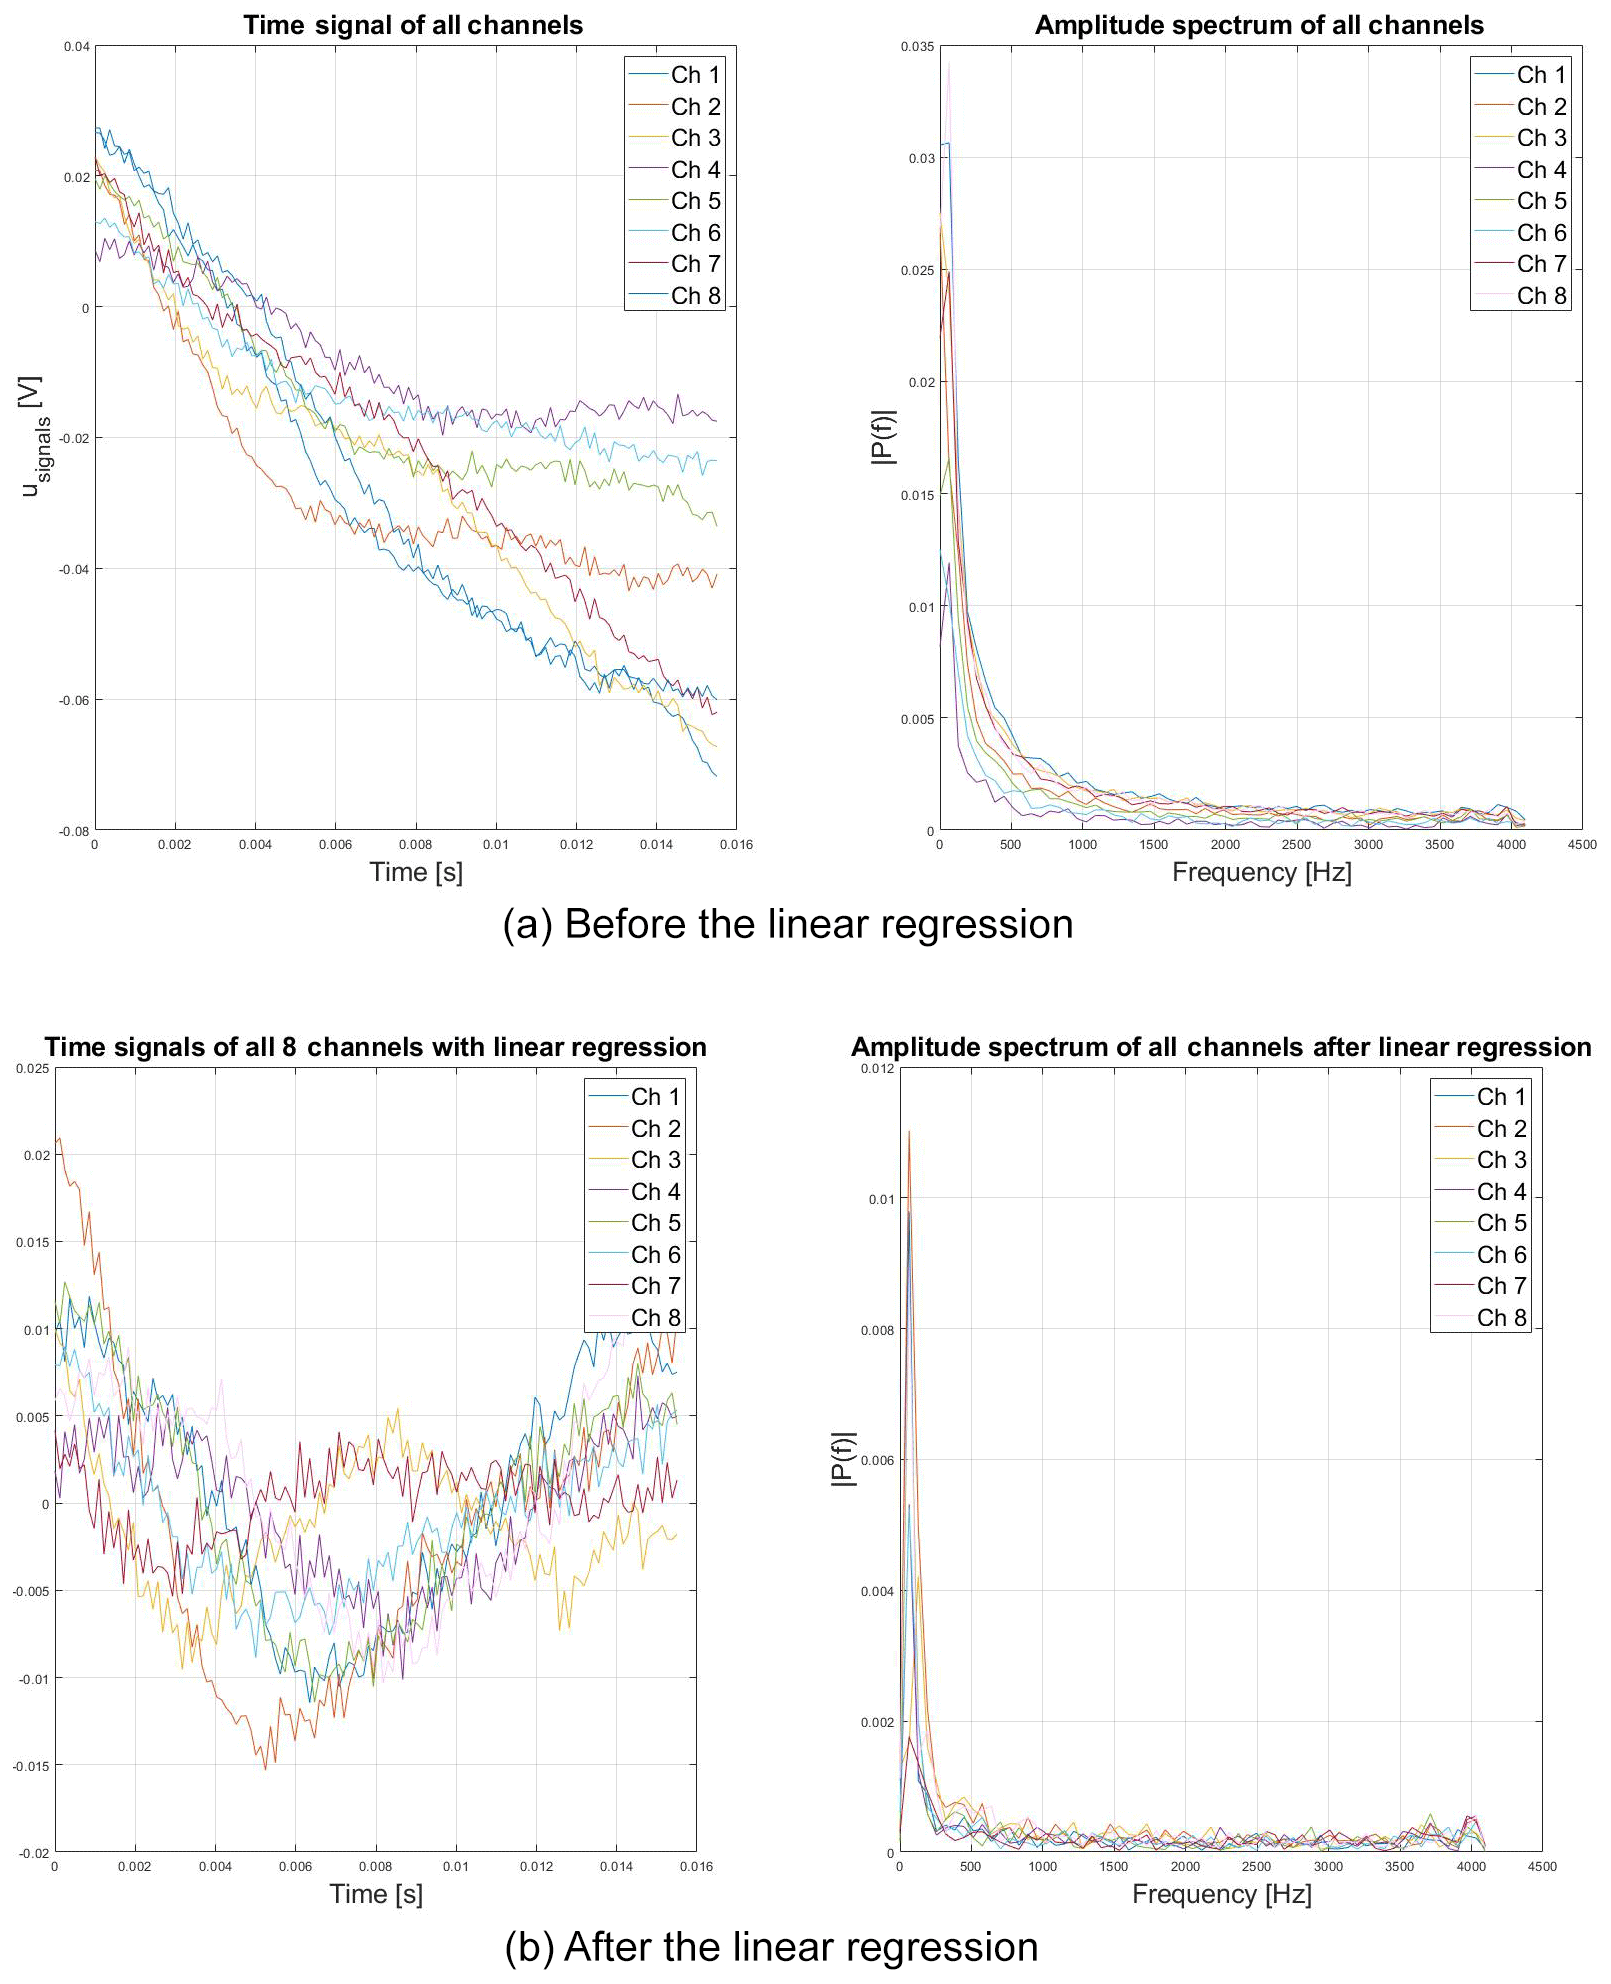
A linear regression is done at first, to remove the directly coupled transmitting signal from the receiving antennas. Then, the I/Q-signal is composed for all four antennas and the FFT is calculated for all ramps. In the first ramp of each measurement, the range bin where the magnitude is tallest has to be found, this bin will represent the observed target. Figure 7 shows exemplary the acquired time signals and the corresponding FFTs before and after the linear regression. It can be seen that without the linear regression there would be a high risk of miscalculating the correct range bin. Now, for all the following ramps, the phase at the identified frequency bin can be calculated from the FFT values and plotted over the time. With a simple peak detection, the breathing rate can be calculated.
4.1 Electromotive actuator
As mentioned in Sect. 3.1 the validation of the sensor system itself is done by using a electromotive actuator with a corner reflector on top. In the first step the patient surface of the incubator is mapped. After the mapping is done the pointer movement in the complex plane can be observed.
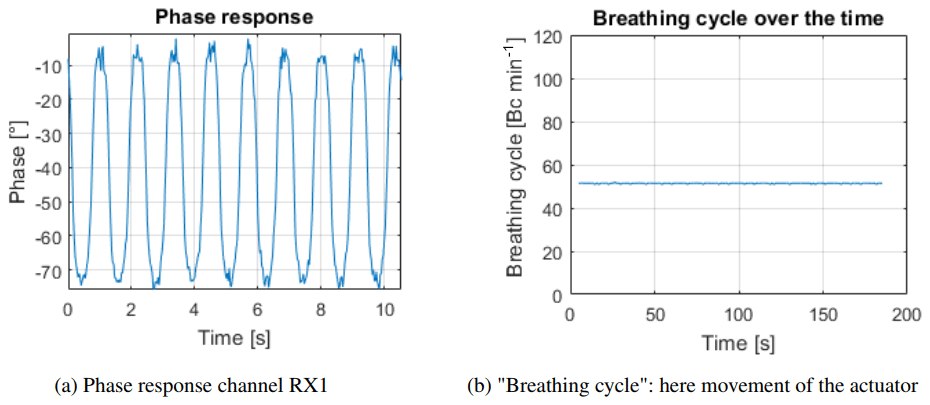
Figure 8Phase response of the first RX channel and calculated “breathing cycle” at square G2.
4.1.1 Mapping of the incubator
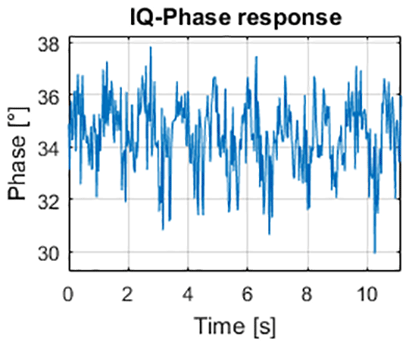
The simulator is driven by a sinus-wave with a frequency of 0.83 Hz (50 min−1) to simulate the breathing. The floor of the incubator is separated in 60 squares, so that the speaker can be placed precisely. Each square is 6 × 6 cm. On the right side, a delimitation of the mattress area exists so that the actuator could not be placed there. The signal-processing mentioned in Sect. 4 is done for each measurement. Figure 8 shows exemplary the results for square G2. It can be seen that with a clear target the phase response is very accurate and the calculated breathing cycle matches with the adjusted one. Square G2 is nearly straight below the radar sensor which is directly in the main beam of the antennas. Figure 9 presents the results for square D6. This square is at the edge of the mattress. It is outside of the region of interest mentioned in Sect. 2. This means that the received power of the antennas is much less than at square G2 before. Also the effective change of the distance between radar sensor and target is less, because at square G2 the actuator moves in the direction of the range axis. At square D6 the axes of movement and range are not the same. This is resulting in less amplitude and clarity in the phase response. As expected, outside of the region of interest the calculation of the movement of the actuator is not possible with the same parameters as before.
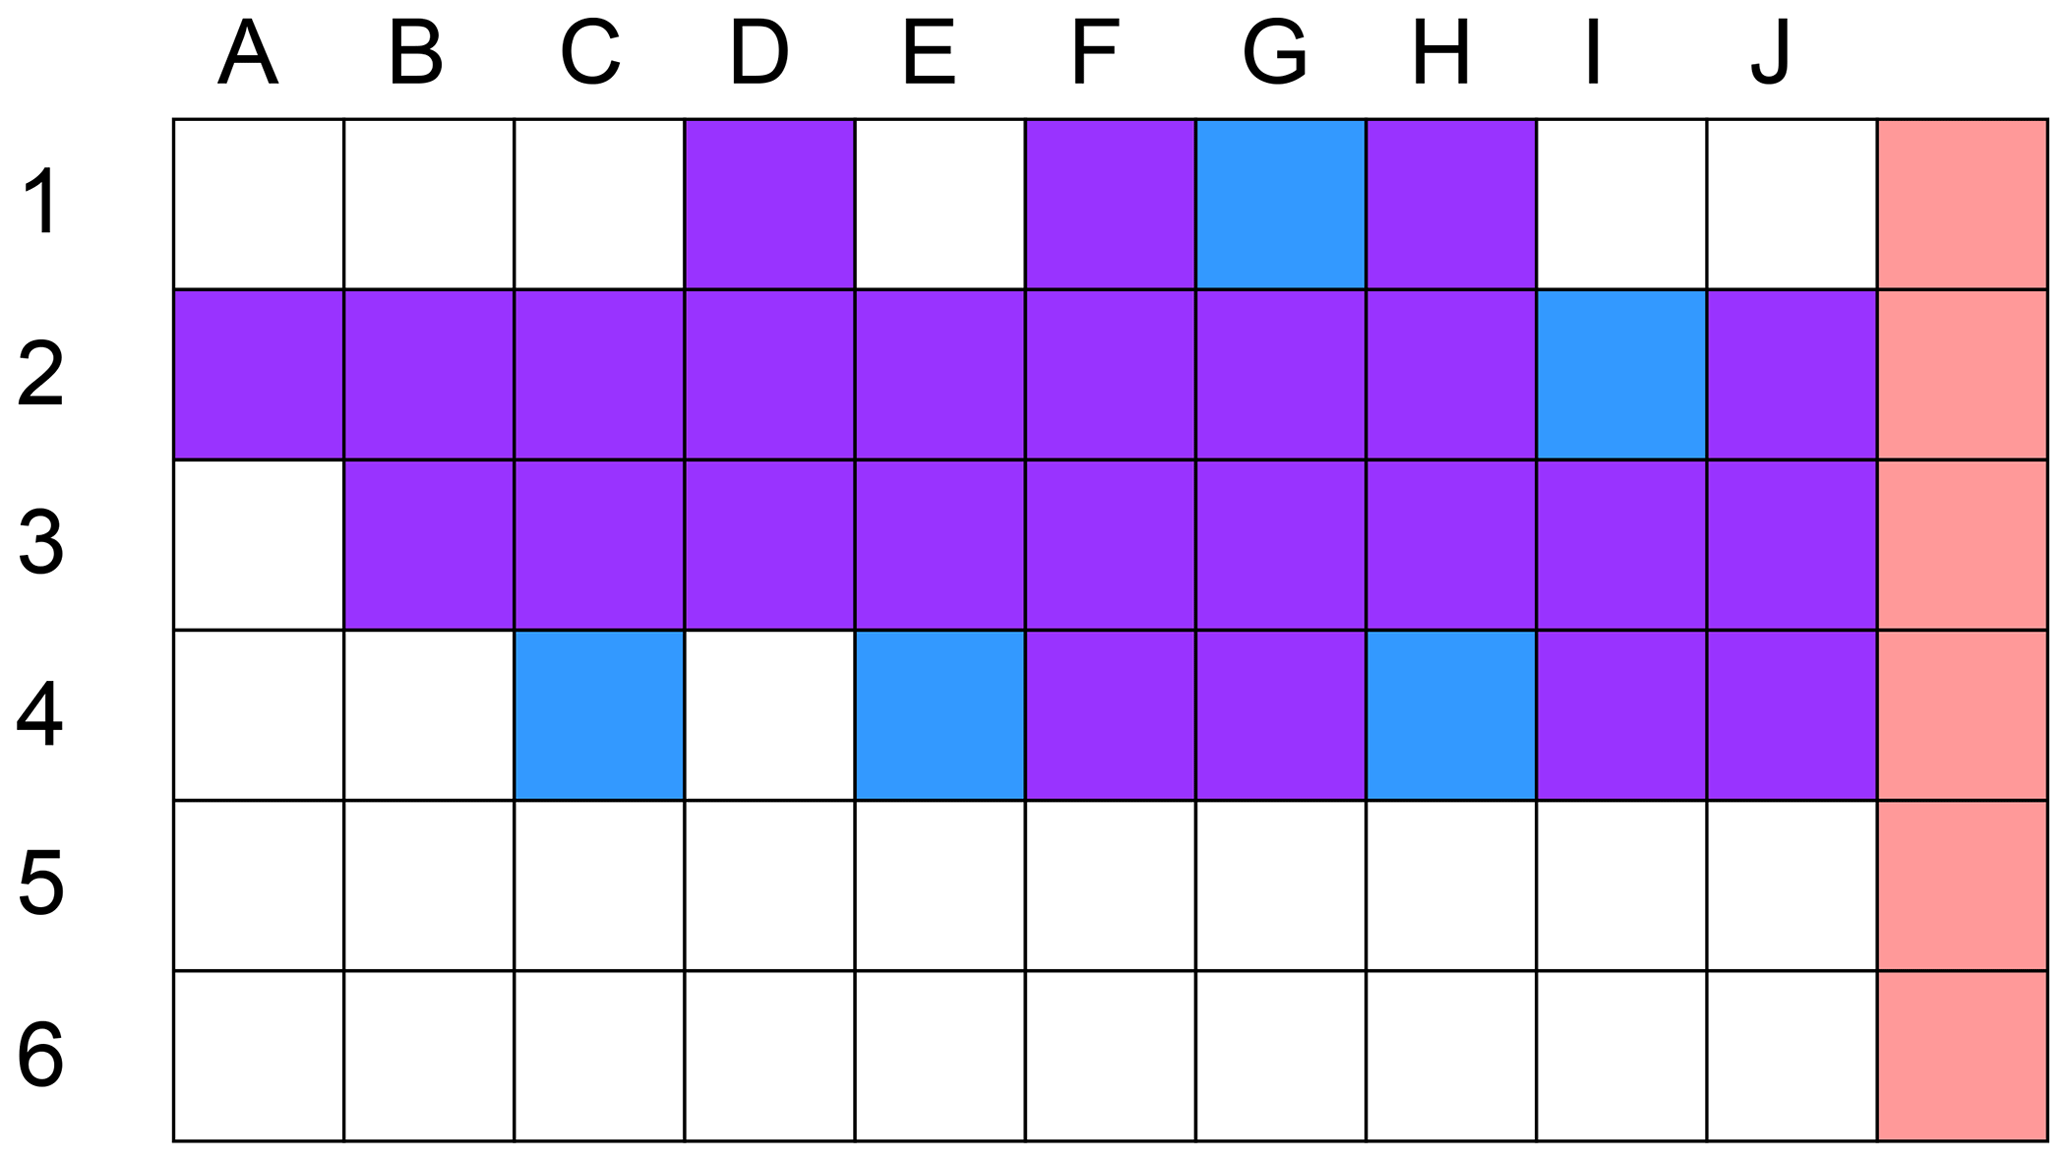
Figure 10 presents the mapping of the whole incubator. Purple squares represent very good measurement results, blue squares show areas of smaller response. That means that there are one or two miscalculations on a measurement series over a 5 min period but the results are good enough to calculate the right breathing cycle after filtering. The white squares represent measurement positions outside of the region of interest and the red marked squares are the positions where the actuator could not be placed because of the delimitation of the mattress. As expected there is a region of very good results with a width of nearly 180 mm and a length of nearly the whole 380 mm of the bed surface. This confirms that the requirements of Sect. 2 are met.
4.1.2 Pointer movement
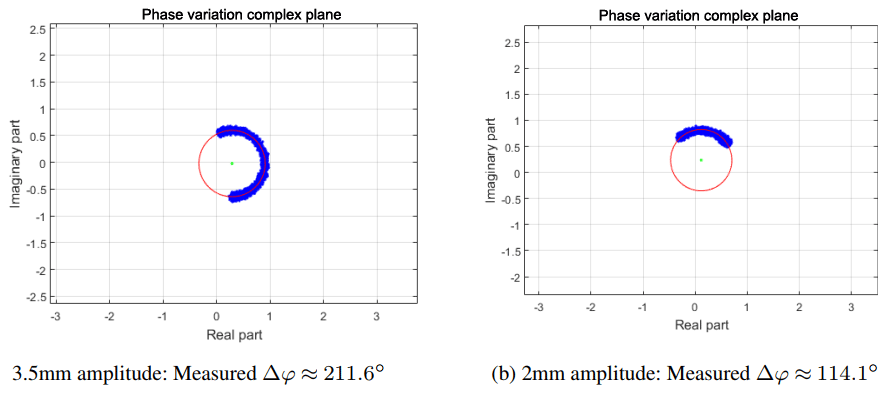
In a second step the previously calculated phase response is presented in the complex plane. These plots have the advantage to easily compare the different measurements considering their quality. Also the amplitude of the actuator could easily be rated qualitatively. To test these abilities two measurements have been done. One with an amplitude of 3.5 mm and one with 2 mm. Equation (3) shows exemplary the calculation of the expected phase deviation for a movement with 3.5 mm amplitude.
d represents the movement between the radar and the speaker whereas λS represents the transmitted center-wavelength. For the amplitude of 2 mm a phase response of φ=115.8∘ is expected. Figure 11 shows the plots in the complex plane of the two measurements. The measured values of the phase deviation nearly matches the calculated ones. For the 3.5 mm amplitude there is a deviation of 9∘ and for the 2 mm it is −1.7∘.
4.2 Pneumatic Dummy
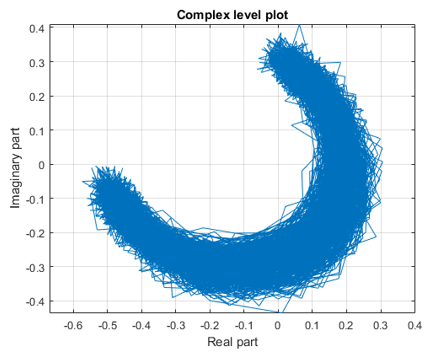
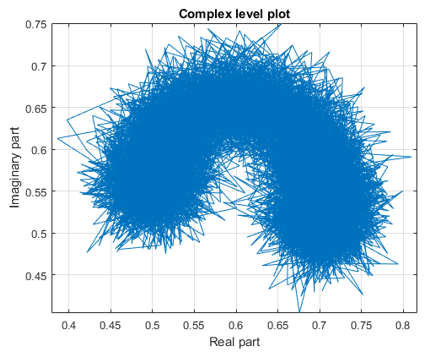
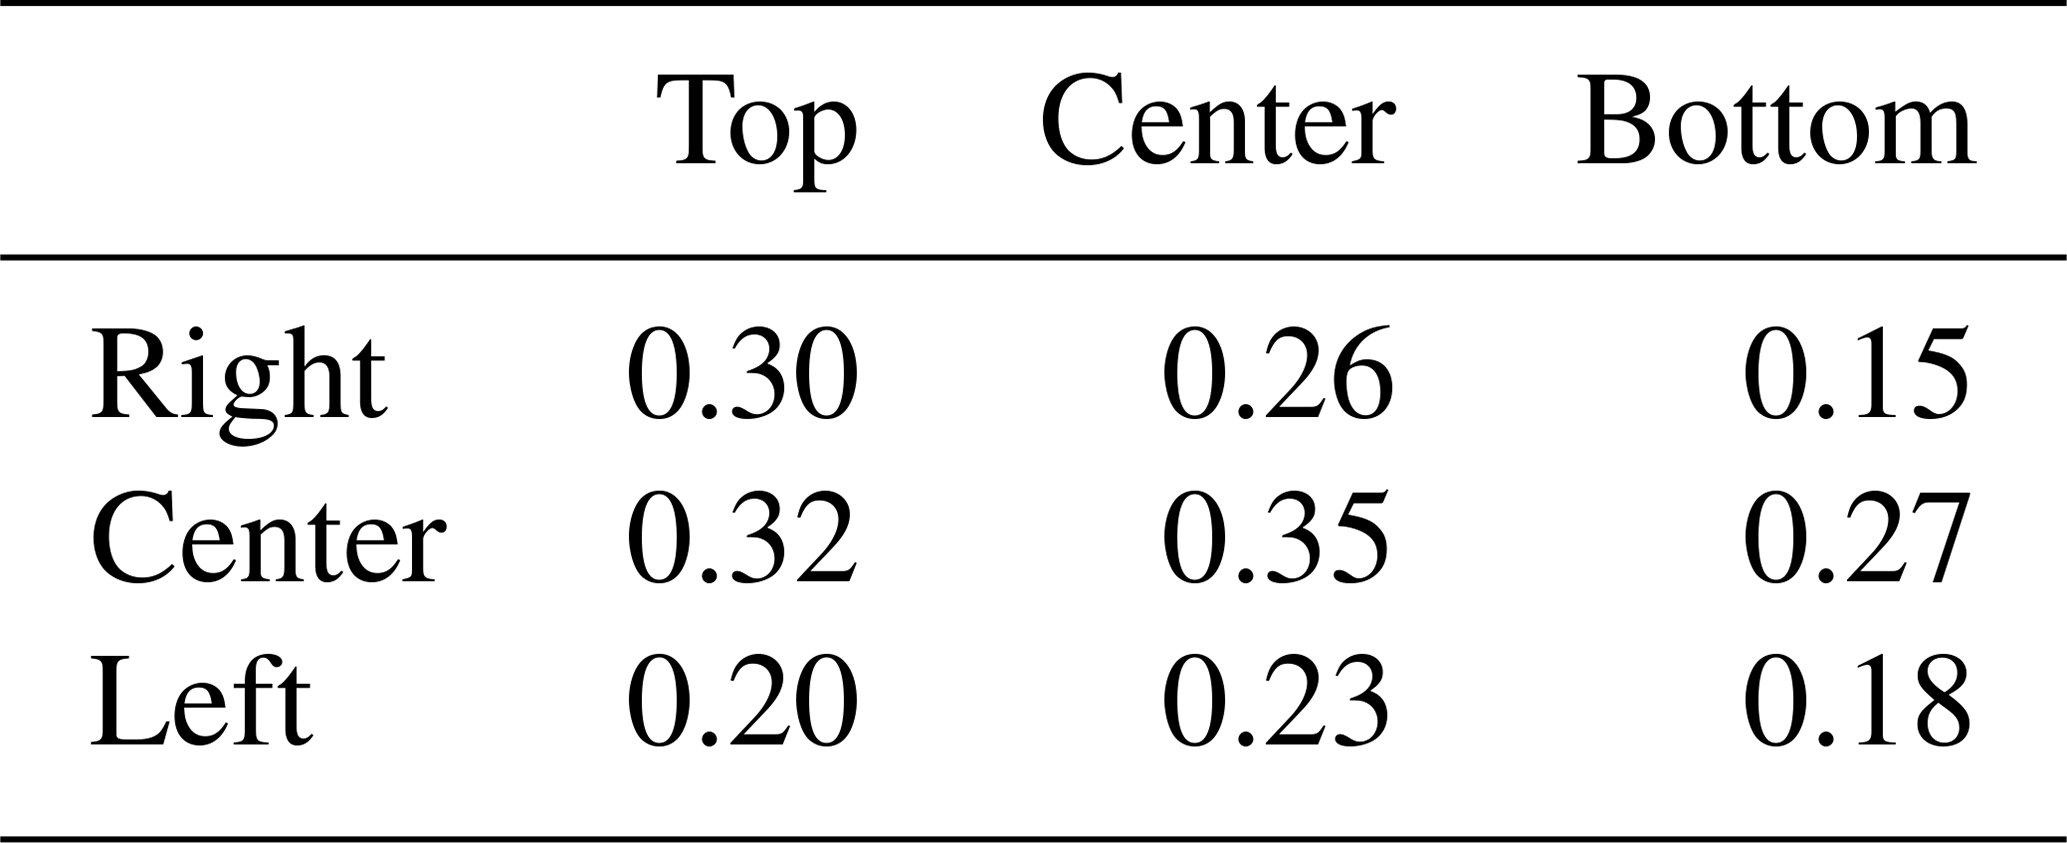
After measuring all nine positions in the incubator the same processing as in Sect. 4.1 is done. Figure 12 shows the result of the measurement at the center-center position. As it can be seen the result is in principal the same as seen with the actuator before. The circle is more noisy, this is on one side conditioned on the change of the radar cross section of the doll while it is “inhaling” and “exhaling”. On the other side the doll itself is doing some sort of a multi-target movement when breathing, so that the legs and head are moving also a little bit. This can be seen as “noise”. Figure 13 shows exemplary the result of the measurements if the dummy is not in the center-center position, here the top-right position. It can be seen that the “noise” is getting more and that the radius is getting less. This is as expected because the received power at the positions outside of the region of interest is of course smaller than in the center-center position, which results in a smaller radius in the complex plane. Table 1 shows the results for all nine positions, with the given radii as a factor of the measured voltage.
Table 1Complex plane radius comparison of all nine dummy positions.
The microwave-based vital sign monitoring system presented in this article has been tested and evaluated. With the actual signal-processing a breathing rate detection from the electromotive actuator and the pneumatic dummy could be realised. It is shown, that the designed antenna structure and its resulting illumination reaches the predefined region of interest on the patient surface of the incubator.
The distance between the radar and target, depending on the position where the target is placed, is crucial for the quality of the breathing rate detection. If the distance or the radar cross section and thus the receiving power are changing too much it is currently necessary to change manually some parameters of the signal-processing. So in a next step, the algorithm will be optimized for a live breathing rate detection without the need of any adoption during the runtime. As a bigger goal in the future the sensor system and its signal-processing should be advanced to also differentiate between chest and abdominal breathing and to monitor the heartbeat.
The data are not publicly accessible. There is not a public repository where the data are located. This data are used for our own signal processing.
AM has developed the data acquisition electronics, executed the measurements and processed the data, DS developed the RF radar electronics and integrated the system in the incubator. ARD leads the project, developed the line-array antennas and specified the design of the radar system as a digital beamforming radar system.
The authors declare that they have no conflict of interest.
This article is part of the special issue “Kleinheubacher Berichte 2018”. It is a result of the Kleinheubacher Tagung 2018, Miltenberg, Germany, 24–26 September 2018.
This project is funded by the Federal Ministry of Education and Research (grant no. 13GW0156G).
This paper was edited by Lars Ole Fichte and reviewed by two anonymous referees.
Droitcour, A. D., Seto, T. B., Park, B., Yamada, S., Vergara, A., Hourani, C. E., Shing, T., Yuen, A., Lubecke, V. M., and Boric-Lubecke, O.: Non-contact respiratory rate measurement validation for hospitalized patients, 2009 Annual International Conference of the IEEE Engineering in Medicine and Biology Society, 3–6 Septemnber 2009, Minneapolis, MN, USA, 4812–4815, https://doi.org/10.1109/IEMBS.2009.5332635, 2009. a
Lin, J. and Li, C.: Complex signal demodulation and random body movement cancellation techniques for non-contact vital sign detection, 2008 IEEE MTT-S International Microwave Symposium Digest, 567–570, https://doi.org/10.1109/MWSYM.2008.4633229, 2008. a
Lin, J. C.: Noninvasive microwave measurement of respiration, P. IEEE, 63, 1530–1530, https://doi.org/10.1109/PROC.1975.9992, 1975. a
Marnach, A., Müller, S., and Diewald, A. R.: A 8-Channel Baseband Data Acquisition Platform For Digital Beamforming Radars, 11th German Microwave Conference (GeMiC), 12–14 March 2018, Freiburg, Germany, 59–62, https://doi.org/10.23919/GEMIC.2018.8335028, 2018. a
Schmiech, D., Müller, S., and Diewald, A. R.: 4-Channel I/Q-Radar System For Vital Sign Monitoring In A Baby Incubator, 19th International Radar Symposium (IRS), 20–22 June 2018, Bonn, Germany, 1–9, https://doi.org/10.23919/IRS.2018.8448163, 2018. a
Will, C., Shi, K., Schellenberger, S., Steigleder, T., Michler, F., Weigel, R., Ostgathe, C., and Koelpin, A.: Local Pulse Wave Detection Using Continuous Wave Radar Systems, IEEE Journal of Electromagnetics, RF and Microwaves in Medicine and Biology, 1, 81–89, https://doi.org/10.1109/JERM.2017.2766567, 2017. a