 | 17 Dec 2021
Method for prediction of EMI Emissions from Automotive Ethernet to Vehicle Antennas
Emanuel Panholzer
Vadim Kobelski
Martin Aidam
Walter Franz
Stefan Lindenmeier
In automotive application new point-to-point (P2P) wideband communication systems e.g. Automotive Ethernet 100BASE-T1 imply an increasing effort in safeguarding its electromagnetic compatibility (EMC). The state-of-the-art EMC safeguarding process proposes a pre-compliant system level test before the vehicle level test, which may have significant variation in test results due to the different electromagnetic environment. This work presents an approach to calculate the emission signal at the vehicle antenna from the ECU output signal given by the power spectral density (PSD) of the Automotive Ethernet ECUs. The determination is performed via a transfer function which describes the coupling between the Ethernet wire harness and the antenna. This approach considers the modelling of the complex vehicle environment by the transfer function which promises the determination of an accurate emission signal before performing the vehicle level test. Further, the transfer function for a specifically EMC critical cable harness routing along the cockpit area is analyzed in more detail with a 3D simulation, which validates the chosen measurement technique of the transfer function.
- Article
(2799 KB) - Full-text XML
- BibTeX
- EndNote


In the automotive industry the demand for high-speed communication links is leading to a trend from classical automotive bus systems to high-speed P2P communication systems (e.g. Automotive Ethernet). According to the CISPR 25 (Comité international spécial des perturbations radioélectriques), these new electronic components in the vehicle need to be safeguarded with regards of EMC, which includes the emission signal towards the vehicle antennas. The wideband communication, as well as the increasing packing density of the electronic components in the vehicle increase the risk of EMC issues. Therefore, the sequential EMC process needs to be optimized, which is equivalent to identifying EMC issues at an early stage of the product development. In the automotive industry two main approaches can be applied in the pre-testing stage of the vehicle level test.
Firstly, empirical approaches can be used. After the development of the ECU (electronic control unit) containing the transmitter which generates the signal at the communication channel which further induced the emission signal at the antenna, system level testing can be performed. Since the EMC environment in the vehicle usually contains different physical coupling mechanisms and is therefore may not be adequately represented by the system-level test, characteristic measurements of the transfer function can be operated in the real vehicle (Zerrer et al., 2004; Zerrer, 2012; Englmaier et al., 1999). These measurements allow a first insight into the complex EMC environment of the vehicle. Furthermore, these transfer functions can be applied in a balanced/symmetrical port configuration in order to EMC-safeguard a communication systems.
Secondly, 3D EMC simulations of the vehicle can be operated even before the initial hardware of the car is available. An overview of the main important numerical methods for a simulation model are summarized and applied e.g. in Weston (2016) and Gheonjian (2015), also analysing complex vehicle structures. For this approach, the separate calculation of the windscreen as a layered material (glass, polyvinyl butyral with the antenna structure, glass) should be mentioned, presented e.g. in Jakobus et al. (2000). A first comparison of a measured and simulated transfer function in the real vehicle is presented in Englmaier et al. (1999). Since the transfer function represents a linear and time-invariant (LTI) system, the corresponding spectrum of the communication system can be used to determine the emission signal at the antenna. For bidirectional P2P communication, the emission signal at the antenna can be determined within a five-port model as follows (Panholzer et al., 2019):
where is the emission signal at the antenna, and , as well as and are the transfer functions for a differential mode (D) and a common mode (C) signal from the master (1) and slave (2) ECU, respectively. Further, , and , are the corresponding differential (D) and common mode (S) signals from the master (1) and slave (2) ECUs. Important to consider are the different impedances from the measurement techniques of the emission signal and transfer function measurements in order to apply Eq. (1). In Panholzer et al. (2020) the in-phase signalling for the differential and common mode signals from one ECU, a 180∘ phase shifts from the master and slave signalling, as well as the block diagram for Eq. (1) has been shown. Based on this research situation, the objective of this work is to determine and verify the transfer function from an unshielded twisted wire pair (TWP) cable harness and the vehicle antenna for the FM-frequency range. This allows to verify the EMC behaviour of a differential communication system at an early development stage, even before the first hardware is available. Furthermore, the emission signal of an Automotive Ethernet 100BASE-T1 ECU in a real vehicle is to be determined and compared with the state-of-the-art EMC safeguarding process via a system-level test. This should provide initial insight into the EMC performance of the ECU, after it has been developed and even before measuring the emission in the real vehicle. The accuracy should be better than the state-of-the-art approach through a system level test. In the first section, the measured and simulated transfer function is discussed.
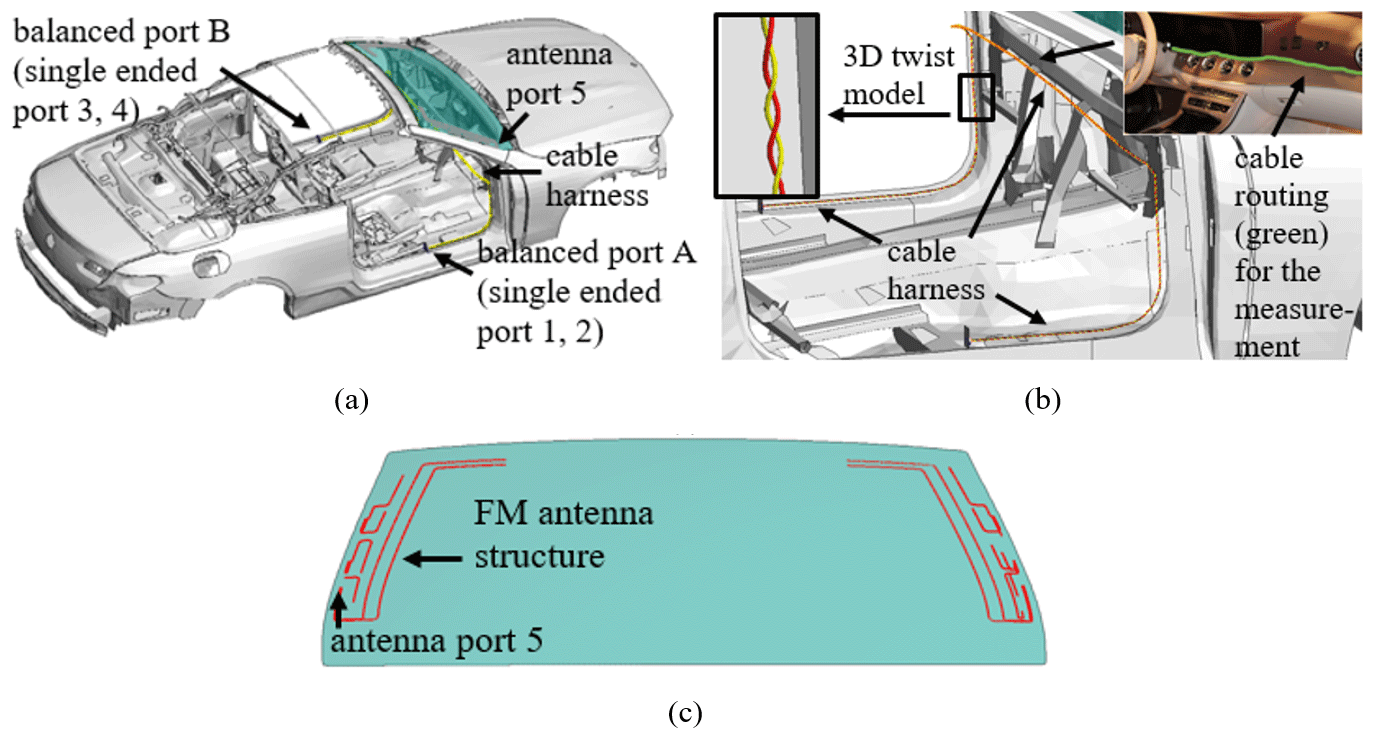
Figure 1Overall vehicle view (a), cable routing of the TP cable at the cockpit (b), front view windscreen antenna structure (c).
In this section the transfer function is explained in more detail. First, a worst-case situation of the EMC behaviour has to be defined. A convertible car is chosen as vehicle, since all the antennas are placed in the windscreen and are therefore considered the worst-case situation in terms of EMC. Furthermore, a realistic cable routing is chosen, which is located in close proximity to the antennas. This is given by a cable routing along the cockpit area. Therefore, a cable routing from the passenger to the driver's footwell area is chosen. The corresponding simulation model (simulation with method of moments; MoM) for this scenario is visualized in Fig. 1. In order to connect the VNA (vector network analyser) to the cable harness, a PCB with two 50 Ω traces is applied to the balanced port A (DUT) and to the balanced port B (Load) (the same PCB as applied in Panholzer et al., 2019), which are shown in Fig. 1a and thus allows the determination of the coupled signal between the wiring harness and the antenna according to magnitude and phase. The cable used is the Leoni Dacar 547-D. This cable type is a jacketed, unshielded twisted pair (TWP) cable, developed for Automotive Ethernet 100-BASE-T1 applications. In the simulation model, the dielectric material parameter of the single wires is used, but the additional sheath around the wires is neglected for this approach, see Fig. 1b. The wire harness has been generated using a helix function with the geometric parameters of the wire harness datasheet. Furthermore, the dielectric coating of the single wires of the twisted wire pair is generated. After meshing the individual wires, the wiring harness is also simulated with the entire vehicle structure using the MoM approach. Small deviations of the twisting geometry of the twisted wire pair do not have a significant influence on a common mode signal, especially in the considered FM frequency range. A suitable way to model the sheath of the wire in the simulation model can be investigated in a further step. Instead of the antenna amplifier a passive adapter is used for the measurement, where the antenna structure can be connected directly to the VNA and the antenna amplifier does not have to be considered. The VNA is connected to the balanced port A (DUT) via two ports and the third port of the VNA is connected to the FM antenna, see Fig. 1c. Generally, a common mode signal on the cable harness causes the emission signal at the antenna. Via the VNA, the common mode signal coupling (C) at the antenna (S) can be calculated immediately by the VNA with the single-ended ports (port 1 and 2) configuration as follows (port configuration according to Fig. 1a):
Furthermore, considering the tight twisting of the cable compared to the distance of the antenna, the coupling of the single-ended ports can be considered identical and thus applies. The comparison of measurement and simulation is shown in Fig. 2 using the parameter . The results for the measured (red) and simulated (black) parameter have a maximum deviation of about 4 dB at 98 MHz. The deviation may be caused by neglecting the sheathing of the wire, which is made of a dielectric material. Nevertheless, the simulated transfer function gives a first insight into the EMC-critical cockpit cable routing due to the quite good correlation between simulation and measurement. In Fig. 2, also a section of a Smith Chart of the simulated transfer function is also inserted, to check the physical coupling mechanism of the transfer function. Three markers visualise the beginning and the end of the FM frequency range (M1-76 MHz and M3-108 MHz), as well as the resonant frequency with the highest magnitude of the transfer function at 86 MHz (M2). As shown, the resonant frequency (M2) is in the lower half of the Smith Chart, indicating capacitive coupling behaviour for the transfer function at this frequency. The electrical field created by the charges on the wiring harness thus causes the emission signal at the antenna. The analytical description of the transfer function of the complex conductor arrangement is very difficult and can therefore only be solved via the simulation model. In general, a voltage between two wire segments, assuming a TEM wave between the wires, can be described according to Clayton (2008) by:
Herein the path integral (C) between the line charges of the separated conductors from needs to be calculated from the transverse electric field Et. Since this basic equation is difficult to solve for this complex cable routing, the simulated charge distribution on the wires and the antenna structure is visualized in Fig. 3 to get a first understanding of the wire coupling. The line charge distribution is also shown for the three frequencies also marked in Fig. 2 (76, 86 and 108 MHz). The charge distribution is chosen because nearfield coupling mechanisms are considered for the FM frequency range, since the antenna and the wire harness have a short distance of about 30 cm compared to the wavelength and thus the mutual inductance and mutual capacitance can be considered separately. Furthermore, the Smith Chart in Fig. 2 with a negative imaginary part for the marker M2 shows the strongest coupling as a capacitive coupling mechanism and therefore originating from the charges at the wire harness.
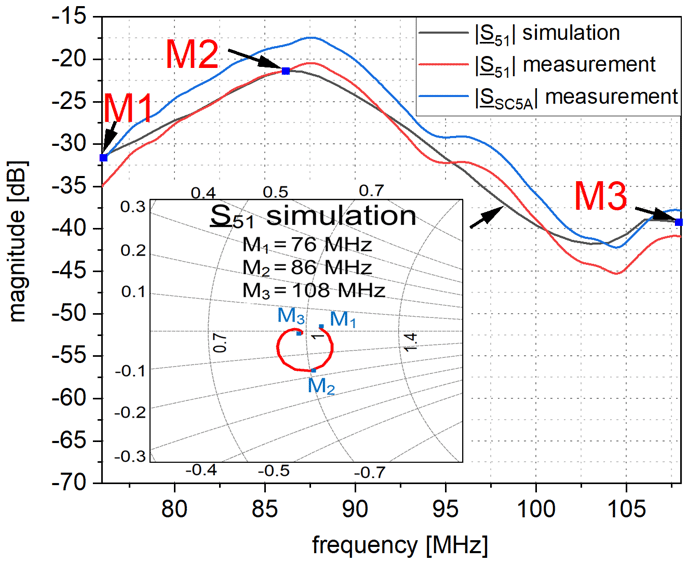
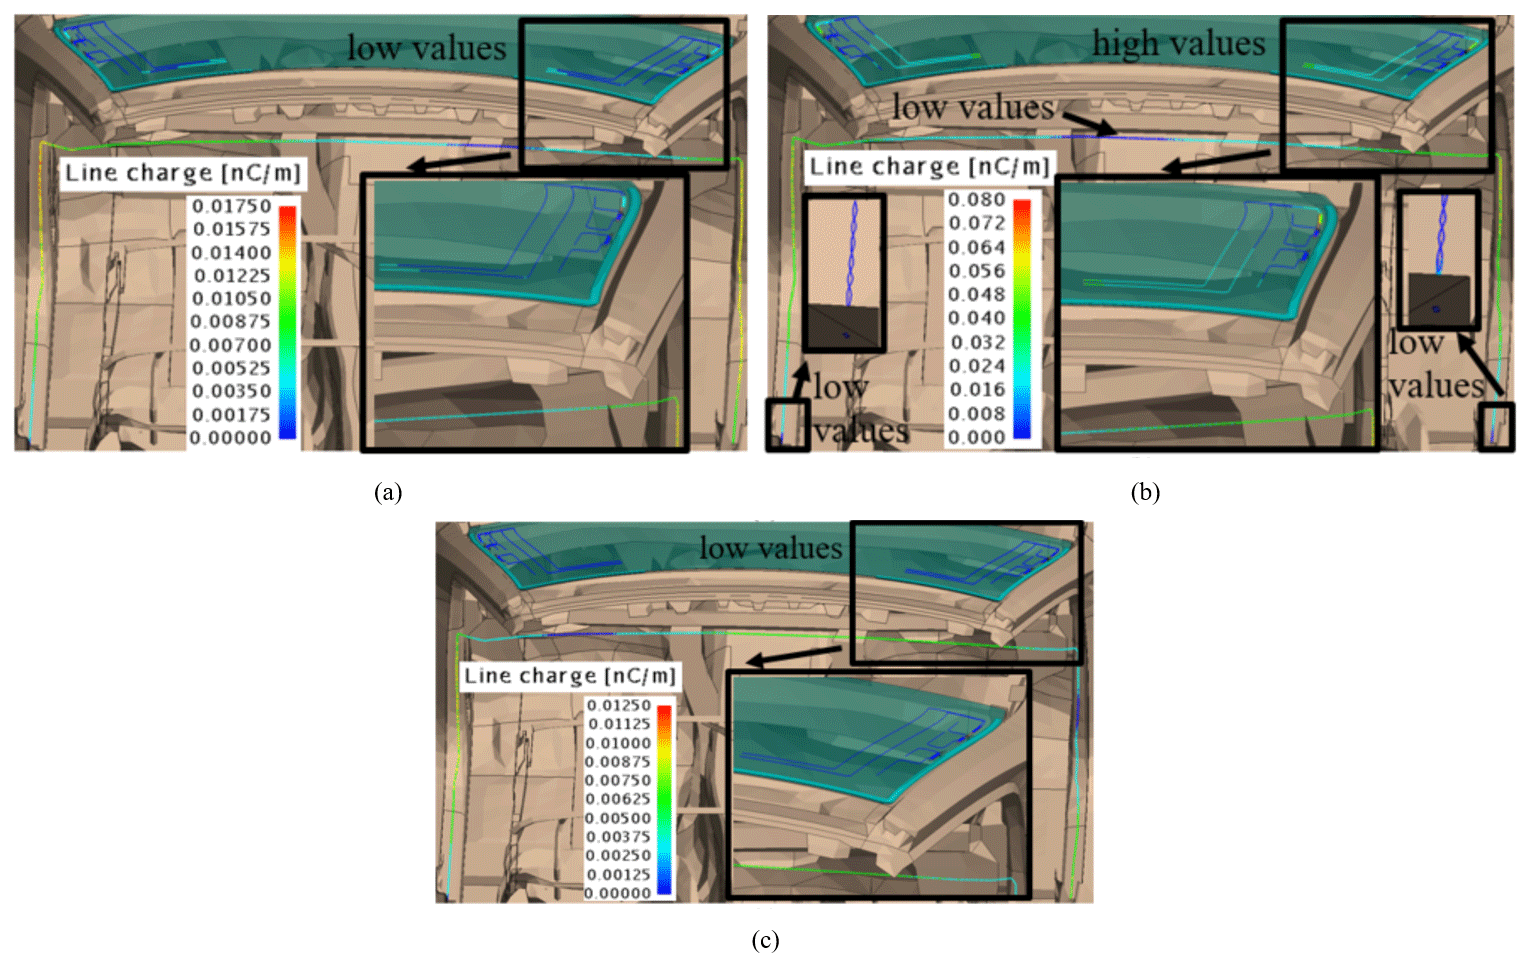
Figure 3Top view current on the wire and antenna for 76 MHz (a), 86 MHz (b) and 108 MHz (c) with the corresponding scaling.
At 86 MHz (b) the highest values for the charge distribution are obtained. The high charge distribution on the wire harness also leads to a high charge distribution on the antenna structure and thus to a high emission signal. For this resonance frequency, the boundary conditions can be observed at the position of the DUT and load. Here, a low charge distribution can be observed at the connection points, as well as at the middle of the 3.5 m long wire harness. This results from the 50 Ω ports of the VNA, which have a low impedance compared to the characteristic impedance of the wire harness with reference to the chassis, with a minimum distance of 2 cm. This statement has been verified with a measurement via a Time Domain Reflectometer (TDR), but will not be discussed further in this contribution. The wavelength of the resonance frequency and thus the maximum of the transfer function at 86 MHz can be calculated via
where c is the speed of light, resulting in a wavelength of about 3.5 m. The wavelength at this frequency is therefore equal to the mechanical length of the wire harness, which explains the low charge distribution at the DUT/load connection and in the centre of the wire harness. In pictures a and c of Fig. 3, the shift of the low charge distribution from the centre position to the passenger and driver side can be observed. Also, a low charge distribution at the antenna structure and thus a low emission signal can be seen for images a and c compared to the image b. After this brief discussion of the transfer function, the emission behaviour from the Ethernet ECU will now be determined based on the transfer function and the input signal. This will be done in the next section.
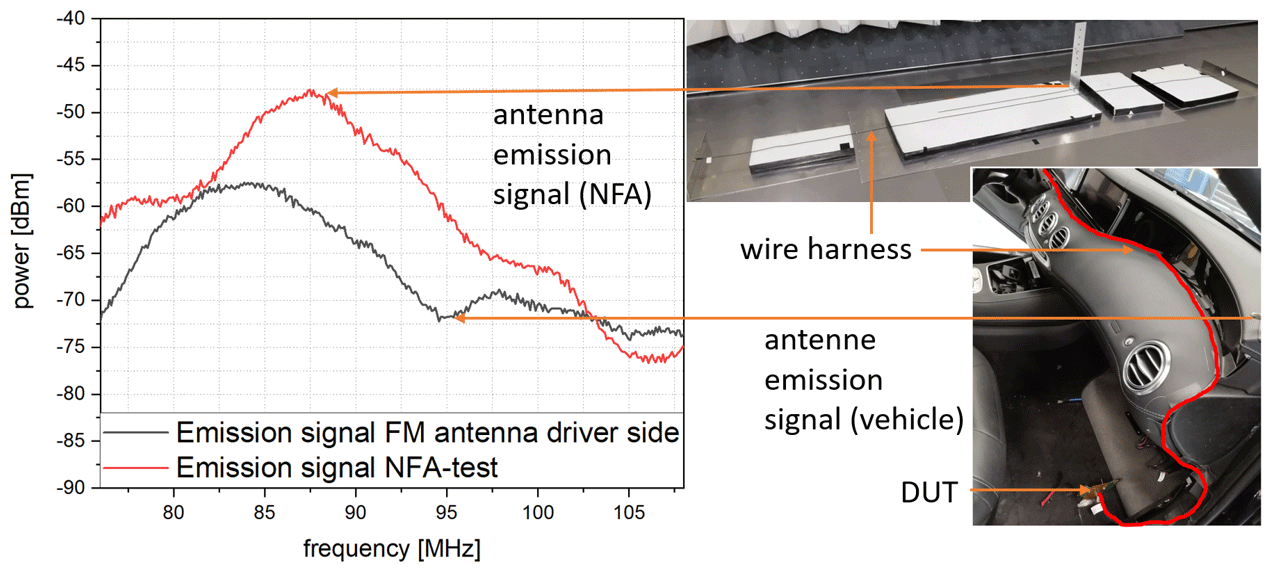
In this section, the emission signal of the 100BASE-T1 Ethernet ECU shall be determined via Eq. (1), where the emission signal is determined by the transfer function and the corresponding input signals. As described, this approach should be more promising than the in-vehicle measurement compared to the state-of-the-art EMC safeguarding by a system-level test. In the next figure, the emission signal from a nearfield antenna (NFA) test setup presented in Panholzer et al. (2019) is compared with the emission signal at the FM-antenna from the vehicle. The measurement results are shown in Fig. 4. The NFA test setup has been realised with a cable harness length of 3.5 m, an antenna length of 1 m and a distance between the wire harness and the antenna of 5 cm. The figure shows a maximum deviation from the emission signal at system level compared to the emission signal in the vehicle of 13 dB at a frequency of the 87 MHz. This can lead to unnecessary optimisation from the ECU's after the system level test. This measured deviation shall now be compared with the calculated emission by the input signal and the transfer function, which is the main content of this contribution. In this work, one control unit is considered first, whereby only the master ECU has to be considered for the calculation via Eq. (1). Furthermore, two ECU's are considered for the full duplex, bidirectional signal transmission, according to Eq. (1), of the communication signal. For this purpose, the transfer function of the differential mode () and common mode () signals from the balanced port A to the single ended port 5 at the antenna, with the corresponding input signals and needs to be considered. First, the power spectral density (PSD) of the input signals is measured via a balun (DM) and power splitter (CM). The results are shown in Fig. 5. For the measurement, the testmode 5 is activated, where a pseudo random bit sequence is transmitted from the master ECU. Since the ECU has a good design in terms of EMC, the low pass filter is removed from the signal traces. This results in a more realistic signalling by the ECU compared to an ECU in serial production. The signal spectrum of the Ethernet 100BASE-T1 system has a main lobe up to a frequency of 66.66 MHz. Therefore, the first side lobe covers the range from 66.66 up to 133.32 MHz, causing an emission signal at the FM-antenna structure. Since the communication system is based on DM signalling, the DM signal has a significantly higher power compared to the CM signal. A small amount of a CM signal is also introduced through the peripheral components on the PCB. In order to generate a higher common mode signal, a 7 mm long asymmetry is inserted into a trace of the signal pins from the master ECU. This can be seen in the higher CM signal for the master ECU compared to the slave ECU. The block diagrams of the signal measurements are also inserted in Fig. 5. After the determining the input signals, the transfer functions are considered. The measurement is set up according to the port configuration in Fig. 1a. The balanced port B is terminated with two times 50 Ω, while a common/differential mode signal is considered at the balanced port A and the signal at the single ended port 5 (antenna) is determined. The 50 Ω terminations are then removed and the transfer function and (while the slave ECU is connected to the load), and and (while the master ECU is connected to the DUT) are measured. Figure 6 shows the measurement results of the transfer functions and the windscreen antennas.
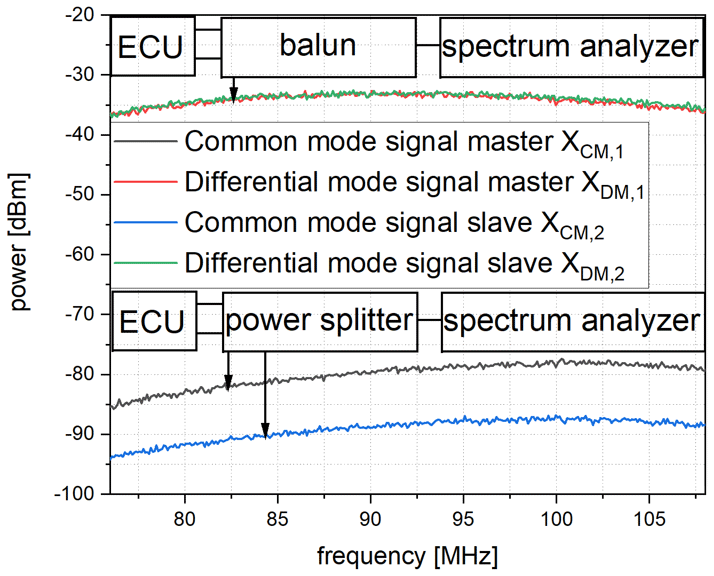
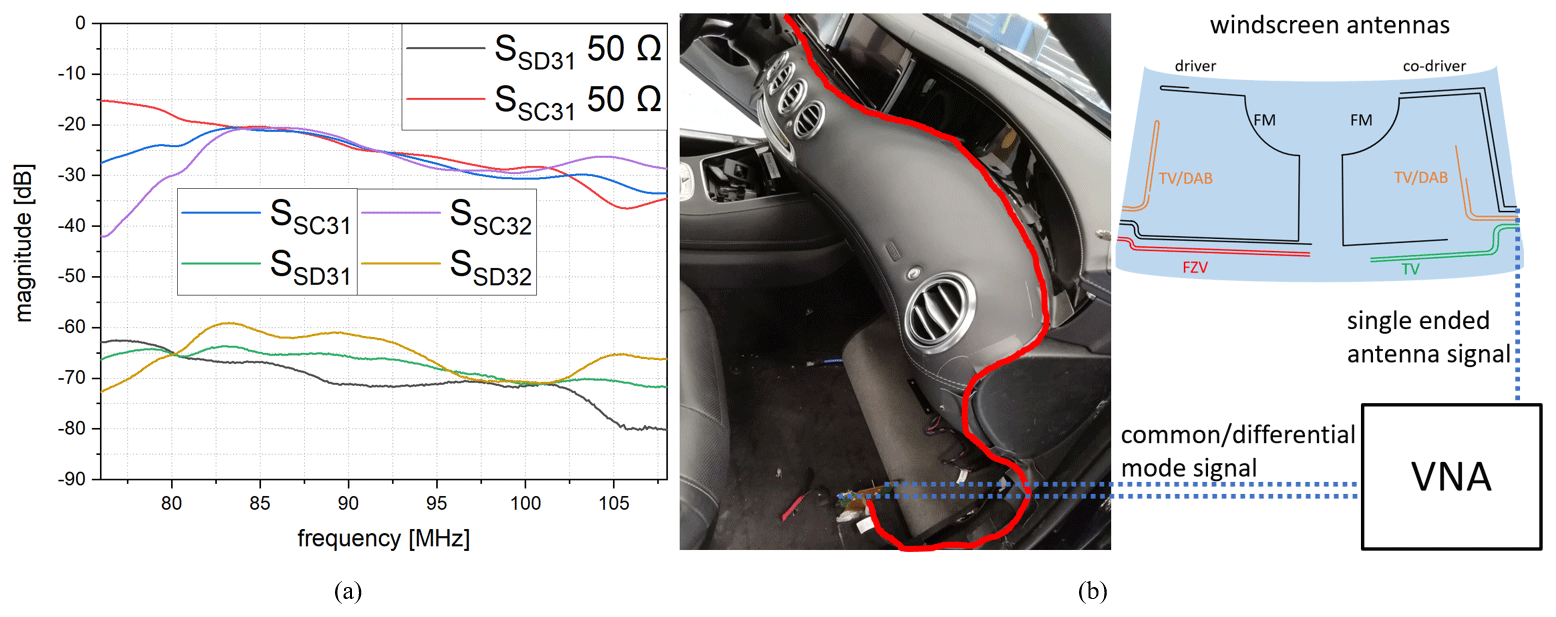
Figure 6Transfer function for a common and differential mode signal (a) and test setup with windscreen antenna structure for the s-class car (b).
The transfer functions of a CM signal have a significantly higher transfer value in magnitude compared to the DM transfer functions. This can be attributed to the use of a twisted wire pair. For the DM transfer functions, the mode conversion can be considered the main cause of the induced signal at the antenna. Here a DM signal is fed into the balanced port A. Due to asymmetries in the communication channel, a small part of the DM signal is converted into a CM signal. This CM signal introduces the emission signal to the antenna. It has to be mentioned that the comparison between the simulation and the measurement in the second section is carried out with an e-class vehicle model, which leads to the different transfer functions in Figs. 2 and 6. In this section, the vehicle is changed to a vehicle from an s-class car model with different windscreen antennas. The reason for the vehicle change is simply the availability of the CAD and simulation model for the e-class car and the modification of the s-class car for fast EMC measurements with ground connection in the driver and passenger footwell areas. In Fig. 6, the lower diagram (b) shows the antenna setup for the s-class car. With the signal and the transfer function measurement, the emission at the antenna is calculated for an active ECU (master) according to Eq. (1). The result is compared with the measured emission at the antenna, which is shown in Fig. 7. For the emission and transfer function measurement, the load on the driver side was terminated with two times 50 Ω. Comparing the calculated and measured emission, there is a maximum deviation of about 6 dB for a frequency of 100 MHz is present, which already shows a quite good agreement for the calculated and measured emission signal. This deviation can be attributed to the different impedances of the ECU compared to the VNA. The transfer function is determined with the 50 Ω ports of the VNA, while for the emission measurement the ECU is connected at the balanced port A, which has a different, frequency dependent impedance. Furthermore, the ECU is placed in a shielding box during the emission measurement to avoid interferences from the ECU's power electronics and thus only the communication signal is considered. When measuring the transfer functions, no shielding box has been used for the adapter PCB, as no power electronics there are used on this board. This shielding box also leads to small influences on the transfer functions and needs to be considered if a more accurate correlation between the emission measurement and the measurement of the transfer function is desired.
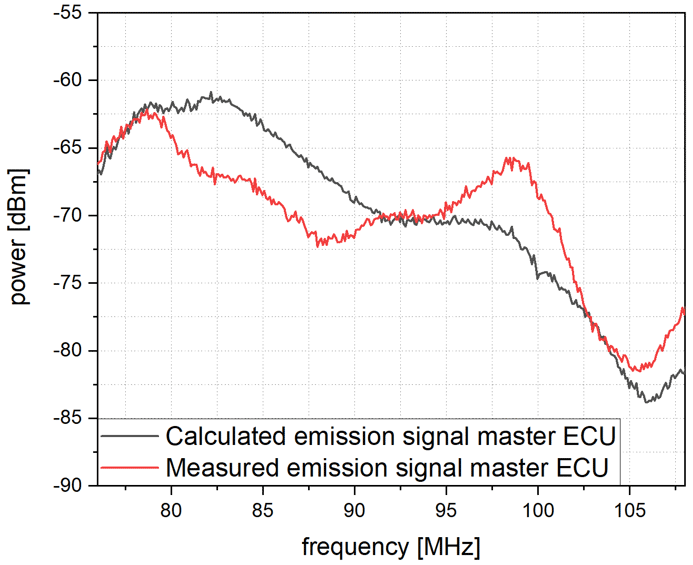
Figure 7Comparison of the measured and calculated emission for a unidirectional communication.
After the approach for unidirectional communication has been applied, bidirectional communication will also be considered. For this purpose, the second ECU is connected to the load position and a communication link is established. The emission signal calculated via Eq. (1) and the measured emission is visualised in the following Fig. 8. A quite good correlation of the measured and calculated emission can be observed with a maximum deviation of 6 dB for the lower (76 MHz) and upper (105 MHz) frequencies. Therefore, this approach allows a very good first insight into the emission behaviour of the ECU, which is more promising than the state-of-the-art EMC safeguarding with 13 dB deviation from Fig. 4. This approach has been additionally performed for the second FM-frequency antenna on the passenger side to verify the approach on a second example, which will not be discussed in detail in this contribution. Nevertheless, the comparison of the approach by safeguarding the communication system with the conventional approach with a system-level test setup resulted in a maximum deviation between the system-level and the vehicle level emission measurement of 20 dB. With the presented approach from this contribution, where the emission signal is calculated by the transfer function and the input signal, a maximum deviation of 7 dB has been achieved for a bidirectional, full duplex communication. Thus, with this emission prediction approach, even a higher improvement of 13 dB could be achieved compared to the conventional EMC safeguarding method.
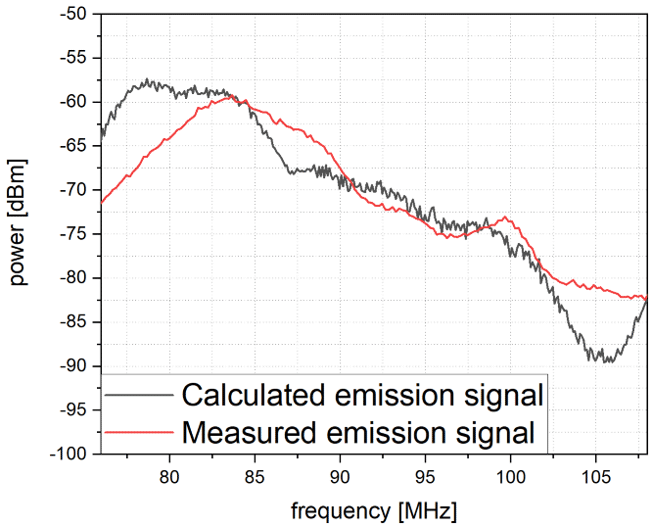
Figure 8Comparison of the measured and calculated emission for a bidirectional communication.
In this work a way is shown for the determination of a transfer function describing EM emissions from twisted wire pairs to antennas in vehicles. The transfer function is determined by simulation and measurement with a maximum deviation of 4 dB, which allows the usage of the simulation result for a first evaluation of the cable routing. Investigations for a better correlation can be operated by considering a sheathing of the wire harness in the simulation model. The transfer function is further discussed with the current distribution on the wire. In addition, the transfer functions and the corresponding ECU signals are used to calculate the emission signal at the antenna. The results are compared with the measured emission. To evaluate the new approach, its results are compared with the results of the system-level in terms of its deviations from the results of the real vehicle test, which represents the state-of-the-art EMC safeguarding process of electrical components in the vehicle. While the maximum deviation of 13 dB could be observed via this state-of-the-art approach, a maximum deviation of about 7 dB is achieved with the approach of this paper. Thus, this approach can significantly improve the EMC safeguarding for both unidirectional and bidirectional communication of the ECU's.
Due to company internal confidentiality agreements, the source code is not freely accessible. However, we will be happy to provide the details required for this publication on request.
Due to company internal confidentiality agreements, the data is not freely accessible. However, we will be happy to provide the details required for this publication on request.
EP extended the provided simulation model (provided by VK) consisting of the vehicle and the model of the antennas in the windscreen by the wiring harness and carried out small extensions and adaptations of the model (e.g. connection terminals of the measuring device) to the real measurement setup. After the calculation by the simulation, the corresponding test setups in the vehicles has been generated and carried out by EP. All listed authors approved the manuscript.
The authors declare that they have no conflict of interest.
Publisher's note: Copernicus Publications remains neutral with regard to jurisdictional claims in published maps and institutional affiliations.
This article is part of the special issue “Kleinheubacher Berichte 2020”.
The authors would like to thank the U. R. S. I. Kleinheubacher Conference for the opportunity to publish this paper in the open-access journal Advances in Radio Science.
This paper was edited by Romanus Dyczij-Edlinger and reviewed by two anonymous referees.
Clayton, C. R.: Analysis of Multiconductor Transmission Lines, 2nd edn., John Wiley & Sons Inc., New Jersey, USA, 2008.
Englmaier, A., Scholl, B., Weigel, R., and Russer, P.: EMC Modelling Strategy for Automotive Applications, in 29th European Microwave Conference, Munich, 5–7 October 1999, vol. 2, 317–320, https://doi.org/10.1109/EUMA.1999.338364, 1999.
Gheonjian, A.: Investigation of Broadband EMC Problems related to Antennas and Cables using advanced computational Techniques, Doctroal Thesis, Ivane Javakhishvili Tbilisi State University, Faculty of Exact and Natural Sciences, Tbilisi, Georgia, available at: https://mail1.tsu.ge/data/file_db/faculty_zust_sabunebismetk/geonjiani ana.pdf (last access: 26 January 2021), 2015.
Jakobus, U., Berger, N., and Landsdorfer, F. M.: Efficient techniques for modelling integrated windscreen antennas within the method of moments, Millennium Conf. Antenna Propag. AP-2000, Davos, Switzerland, 9–14 April 2000, European Space Agency, Noordwijk, the Netherlands, 2000.
Panholzer, E., Aidam, M., Franz, W., Senega, S., and Lindenmeier, S.: Introduction of a near field component level test and application to an automotive communication system, EMC Europe, Barcelona, 2–6 September 2019, 592–597, https://doi.org/10.1109/EMCEurope.2019.8872090, 2019.
Panholzer, E., Aidam, M., Franz, W., and Lindenmeier, S.: Phase relation for the signaling from an Automotive Ethernet 100BASE-T1 communication system, Automotive meets Electronics, Dortmund, 10–11 March 2020, VDE VERLAG GMBH Berlin/Offenbach, ISBN 978-3-8007-5202-7, 2020.
Weston, D.: Electromagnetic Compatibility: Methods, Analysis, Circuits, and Measurement, Third Edn., CRC Press, Merrickville, Ontario, Canada, 2016.
Zerrer, M.: Bewertung der elektromagnetischen Verträglichkeit von Einbauorten für Steuergeräte in Kraftfahrzeugen mit Hilfe von Transferfunktionen, PhD thesis, University of Stuttgart, Germany, Sierke Verlag, 2012.
Zerrer, M., Feser, K., Koehler, W., and Aidam, M.: Vergleichbarkeit verschiedener Emissionsverfahren in der Automobil EMV, in: EMV Duesseldorf, VDE, available at: https://www.ieh.uni-stuttgart.de/dokumente/publikationen/2006_EMV2006-Zerrer.pdf (last access: 17 January 2021), 2004.