 | 17 Dec 2021
Performance analysis of 300 GHz backhaul links using historic weather data
According to the recently published IEEE standard 802.15.3d (2017), THz links operating at 300 GHz are viable to achieve more than 100 Gbit s−1 of data rate. This feature can support a transition of the future backhaul connectivity from the underground fibre connection to the wireless, where fibre links are not available or too costly to install. The EU-Japan Horizon 2020 project “ThoR” is working towards the demonstration of such links. A detailed investigation on the influence of weather conditions will help to derive planning guidelines of 300 GHz backhaul links for forthcoming applications. This paper focuses on the dependency of the THz link on the general weather by using ray-tracing simulation. Simulation is conducted combining ITU-R propagation models for atmospheric attenuation (water vapour and oxygen content of air, droplets of rains, liquid content of clouds or fog), a wind-depending swaying model for the antenna poles, and historical measured climate data for the deployment scenarios considered in the ThoR project. As a result, this research will show the feasibility of THz link in outdoor applications under general weather conditions, defines weather-dependent outage probabilities, and allows us to derive planning guidelines of THz links at a frequency of 300 GHz.
- Article
(1518 KB) - Full-text XML
- BibTeX
- EndNote


The number of end-user devices, as well as the consumption of data, grew continuously and this trend is expected to accelerate further. Therefore in 5G, the number of connected devices is foreseen to increase to more than 1 Million per km2 based on Thales group (2018) and thus, the demand of required data is expected to reach 226 exabyte per month by 2026 according to Ericsson (2020). Also, the pattern of data consumption turned into the volume critical services such as video streaming, holograms, augmented reality and virtual reality. Both reasons have led to the necessity of the denser deployed mobile network, namely small cells. Every small cell must possess a communication channel towards the core (backbone) network. This communication channel is known as “backhaul link” and requires a transmission capacity of tens of Gbit s−1.
Various approaches to ensure backhaul connections are presented in GSM Association (2018). So far, the most common and widely used method to provide links is using fibre connections, which provide stable channel states as well as high channel qualities. However, providing backhaul connection via fibre requires in general more man's labour, longer setup times, higher capital expense (CAPEX) as well as higher operating expense (OPEX) compared with wireless backhaul connections. Hence, there has been increasing interest and research on the wireless backhaul connection using different frequency bands: Microwave, V-Band (60 GHz) and E-Band (70/80 GHz). However, interlinking backhaul links via wireless channel using those frequency bands would not be sufficient enough to fulfil the high demand of aggregated transmission data, which is foreseen in the forthcoming generation of mobile technology. In this sense, sub-THz frequencies, especially 300 GHz, seem to be suitable for connecting wireless backhaul links due to their larger available bandwidth and thus can achieve a high data transmission capacity.
According to the recently published IEEE Std 802.15.3d (2017), a high data transmission above 100 Gbit s−1 is feasible at 300 GHz frequency spectrum range. The Horizon 2020 EU-Japan joint-project “ThoR” is aiming to demonstrate the feasibility and scalability of such wireless links. The recent publications as well as the details of the researches related to the project are accessible online at ThoR website (2021).
The usage of wireless backhaul links operating at 300 GHz is one of the most promising approaches to bring benefits in highly dynamic heterogeneous mobile networks, nonetheless some challenges need to be overcome. One of the leading issues is the influence of the climate condition on wave propagation at sub-THz frequency range. In these frequency bands, the impact of rain, humidity and fog on wave propagation becomes significant and thus, it should be integrated into the propagation channel. Another critical issue arises from the high free space path loss (FSPL) at the 300 GHz frequency around 122 dB over the distance of 100 m. Therefore, it is thus inevitable to use high gain antenna in the order of even 50 dBi to compensate for the high FSPL. However, the higher antenna gain is, the main lobe of the antenna becomes narrower. This fact emphasises thus the importance of antenna alignment. Misaligned antennas cause a significant drop in the channel gain and therefore even a slight deviation of antenna positions are critical. Unfortunately, due to the wind, the pointing vector of antennas can variate and this creates thus the partially non-negligible misalignment angles.
For this reason, the importance of the research of weather impact on the THz link including humidity, rain, fog and wind is being specially recognized to provide reliable mobile communication.
This paper will focus on the impact of atmospheric weather conditions on the THz backhaul links. However, the explicit measurement data of liquid water content of clouds or fogs are unfortunately not provided by the CDC. Therefore, the impact of the liquid quantity of clouds or fogs is not covered in this paper and thus assumed to be zero. The remaining paper is structured as follows. Section 2 remarks simulation requirements including a propagation model, simulation scenarios and weather data. In Sect. 3, two types of simulation results are presented. Conclusions and future work are given in Sect. 4.
Software simulations can provide a first assessment of the weather condition's impact on the propagating signal's performance and identify possible critical conditions. Thus, the entire system can be designed and developed to mitigate counter predictable effects, which is maximizing the system performance and efficiency. For this, realistic modelling of the weather conditions is vital. The atmospheric parameters and corresponding models are described in this section. So, the software simulations give us a brief overview of the system performance.
2.1 Channel modelling of 300 GHz propagation
Although each of the design steps of the entire system is important to achieve a comprehensive performance and a successful operation, channel modelling is regarded as one of the cornerstones of the system design and thus to be done thoroughly. In general, wave propagation at 300 GHz is reacting more sensitive to the external factors (e.g., water molecule in the air) than the commercialized ultrahigh frequency (UHF) bands for the mobile communication. Due to its considerable attribute on the power density loss of the propagating signal, Fricke et al. (2016) suggests to include at least the following three additional atmospheric factors in the propagation channel model for 300 GHz:
-
Water vapour and oxygen content of air
-
Droplets of rains
-
Liquid content of clouds or fogs
International telecommunication union (ITU) has recommended mathematical equations for each of the given factors.
First of all, the gaseous attenuation caused by oxygen and water content of air is mathematically modelled in ITU-R P.676-12 (2019). The corresponding attenuation can be specifically predicted through the line-by-line calculation of individual spectral lines of oxygen and water vapour using air pressure, temperature and absolute humidity as input variables.
ITU-R P.838-3 (2005) provides the prediction method for the specific attenuation caused by rain. For predicting the specific attenuation, rain rate is considered using a power-law relationship together with frequency-dependent coefficients.
The additional attenuation can be further occurred by liquid content in clouds or fogs. The mathematical model of the additional attenuation caused by clouds or fogs is given in ITU-R P.840-8 (2019). It is based on the Rayleigh scattering of small droplets inside of the clouds or fogs and thus requires the absolute value of the total liquid content of clouds or fogs.
Friis transmission equation is one of the most fundamental formulas in the antenna theory field. A formula of the FSPL can be derived from the Friis equation and it is
Equation (1) shows that there is a directly proportional relationship between the path loss and the square of the frequency.
As it is denoted previously, using a high gain antenna is mandatory wireless to communicate at the high frequency bands. Aligning the main lobes of antennas plays therefore crucial role in the high gain antenna essential communication since the half power beam width (HPBW) is narrow enough to lose the power massively, for example, 0.5∘ of theoretical HPBW in the case of 50 dBi gain antenna.
Many causes are inducing the misalignment of antennas but the most prominent related to the tropospheric weather conditions is wind. Unless it is a rigid body, substances are deformed while external forces are applied. Generally, antennas consist of the antenna dish and the antenna pole. The antenna dish is mounted on the antenna poles made of metal. Even if the antenna dish and the antenna pole are firmly held, the antenna pole itself can sway due to the wind load and thus induce misalignment of the antenna pair.
Research on the relationship between the angle shift of the antenna and the wind load is suggested in AWG-25/TMP-10 (2019) and Kürner et al. (2020). The research shows that the degradation angle of the antenna can be mathematically modelled based on the wind speed. By applying quaternions in the 3-D rotation, the change of the antenna positions, as well as the pointing vectors, can be tracked, which is originated from the wind load. Therefore, the computation of power loss due to the misalignment can be facilitated.
To account for the power degradation of signal triggered by climate conditions, the path loss for 300 GHz transmission can be formulated like an equation below
where d refers to the distance in the unit of kilometre (km) and f refers to the frequency in the unit of gigahertz (GHz). Each of γat, γr and γcl indicate additional attenuation elements caused by water vapour and oxygen content in the air, rain and cloud or fog, respectively. The factor of γw refers to the power degradation of a signal caused by antenna misalignment.
2.2 Simulation scenarios
In this paper, two types of simulation scenarios are considered: a point-to-point link and an automatically planned wireless backhual network, respectively. The point-to-point link refers to the simulation of a single THz link, which is used for cell outage probability. The automatically planned wireless backhaul network is used for signal-to-interference-plus-noise ratio (SINR) comparison and it represents the entire backhaul network, which is automatically planned using an in-house developed planning tool. For the latter simulation, Hanover scenario defined in ThoR D2.4 (2019) is applied. It represents the ultra-densification scenario of the high population density for the urban area in which the main train station, residential area, industrial area and commercial promenade co-exist. Thus, this area can reflect the increasing demand of mobile data traffic well.
The point-to-point simulation scenario is designed in such a way that two antennas are assumed and positioned at 1 m high above buildings with 1 km link distance. In this simulation scenario, the effect of multi-paths between TX and RX are not counted. This means, only the line-of-sight (LOS) signal is considered. In contrast, the 1st order of reflection from the external wall of the buildings and ground is considered for the simulation of the automatically planned wireless backhaul network. Here, we have assumed an extreme deployment of small cells such as pico- and femtocells with the density of 300 cells per km2 and positioned antennas 1 m high above the rooftop of buildings.
Since both scenarios are considered in the Hanover area, the further paper focuses on the designated Hanover area and thus the corresponding weather data has been collected from the climate station located in Hanover. The open-source weather data is provided online at German weather service (2021).
2.3 Historic weather data
As highlighted in the Eq. (2), the weather conditions have a significant influence on the transmission channel, specifically on the energy loss of wave propagation. Hence accurate weather data let us approach more realistic predictions of the path loss and thus can help to guarantee the stable operating performance of the entire system. To compute the additional attenuations triggered by weather conditions described in Eq. (2), the following data is required.
-
Absolute humidity
-
Temperature
-
Pressure
-
Rain rate
-
Liquid water content of clouds or fogs
-
Wind speed
-
Wind direction
The climate data centre (CDC) of German weather service (DWD) provides extensive weather measurement data from around 400 climates stations over Germany in cooperation with equivalent partner climate stations. The measured weather data is chronologically classified by various time resolutions respectively 10 min, 1 h, 1 d and a month. The simulation is conducted to see general mid-term weather influences on THz channels therefore it does not reflect the real-time short-term weather changes. From them, the weather data with an hourly resolution is applied in the simulations.
The common time period of the available data used for the simulation is from 1 September 1995 to 30 November 2020. Some of time-slots of measurement data are not fully provided due to the reliability issues and therefore totally 220 099 time-slots over 302 months are taken into account for the further simulations.
2.3.1 Humidity
The water content in the air is one of the factors required to compute the gaseous attenuation (γAtmospheric) and shown in Fig. 1. The value of humidity represents the mean value over 1 min at a certain time stamp of hour.
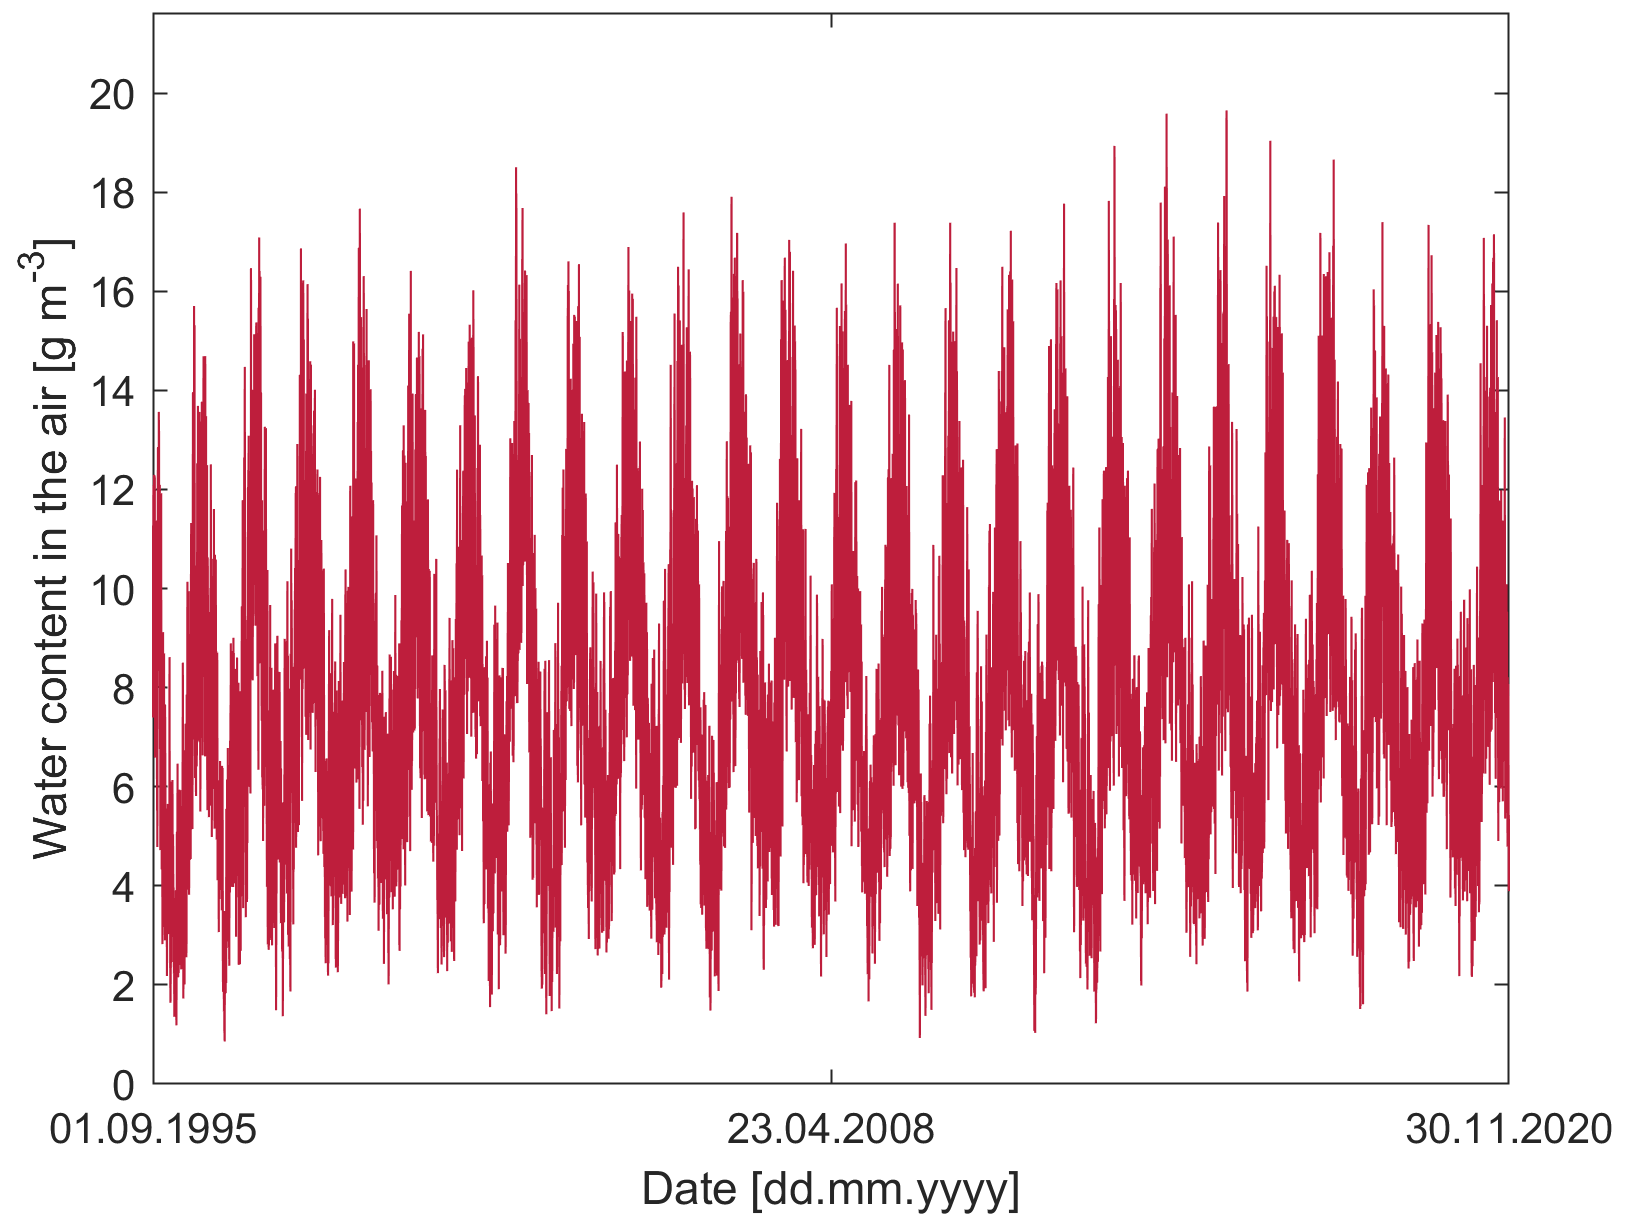
Since the CDC doest not directly provide water content in the air, but only the relative humidity, a conversion of relative humidity to the absolute humidity in the unit of g m−3 is a required preparatory work. The relative humidity has a directly proportional relationship with the vapour pressure of the air and a inversely proportional relationship to the saturated vapour pressure. This conversion can be done using the following equation
where hr refers to the relative humidity an percentage. The parameter ea refers to the vapour pressure of the air while es refers to the saturated vapour pressure. The saturated vapour pressure is dependent on the temperature therefore Ta indicates the temperature of the air. Here the term ea is positively correlated with the water content in the air. To derive ea, the term es(Ta) should be determined first. Here, es(Ta) can be calculated by using of Tetens equation in Tetens (1930) and it is
es(Ta) in Eq. (4) is in units of kPa. The constant b amounts 17.502 and the constant c amounts 240.97 while T refers to temperature in the unit of Celsius.
Equation (5) describes the relationship between the water content in the air (Pv) and the vapour pressure of air (ea). where Mw refers to the molecular weight of water, respectively 18.02 g mol−1 while R refers to the universal gas constant and amounts 8.31 J mol−1 K−1. Hereby Ta indicates the temperature in the degree of Celsius.
Thus the historical value of water content in the air is converted from the measured value of the relative humidity. The water content in the air tends to follow the temperature since the saturated quantity of water content in the air shows a positive relationship with the temperature. Here, the minimum value of water content in the air amounts to 0.858 g m−3 over the given period while the maximum value amounts to 19.65 g m−3.
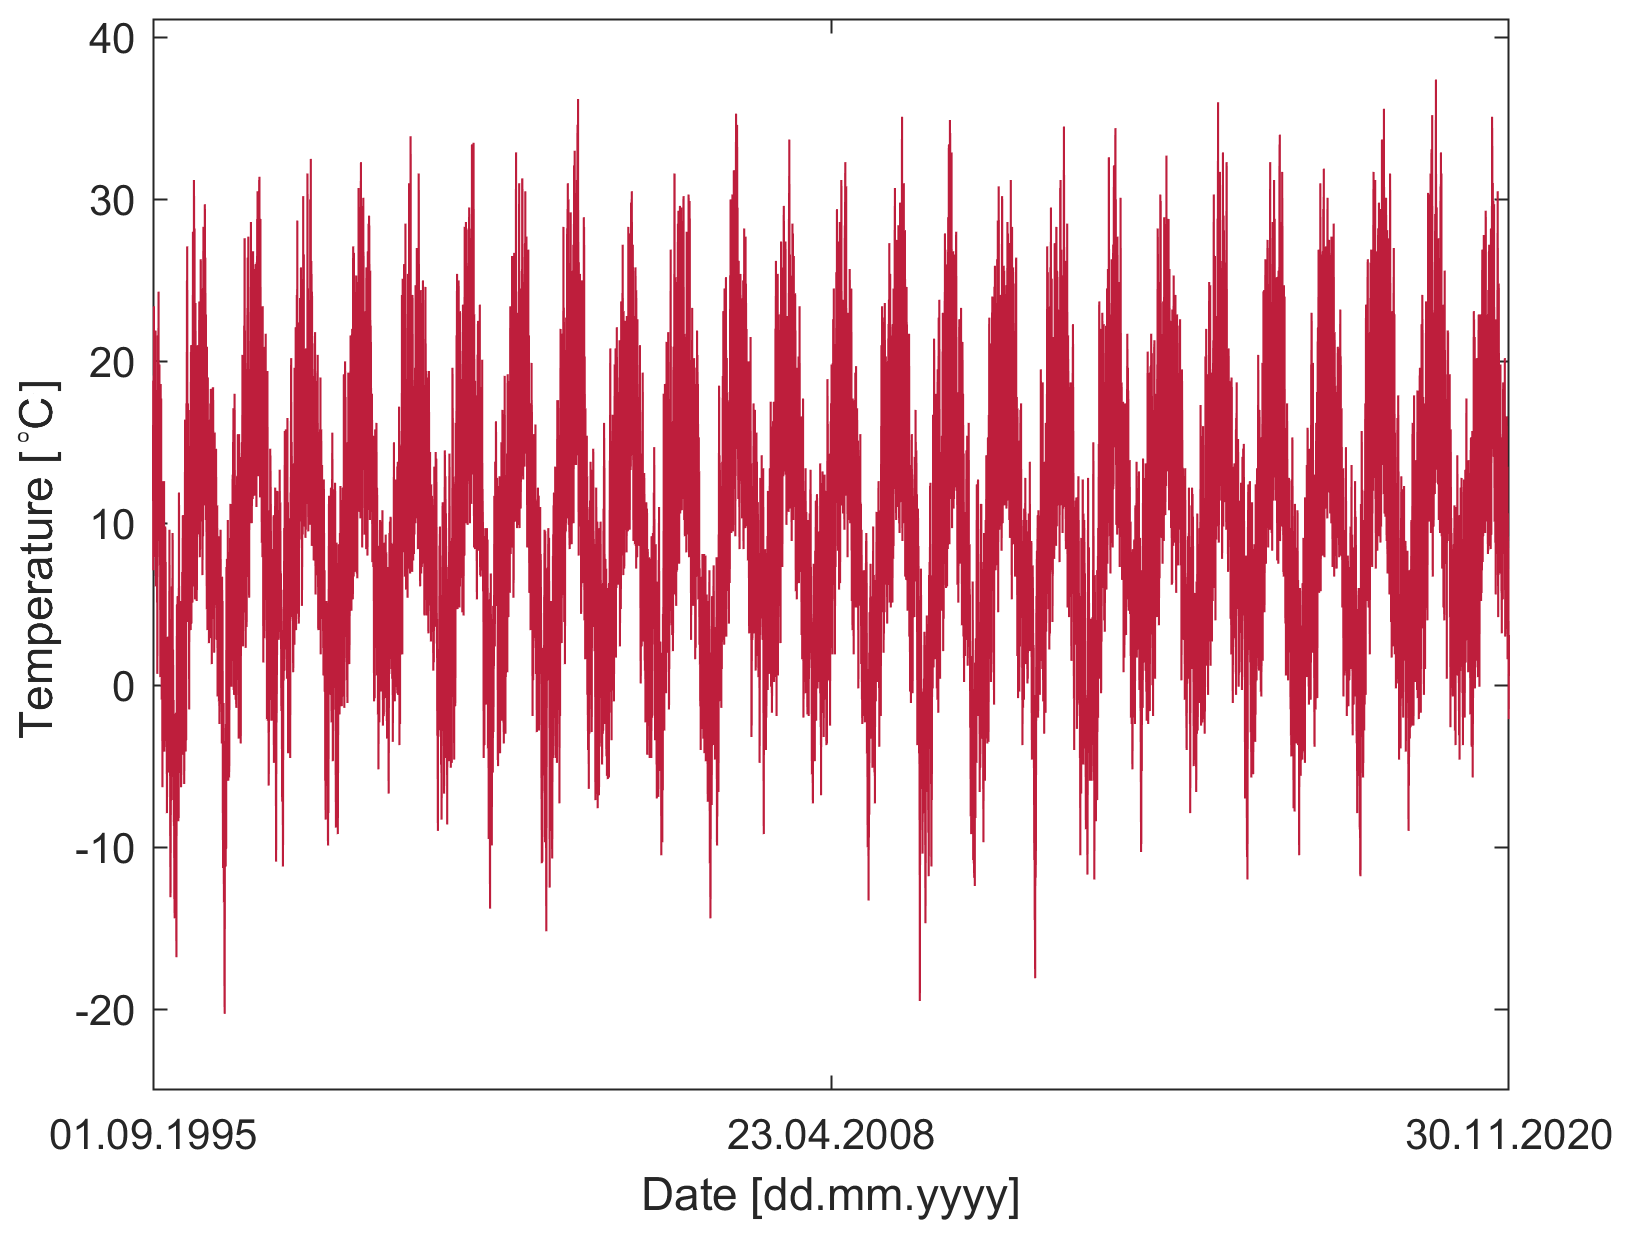
2.3.2 Temperature
The temperature is one of the parameters which contributes to each of the following: the gaseous attenuation, the attenuation by rain and the attenuation caused by the clouds or fogs. The value of temperature represents the mean value over 1 min at a certain time stamp of hour. The corresponding values of temperature within the period are visualized in Fig. 2. Over the given period, the maximum measured value of temperature equals to 37.4 ∘C and the minimum value amounts to −20.3 ∘C.
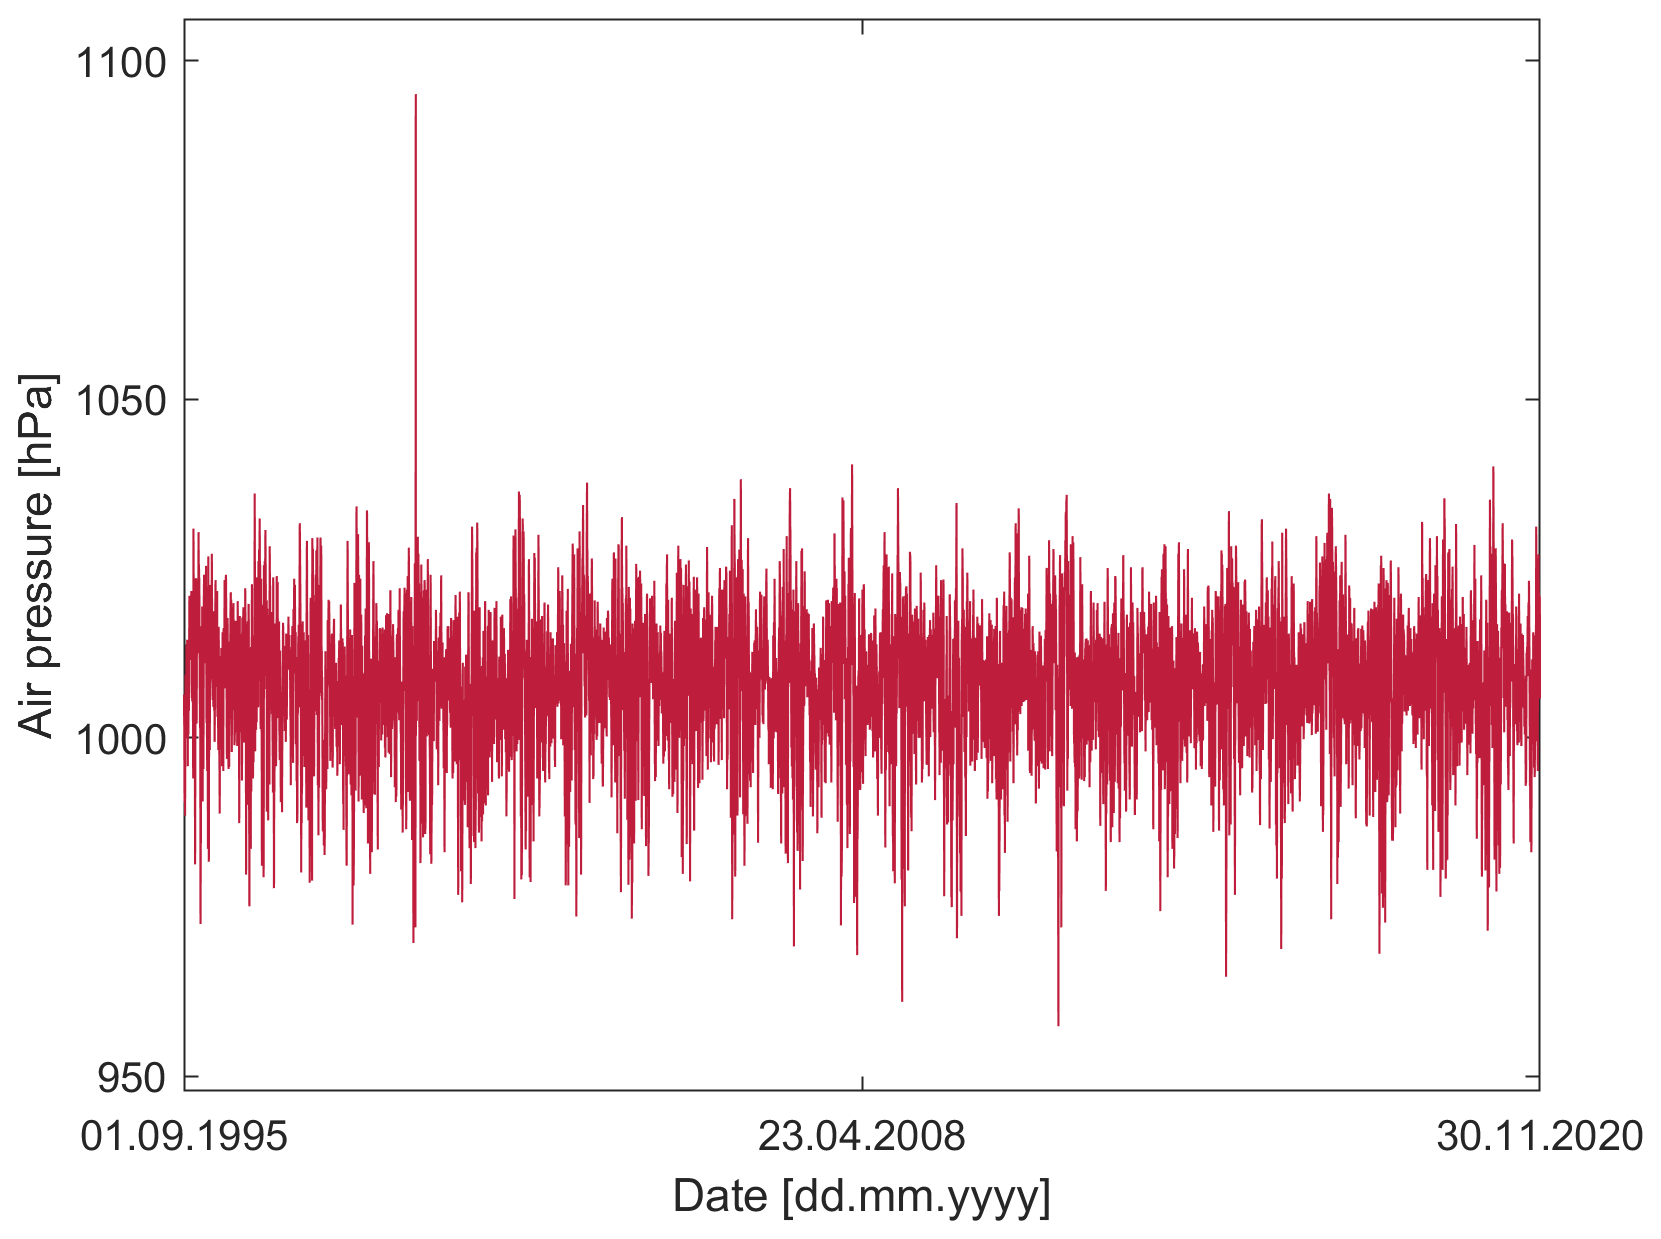
2.3.3 Air pressure
The air pressure is required for computing the additional gaseous attenuation. Air pressure influences on the frequency-dependent refractivities of molecules in the air and is thus positively related to the propagation loss of THz links. So the attenuation becomes higher when the air pressure increases and vice versa.
The value of air pressure represents the mean value over 1 min at a certain time stamp of hour. It refers to the air pressure at weather station height. In Fig. 3, the measured value of air pressure is visualized. Here, the maximum measured air pressure level over the period is 1095.1 hPa while the minimum value amounts to 957.4 hPa.
2.3.4 Rain rate
Rain rate is one of the most important weather parameters due to its significant contribution to the propagation loss compared to the other parameters. DWD does not provide rain rate directly but provides the precipitation. Converting precipitation value to intensity value (e.g., mm h−1) is a complex and challenging task. We assumed that direct converting hourly precipitation into hourly intensity can represent mid-term rainfall intensity (hourly resolution). This means the rain rate used for simulations does not refer to that constant rain intensity over one hour is expected but it is a representative value on average over the period.
In Fig. 4, the measured value of rain rate over the given period is shown. The maximum value of rain rate is as anticipated to 31.4 mm h−1 and the minimum value is zero. As anticipated with historic weather data is that the rain rate in the summer season tends to be higher than the other season and thus to creates larger additional attenuation. This is because the rain rate shows a positive relationship to the attenuation based on the mathematical equation in ITU-R P.838-3 (2005).

2.3.5 Wind
Wind is another factor affecting the quality of the THz links. However, the contribution of wind on the link's quality is not comparable to the contribution of other components described above. While the other components trigger the additional attenuation regarding to the transmission channel itself, wind provokes the additional loss of the signal power density in such a way that wind causes the misalignments of antennas and thus the receiver antenna received degraded signal power. The degree of the additional loss due to wind is depending on the combinatorial calculation of the radiation pattern of antenna and the misalignment angle.
Both Figs. 5 and 6 show the historical value regarding to wind. The used data represent the mean value of wind speed and wind direction over 1 h. Thus, it does not include strong wind gust. In Fig. 5, the wind direction and speed are mapped simultaneously. The direction is treated in such a way that North set as zero degree and the angle is defined in the clockwise direction. Thus, East equals to 90∘ and South to 180∘ while West is set as 270∘.
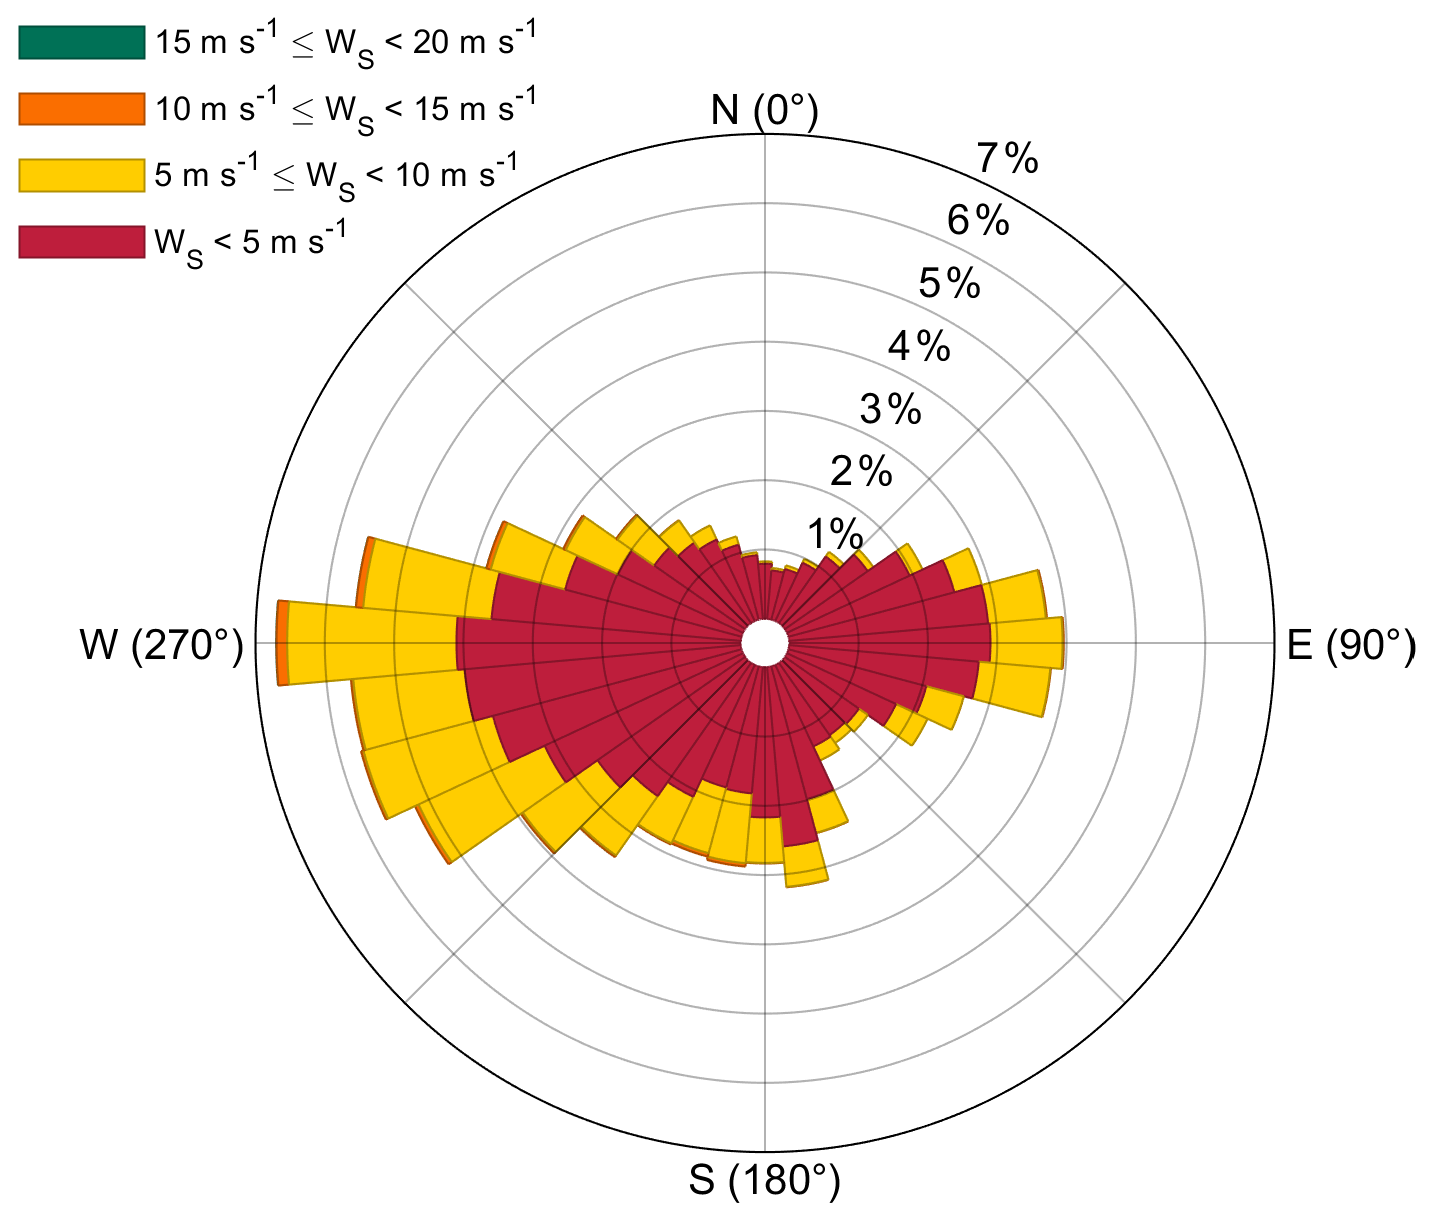
Figure 5Measurement value of wind direction and speed with the given period (round grids with percentage indicate the probability of wind direction).
The resolution of wind direction is set to 10∘. So the probability of wind direction is visualized in the histogram. Here, the round grids indicate the probability of each direction of wind in percentage (e.g., around 7 % of wind from West while around 4 % from East). The bar of each direction consists of four different speed field and this field is defined from zero to 20 m s−1 with the resolution of 5 m s−1.
In Fig. 6, the cumulative probability of the wind speed is given. Here, the wind speed of under 10 m s−1 dominates the value of entire measurements. Only 0.8 % of measured wind exceed 10 m s−1. The maximum speed of wind over the period amounts to 19 m s−1.

In this section, the simulation results taking into account for the historic weather data are presented. The simulations are conducted exploiting the in-house developed holistic simulation tool (SiMoNe). The initial version of the simulator is available in Rose et al. (2015). So far, SiMoNe has been further upgraded and thus extensive features are feasible. The functions related to simulation of 300 GHz wireless backhaul links are introduced in Jung et al. (2021). For the simulation, two types of scenarios are contemplated respectively a single point-to-point link and an entire wireless backhaul network. Through these simulations, the potential impact of weather conditions on THz links is investigated and elaborated with the historic weather data.
3.1 Ponit-to-point simulation result
Point-to-point simulation provides a general insight of the impact of weather conditions on the THz link. For the simulation, two antennas assumed standing parallel with the same height of 1 m above building rooftop over the distance of 1 km and positioned on a line pointing West to East and vice versa.
In this simulation, the simulation parameters for the wireless transmission are chosen as the ThoR hardware model described in Table 1. The transmission power set as −1 dBm. The antenna gain is 54.9 dBi on both of TX and RX. Noise figure of RX antenna is 10 dB and noise temperature of RX antenna is assumed as 300 K. Here additionally the recommended mathematical models in ITU-R F.1245-3 (2019) and ITU-R F.699-8 (2016) are applied to derive the 3D radiation pattern 54.9 dBi gain antenna.

Figure 7 shows the resulting received power based on the point-to-point simulation considering historic weather data.
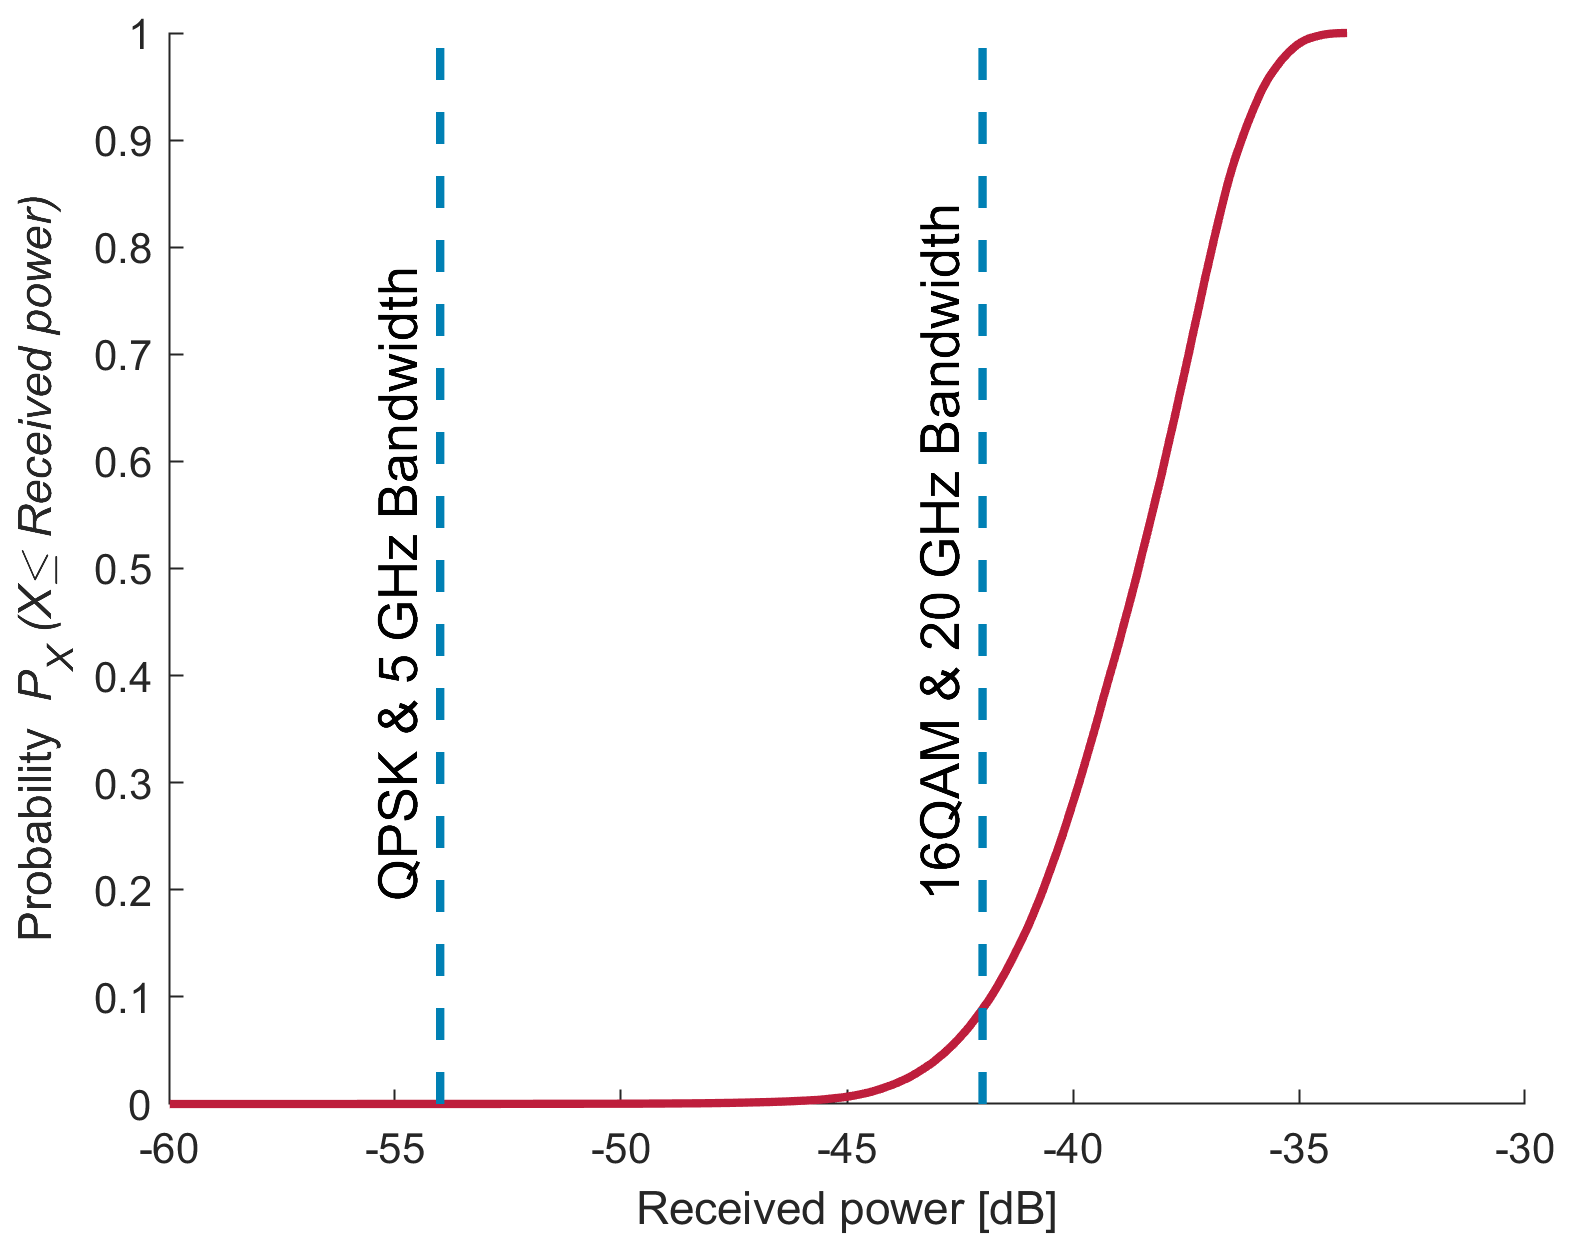
Figure 7Simulation results of the received power over 1 km link distance (blue dash lines corresponds to the required receiver sensitivity for QPSK with 5 GHz bandwidth and for 16 QAM with 20 GHz bandwidth).
Both blue stitched lines indicate the receiver sensitivity for 16 QAM with 20 GHz bandwidth and for QPSK with 5 GHz bandwidth respectively. The corresponding values of the receiver sensitivities are deducted by the hardware parameter given in Table 1 and amount to −54 and −42 dB respectively.
Over the entire period, only at 0.005 % of time-slots did not exceed the required receiver sensitivity for QPSK with 5 GHz bandwidth. So thus the case for 16 QAM with 20 GHz bandwidth at around 8.9 % of time-slots.
Based on the results visualized in Fig. 7, the computation of cell outage probability regarding to the link distance is conducted. For this purpose, cell outage probability is reversely deducted by calculating the maximum feasible link distance under each of historic weather conditions. The computation of the maximum feasible link distance is thus accomplished by solving d of the Eq. (6).
where RPfsp refers to the theoretical received power supposing to the free space transmission without any other attributes be getting additional attenuation on the propagating signal. RXrs refers to the receiver sensitivity. γat, γr, γcl and γw indicate the attenuation components caused by weather conditions defined in Sect. 2.1.
Doing the reverse deduction process while considering also the effect of wind is however too complex and time-consuming since the loss of power density due to wind is resulted by the combination of the radiation pattern and the misalignment angle of antennas. Besides, as it can be seen in Fig. 6, strong enough wind occurs rarely, which would lead the meaningful influence on the antenna sway and thus provoke the strong energy loss. As an example, wind with 20 m s−1 of speed results ∘ of inclination angle on 1 m height antenna with a standard thickness of antenna pole defined in ThoR D5.2 (2019). Therefore, the parameter of γw can be assumed to be zero to reduce the computation intensity. As a result, the maximum feasible link distance is thus resulted only considering weather parameters of γat, γr and γcl.
In Fig. 8, the cell outage probability depending on link distance is given elaborated with the historic weather data provided in the previous section. In which, the cell outage probability using 16 QAM with 20 GHz bandwidth is separately visualized by season. This is because that the weather data visualized in Sect. 2 showed a certain periodic trends and thus can lead a different tendency of attenuation by seasons. We have categorized in four seasons: spring (March to May), summer (June to August), autumn (September to November), winter (December to February). The result showed an apparent tendency that the high attenuation mostly appears in the summer season while in the winter the opposite is visible.
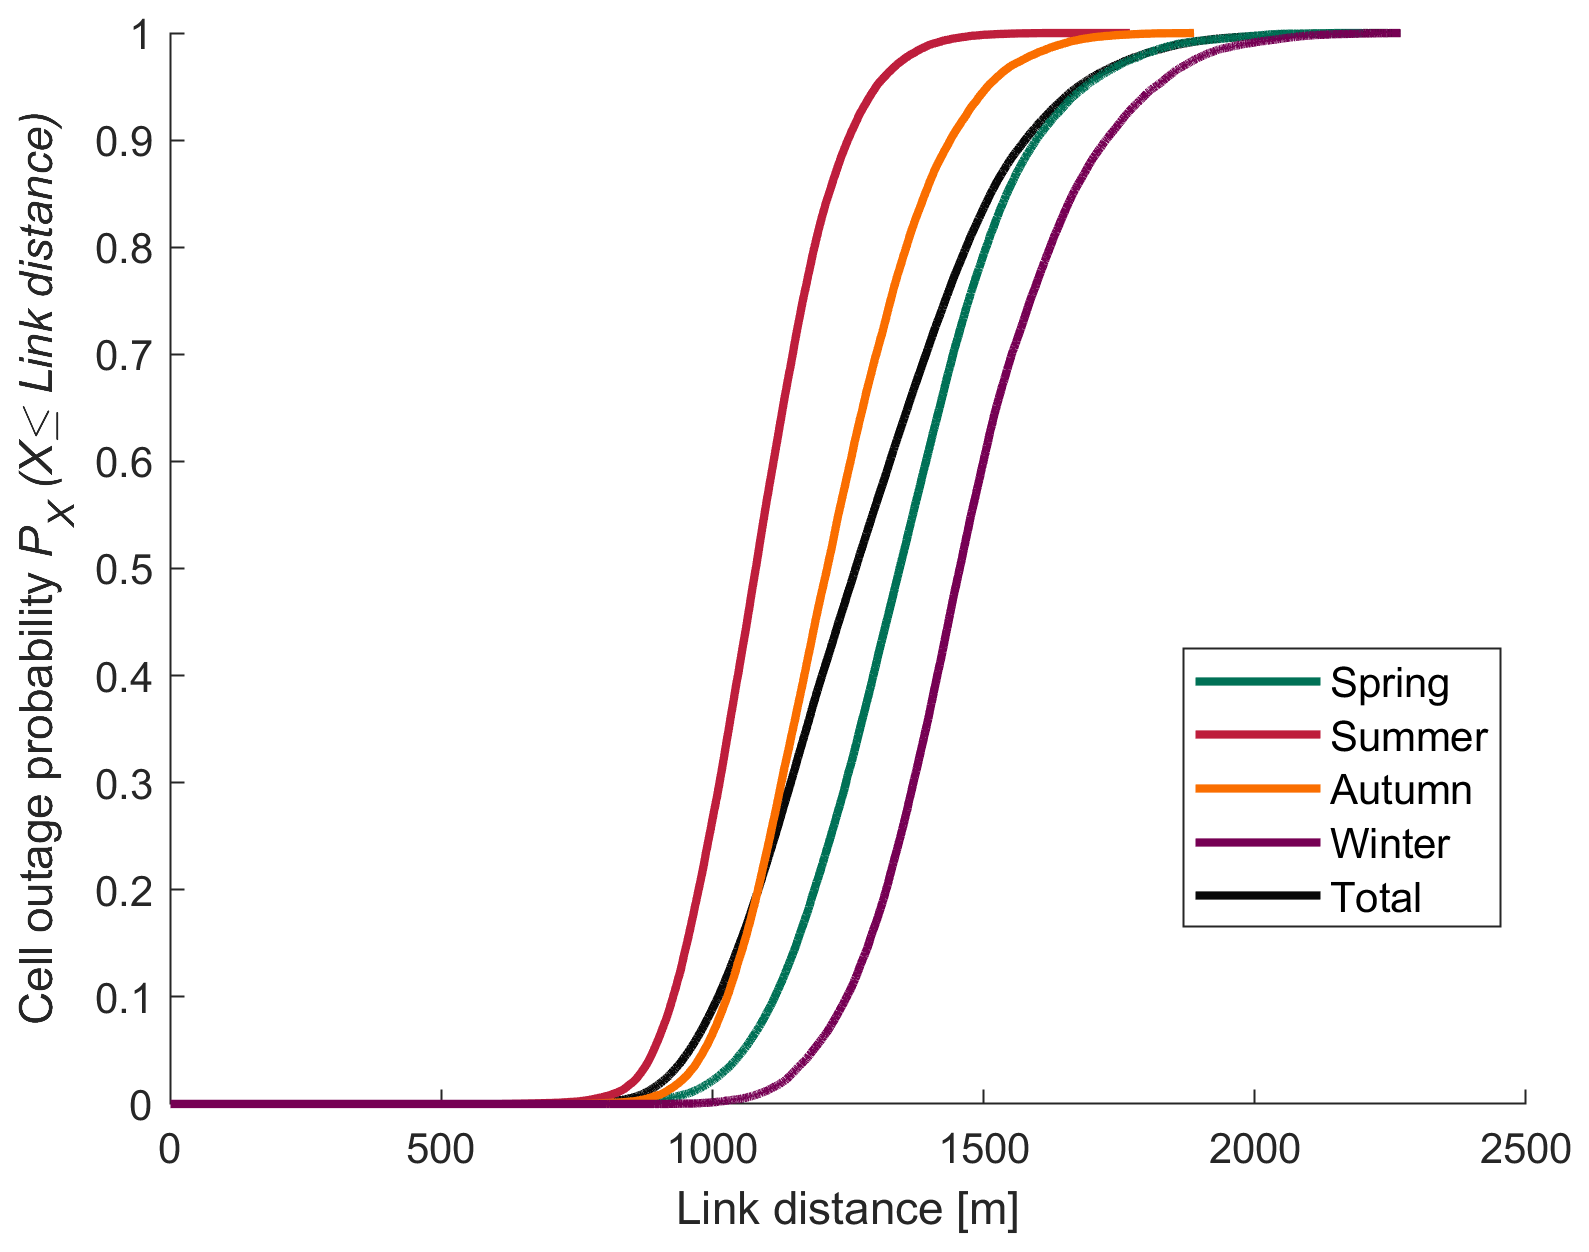
Figure 8Seasonal cell outage probability of THz links using 16 QAM with 20 GHz bandwidth considering historic weather conditions.
The feasible link distance stretches from 533 to 2269 m through the entire period. Considering it by season, the link distance in spring spans from 647 to 2198 m, in the summer from 533 to 1770 m, in Autumn between 589 and 1888 m and while in the winter the link distance is between 806 and 2269 m. Therefore, the THz link covering less than 535 m could operate using 16 QAM with 20 GHz bandwidth regardless of the given historic weather and thus can theoretically transmit up to 160 Gbit s−1 based on Nyquist's formula given in Eq. (7).
where C refers to the maximum channel capacity. B refers to the bandwidth and M refers to the number of signal levels.
In Fig. 9, the cell outage probability for QPSK with 5 GHz bandwidth is visualized. As the spectral efficiency of modulation scheme, as well as the bandwidth, is decreased, the required value of receiver sensitivity is increased and consequently the longer transmission distance is thus achievable. As a result, the THz link is operable up to 835 m in the worst weather condition while in the clearest weather condition up to 6357 m.

Figure 9Cell outage probability of THz links using QPSK with 5 GHz bandwidth considering historic weather conditions.
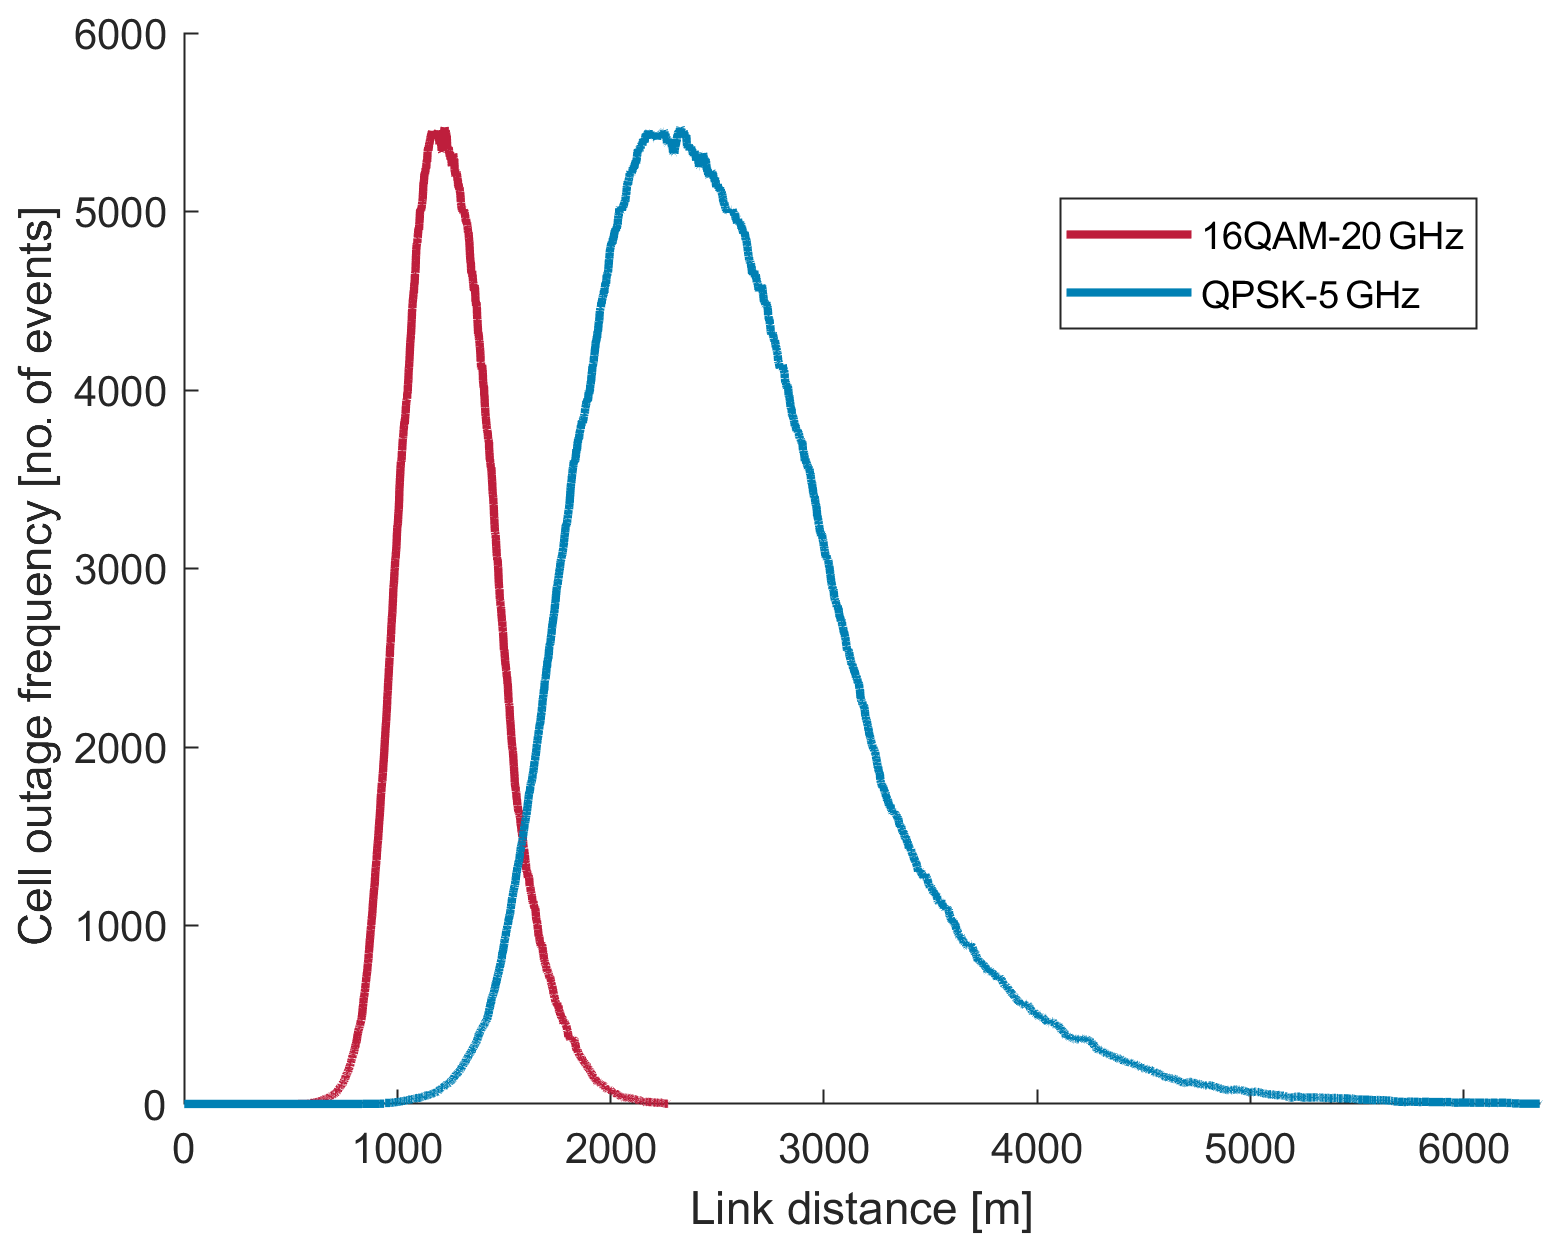
Figure 10Cell outage frequency both for 16 QAM with 20 GHz bandwidth and QPSK with 5 GHz bandwidth.
Figure 10 shows the cell outage frequency both for 16 QAM with 20 GHz bandwidth and for QPSK with 5 GHz bandwidth. The cell outage frequency refers to how frequently the THz link using the given modulation scheme and corresponding bandwidth would be disconnected over the analysed period of time. The time resolution of the analysed time period is 1 h.
The disconnection frequency tends to increase rapidly from the minimum operable distance of both approaches, respectively 533 m for 16 QAM with 20 GHz bandwidth and 835 m for QPSK with 5 GHz bandwidth. After the peak both the disconnection frequency tends to decrease and thus to follow a normal distribution. This is because the duration of cell outage time becomes longer as the link distance becomes longer and thus the link tends to be recovered less frequently.
The highest number of cell outage frequency is observed as 5471 times. The highest number of disconnections using 16 QAM with 20 GHz bandwidth appeared at 1222 m link distance while the highest number of disconnections using QPSK with 5 GHz happened at 2328 m link distance.
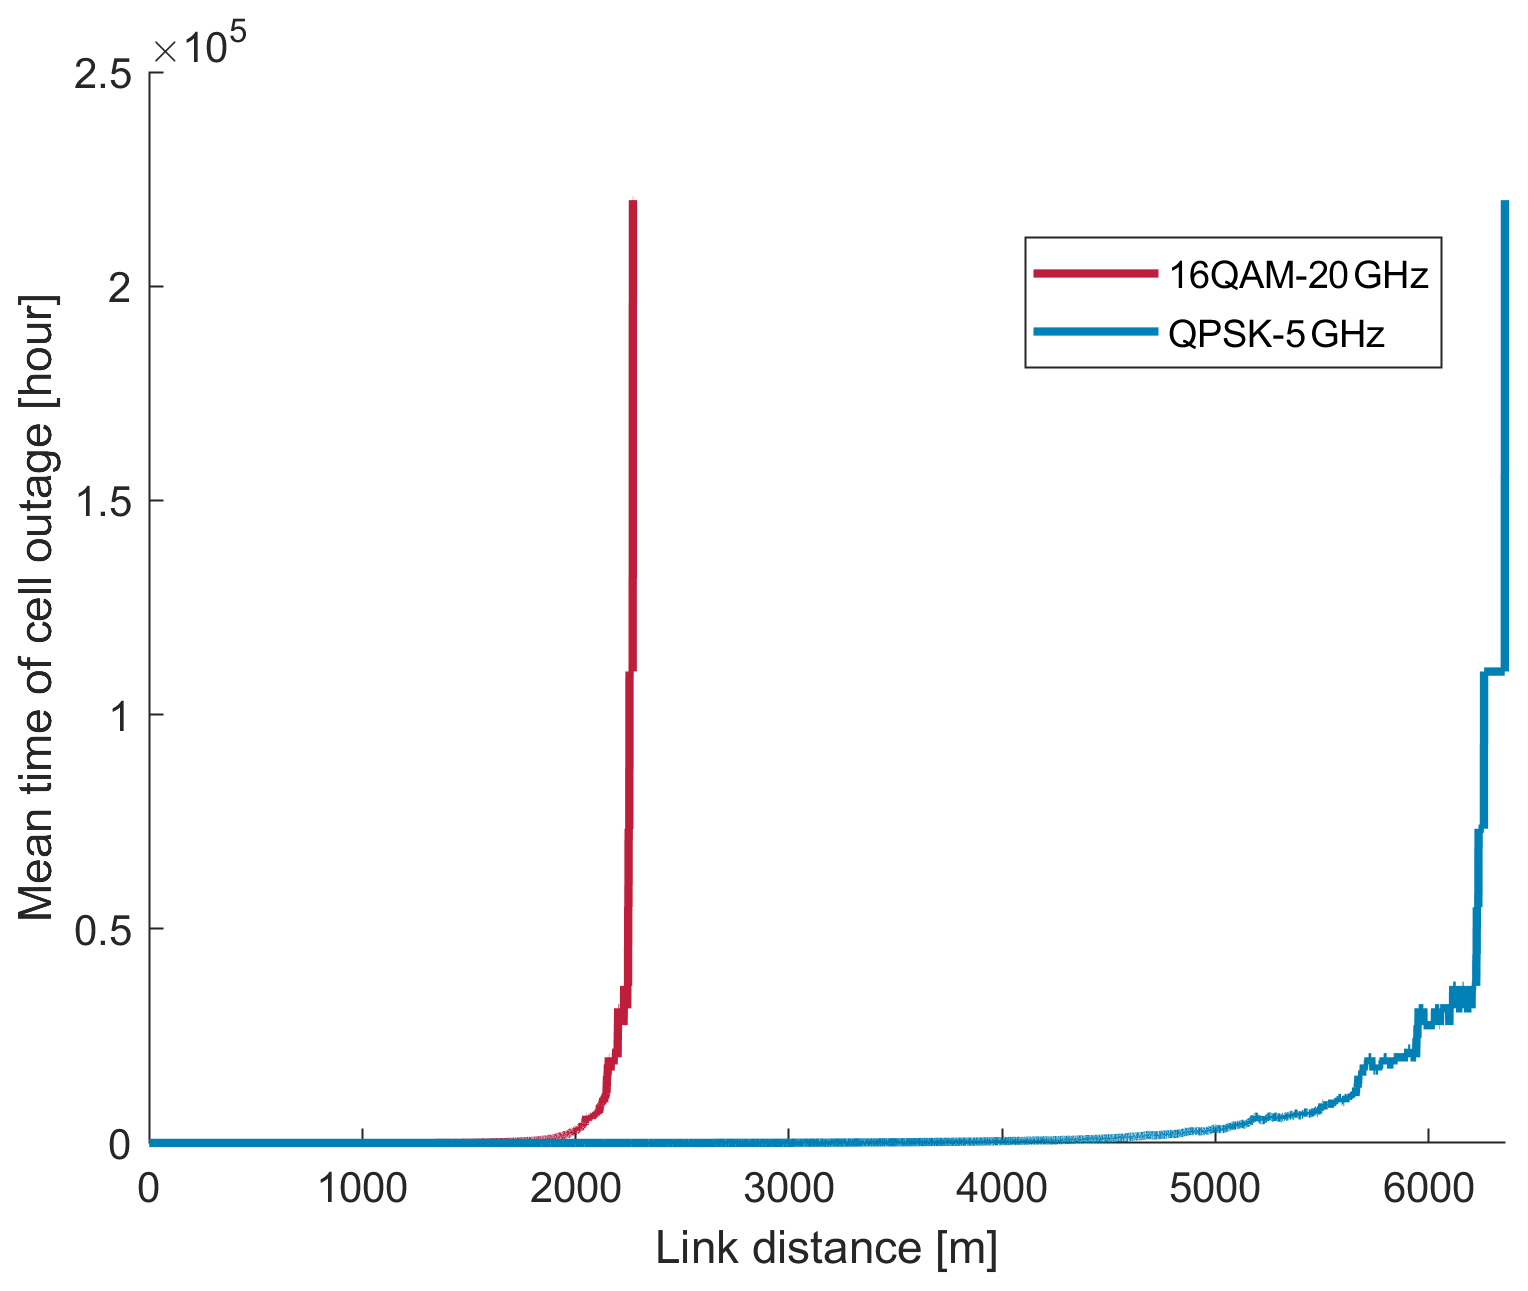
Figure 11Cell outage time both for 16 QAM with 20 GHz bandwidth and QPSK with 5 GHz bandwidth.
In Fig. 11, the average cell outage time is visualized. The average cell outage time indicates that the expected average length of the cell outage event. Thus this value is obtained by dividing total cell outage events into total cell outage periods.
The mean cell outage time of 1222 m link distance using the 16 QAM with 20 GHz bandwidth is predicted 17.37 h. This means that there were 5471 times of disconnections of the link and each of disconnection will take 17.37 h before the link is restored. The link distance of 2328 m for QPSK with 5 GHz bandwidth showed almost same value of the average cell outage time of 17.36 h.
3.2 Simulation result of wireless backhaul network
Apart from the point-to-point simulation shown in the previous Sect. 3.1, the influence of weather conditions on THz link is investigated further considering an entire wireless backhaul network. Here, the wireless backhaul network in Hanover area is automatically planned using automatic planning algorithm suggested by Jung et al. (2019).
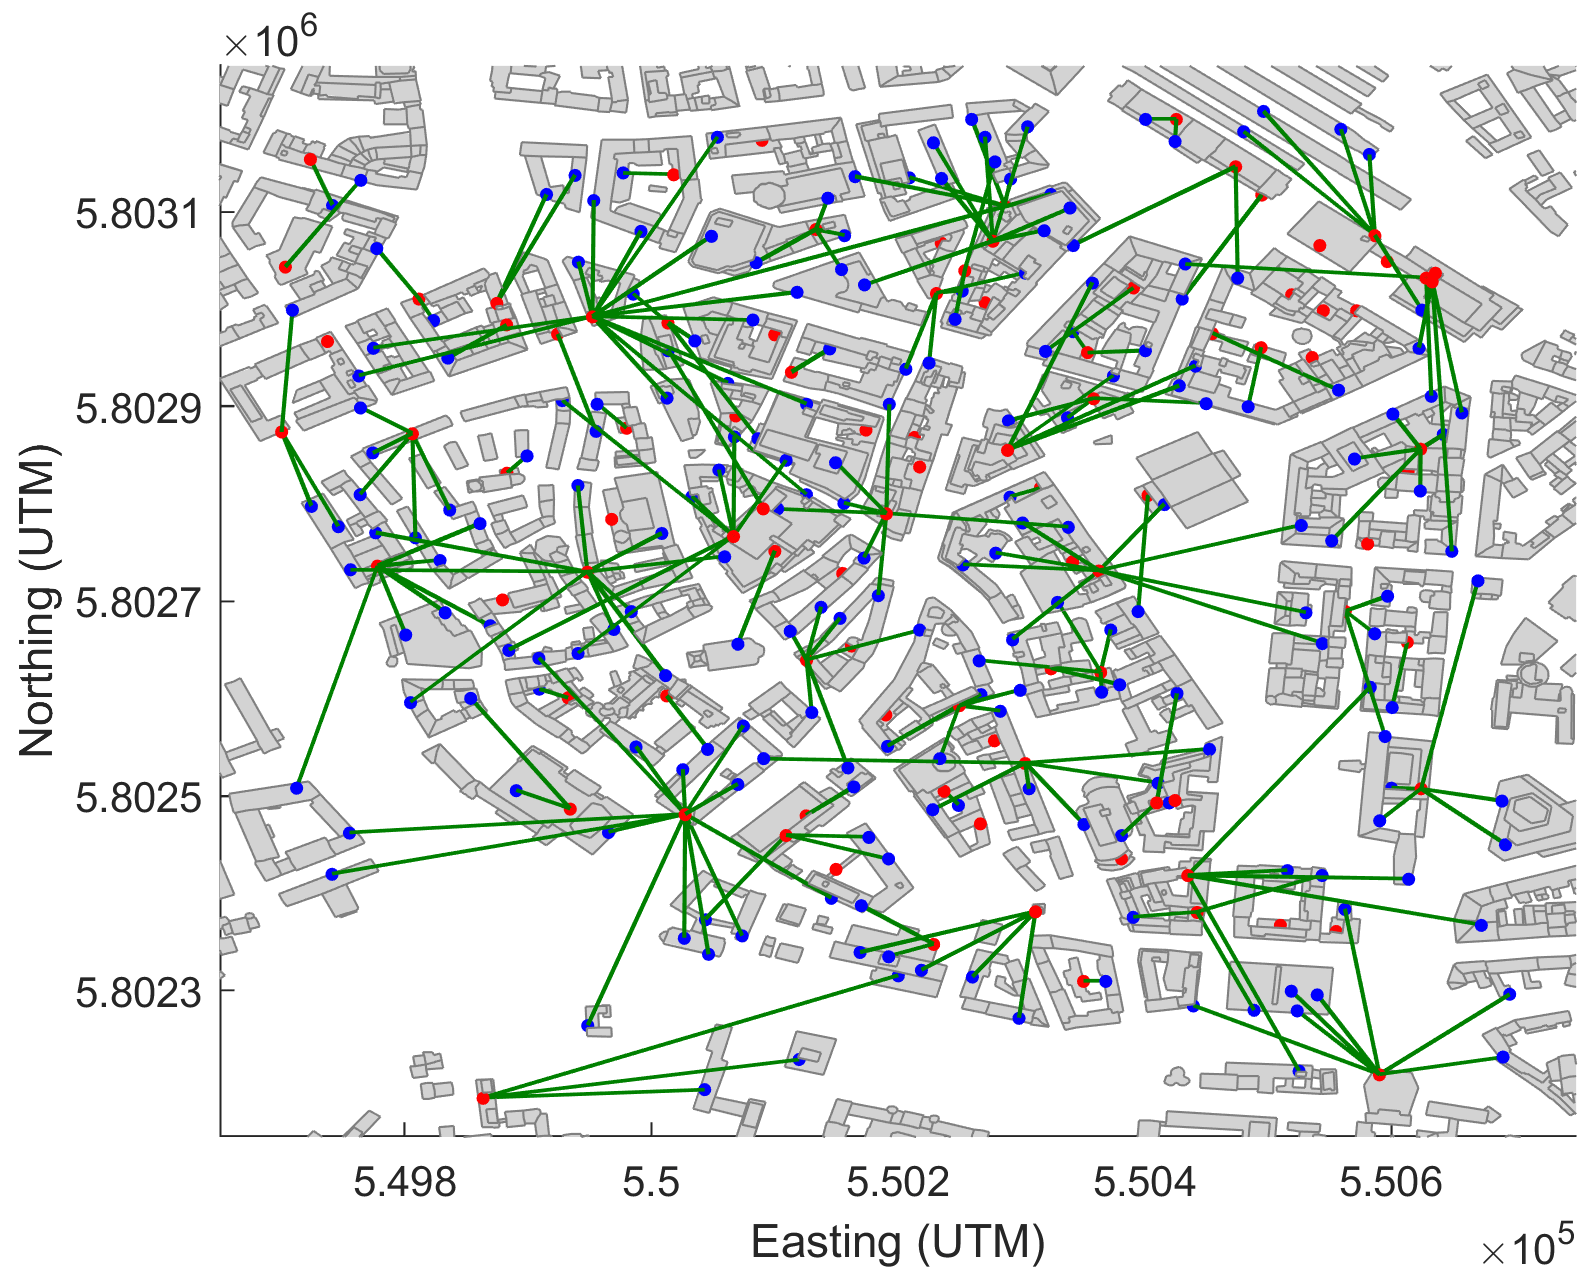
In Fig. 12, the automatically planned backhaul network is visualized. Where the red points refer to the anchor cell sites whose backhaul connections are provided via fibre while the blue points refer to the cell sites with wireless backhaul links. The green lines indicate the wireless backhaul links between anchor cell sites and the cell sites with wireless backhaul.
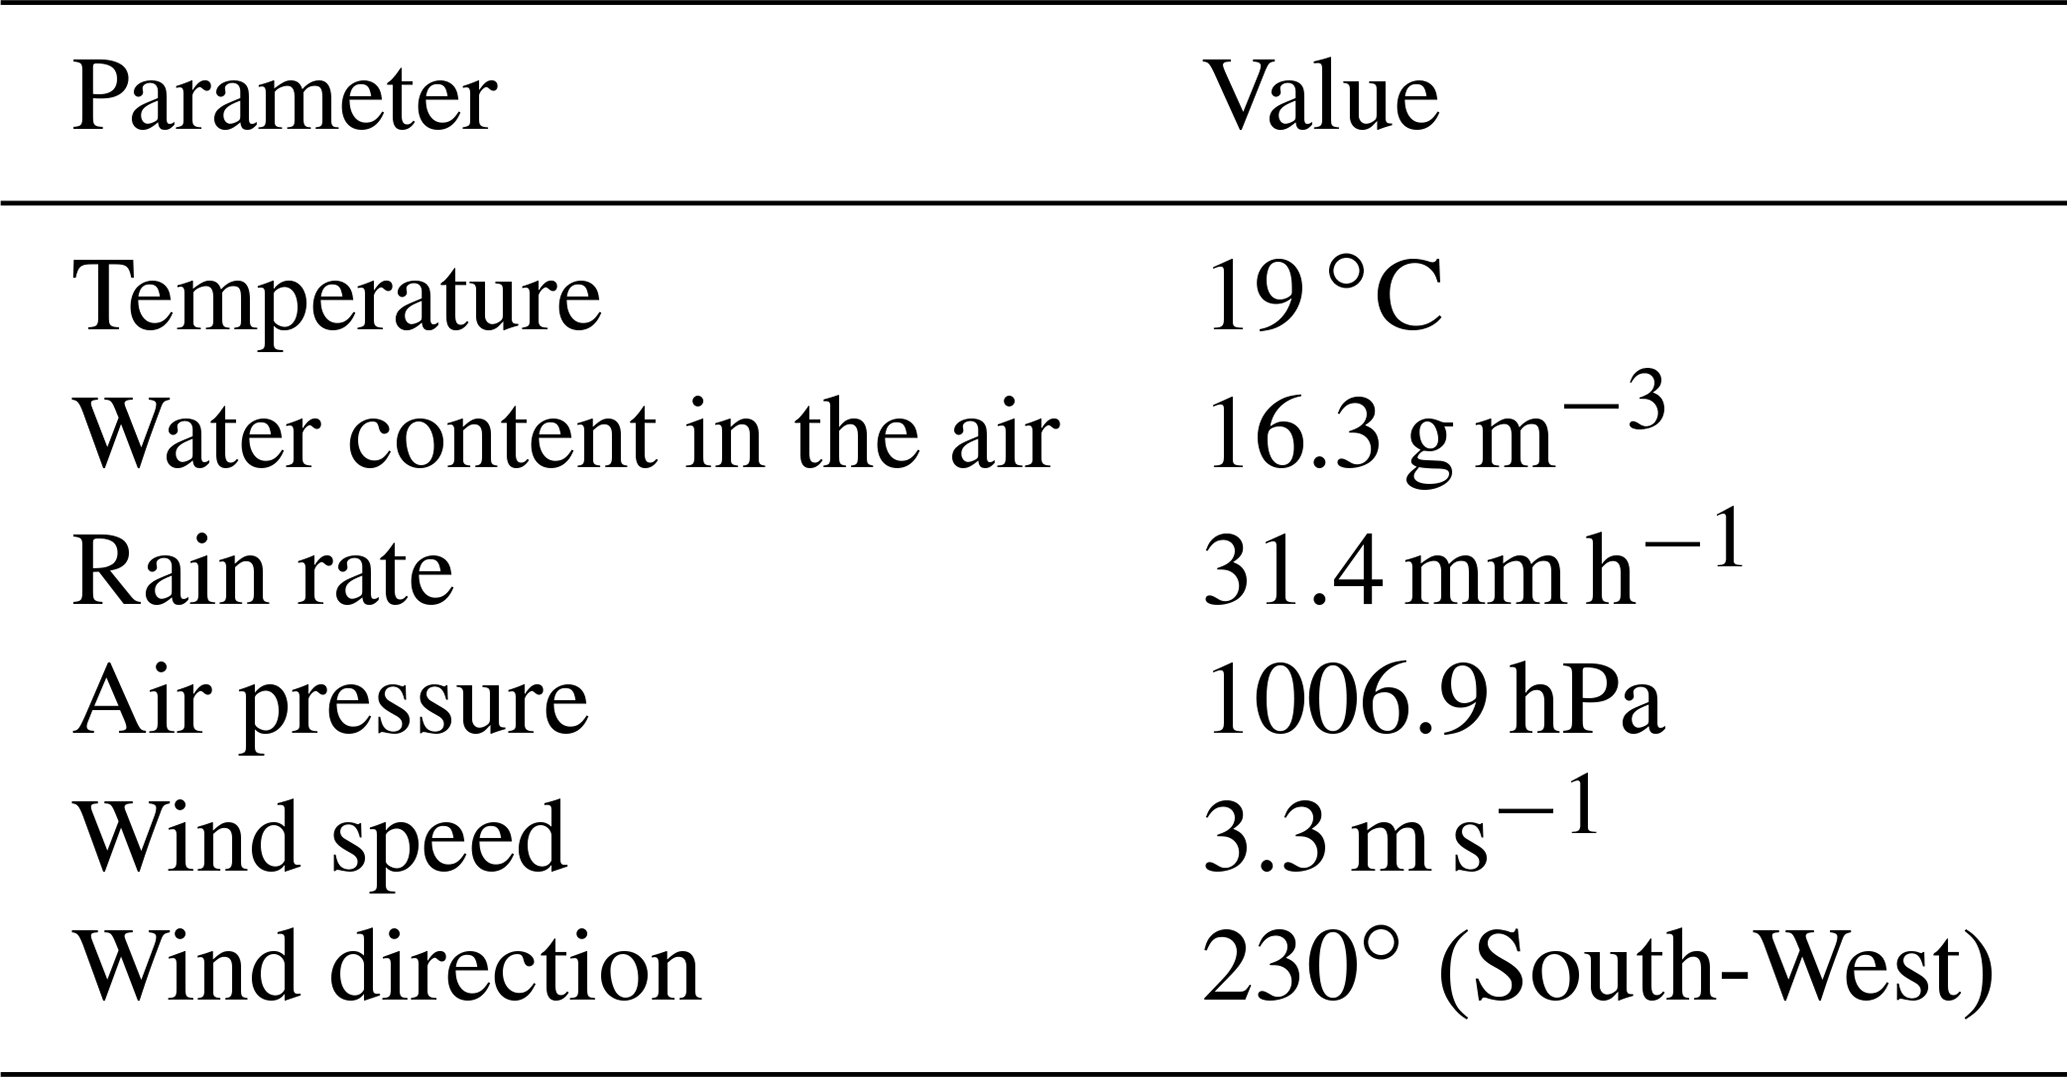
From the historic weather data set, two time-slots are chosen as the extreme cases of the weather condition. One represents the time-slot resulting the highest value of the additional propagation attenuation, which is estimated at 20:00 UTC on 7 July 2017. The detailed values are given in Table 2.
Table 2Weather parameters representing the highest value of attenuation.
The other represents the highest value of the wind speed, which is estimated at 15:00 on 18 January 2018. The detailed values are given in Table 3.
Table 3Weather parameters representing the highest value of wind speed.
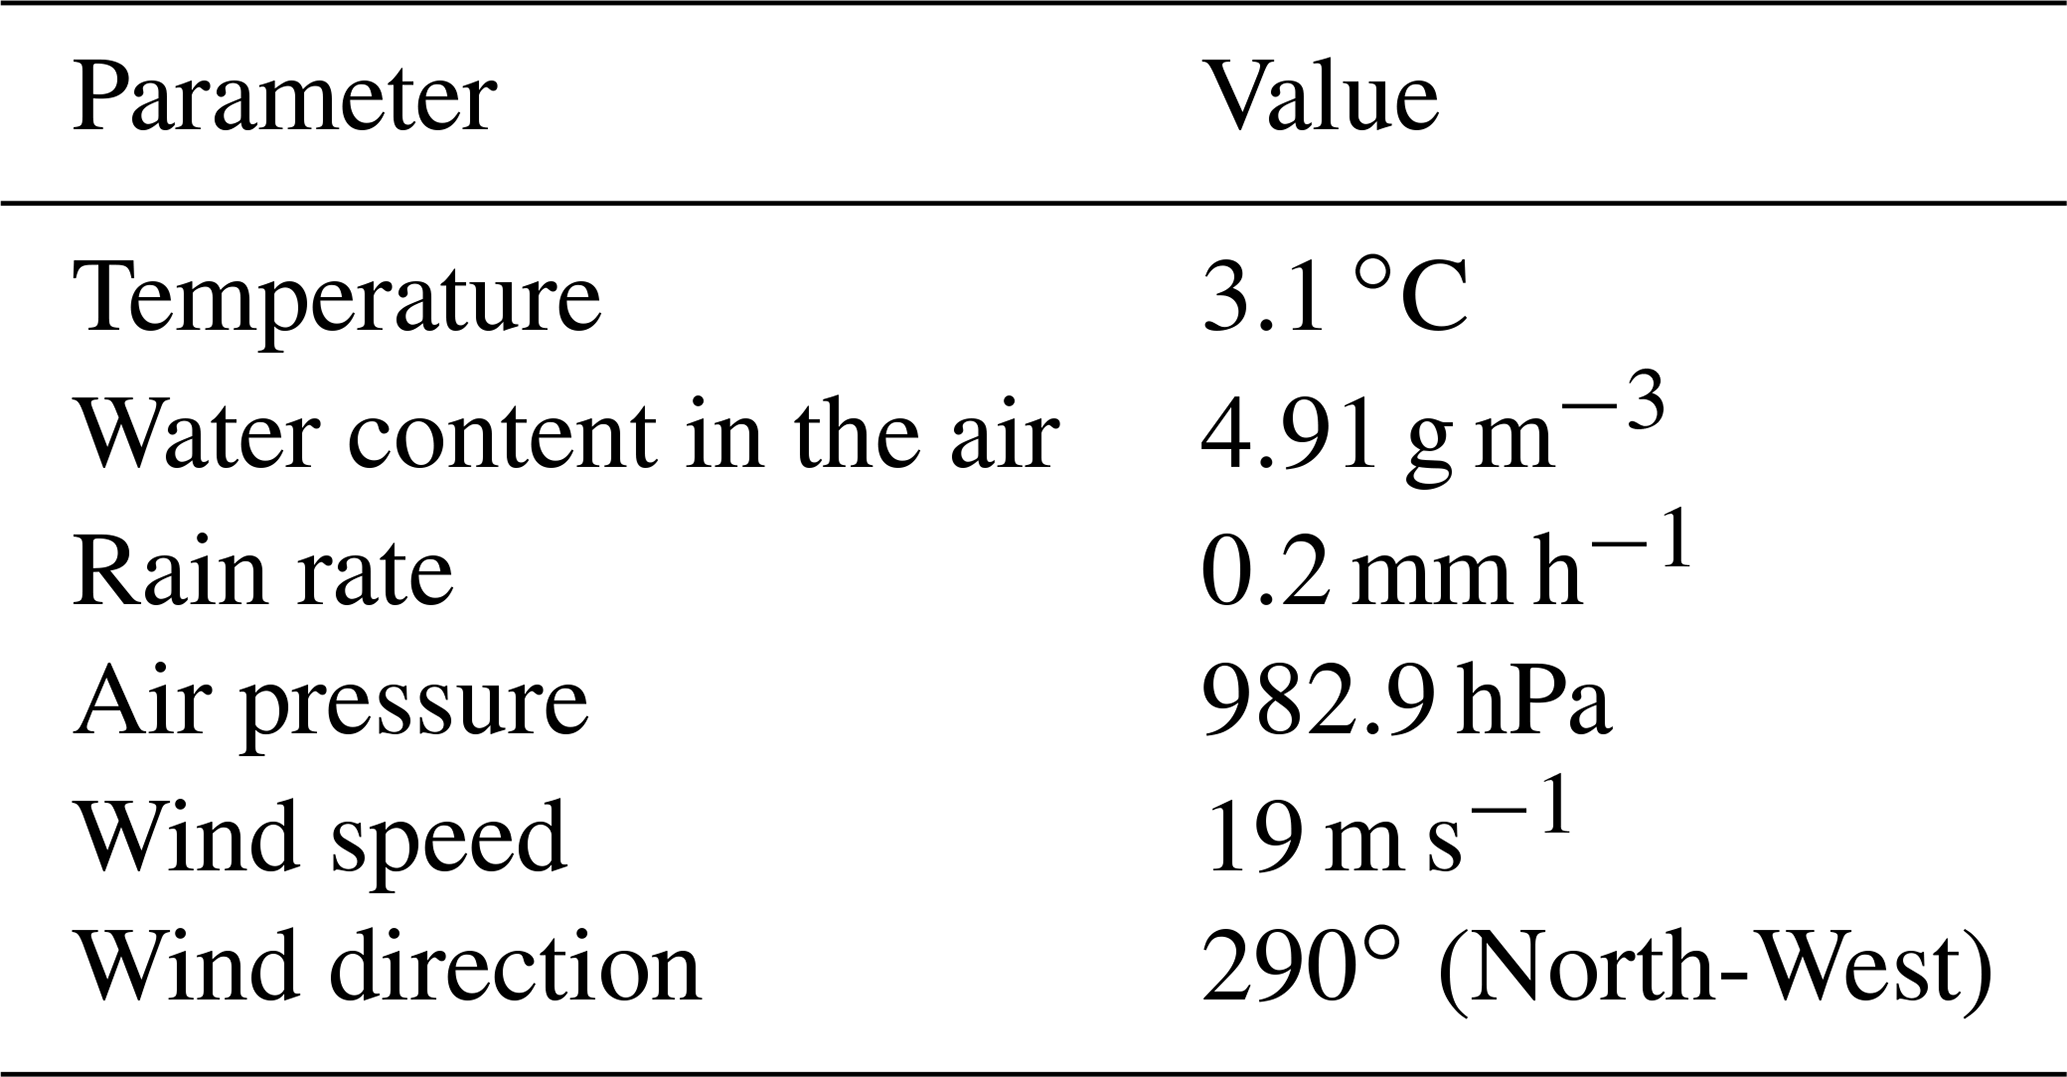
Figure 13 shows the SINR values of the planned wireless backhaul network taking into account for the worst weather condition within the given historic period and its wind speed of 3.3 m s−1, air pressure of 1006.9 hPa, temperature of 19 ∘C, water vapour density of 16.3 g m−3 and 31.4 mm h−1 rain rate. The simulation is conducted by applying two types of antenna height each for 1 and 5 m and the two types of antenna pole's diameter respectively 89 and 165.2 mm. Additionally, the 50 GHz bandwidth is considered for the larger transmission capacity.
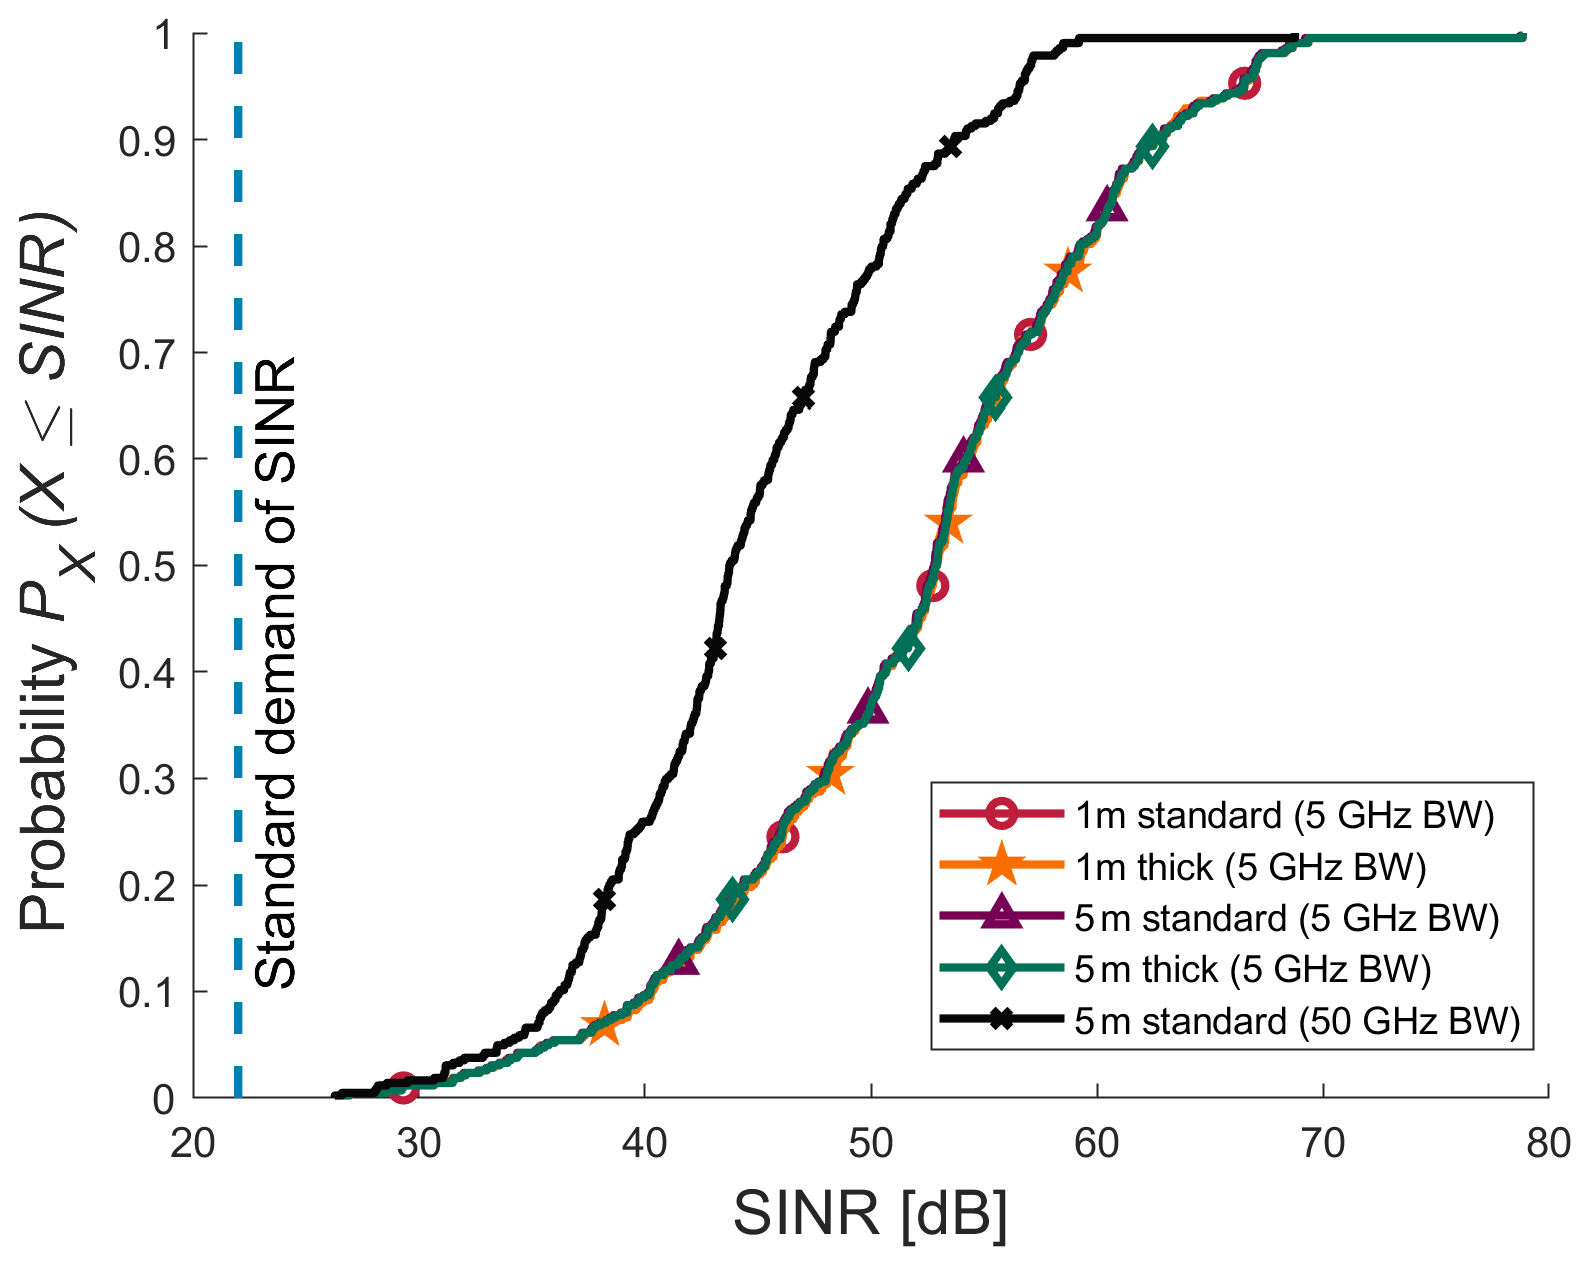
Figure 13SINR values of wireless backhaul links using the time-slot of the worst weather condition.
Every single probability curves exceed the standard demand of SINR regardless of antenna height, antenna pole and bandwidth. Here, the standard demand of SINR refers to the required value for the highest modulation and coding scheme defined in IEEE Std 802.15.3d (2017). Therefore, the planned wireless backhaul network operates trouble-free under the worst weather condition within the given period. Furthermore, all of the SINR curves with 5 GHz bandwidth showed almost identical footprint. The differences of each curves are infinitesimal since the 3.3 m h−1 wind speed induces rather imperceptible inclination angle of antenna pole.
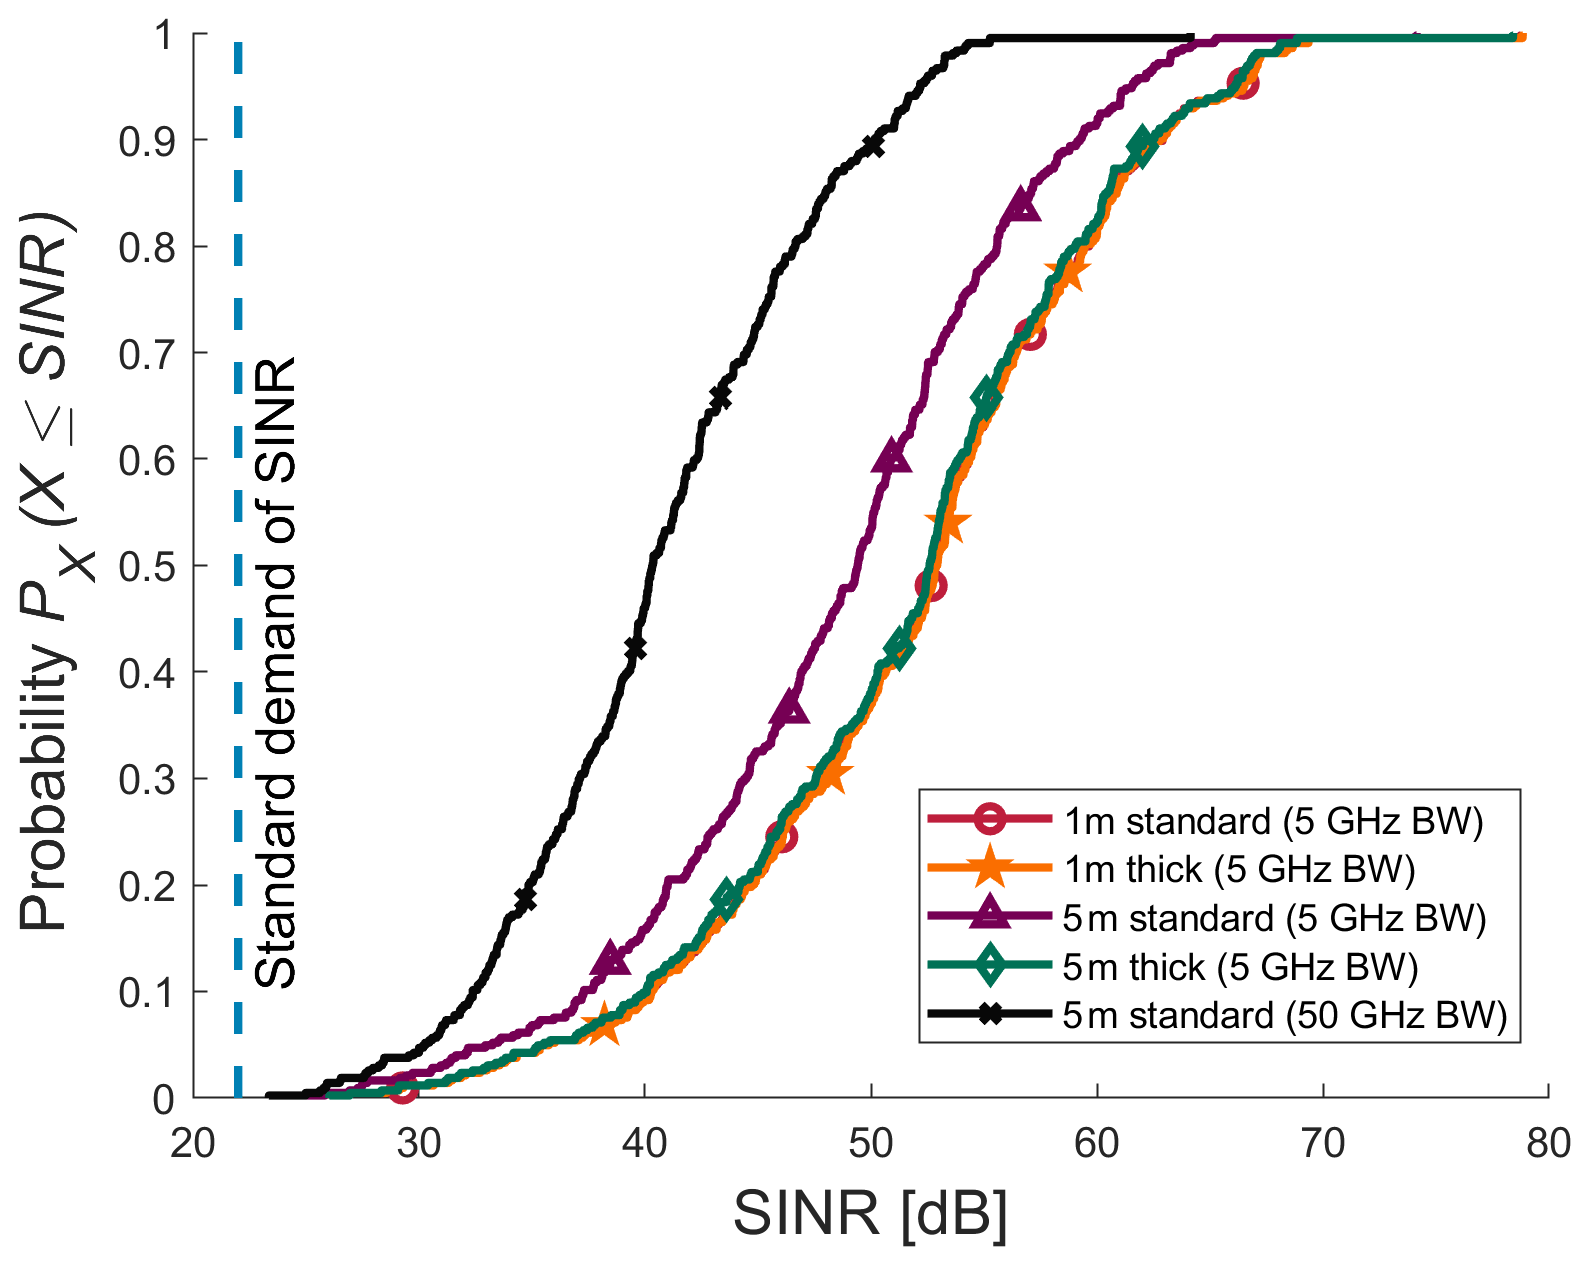
Figure 14SINR values of wireless backhaul links using time-slot of the highest wind condition.
In Fig. 14, SINR values are visualized using the strongest wind within the given period. Here, the antenna height, thickness of antenna pole and bandwidth are configured. The time-slot for strongest wind speed as worst-case is used within the given time period. The used weather parameters are to 19 m s−1 of wind speed, 982.9 hPa of air pressure, 3.1 ∘C of temperature, 4.91 g m−3 of water vapour density and 0.2 mm h−1 of rain rate respectively. Here it is shown that the 5 m height antenna with standard thickness defined in ThoR D5.2 (2019) undergoes the energy loss resulted by wind while the influence of wind of other parameter set with 5 GHz bandwidth is not remarkable. Same like Fig. 13, every simulation results exceed the standard demand value. This means that planned wireless backhaul links are not broken down under the strongest wind measured within the given time period regardless of antenna height, thickness of antenna pole and even larger bandwidth.
The focus of this paper is to examine the weather impacts on the THz link. For this, two simulation scenarios respectively point-to-point link and wireless backhaul network are considered. Both simulations are conducted on the basis of the historical weather data provided by climate data centre of German weather service.
The point-to-point simulation revealed that the cell outage probability shows the seasonal tendency. Using ThoR hardware specification, the THz links operating with 16 QAM and 20 GHz bandwidth up to slightly over 500 m of distances will be operable in Hanover area without disconnection. The simulation of wireless backhaul network is conducted assuming the worst-case scenario for each time-slot for the highest attenuation and the strongest wind of the historic weather data. For the second simulation, various combinations of configuration parameters respectively height of antenna, pole type of antenna and transmission bandwidth have been examined. The simulation results showed that every combination of configuration parameters supports the usage of the highest modulation and coding scheme defined in IEEE Std 802.15.3d (2017) for every single wireless backhaul link regardless of the weather conditions over the given period.
One noticeable fact of this research is that even though the simulation is limited only to Hanover area, restricted within certain time period and reflected general mid-term weather conditions, both simulation results showed apparent evidence of the feasibility of wireless backhaul links operating at 300 GHz under the given weather conditions. Further studies will contain the simulation results using extreme weather conditions with a short time period. This will be conducted considering more real-like parameters with other simulation scenarios defined in ThoR D2.4 (2019). Doing this, universal knowledges about wireless backhaul links can be investigated and thus we expect to deliver general planning guidelines of wireless backhaul links.
The code is not publicly accessible since the tool that we are using is developed in-house. The property of this tool belongs to the institut für Nachrichtentechnik so the access is thus currently only limited to the internal members due to the confidential issue.
The reseach data is publicly accessible through climate data center of german weather service. All URLs have been last accessed on 19 May 2021.
-
air pressure:
-
air temperature and relative humidity:
-
precipitation:
-
wind direction and speed:
BKJ and TK investigated main conceptional ideas. BKJ performed simulations and evaluated results. TK supervised all of the process. All authors provided crucial feedbacks and supported the research.
The authors declare that they have no conflict of interest.
Publisher's note: Copernicus Publications remains neutral with regard to jurisdictional claims in published maps and institutional affiliations.
This article is part of the special issue “Kleinheubacher Berichte 2020”.
The work presented here, has been performed within the Horizon 2020 ThoR project. This project has received funding from Horizon 2020, the European Union's Framework Programme for Research and Innovation, under grant agreement No. 814523. ThoR has also received funding from the National Institute of Information and Communications Technology in Japan (NICT).
This research has been supported by the Horizon 2020 Framework Programme, H2020 Industrial Leadership (ThoR (grant no. 814523)).
This open-access publication was funded by Technische Universität Braunschweig.
This paper was edited by Madhu Chandra and reviewed by Uwe Siart and one anonymous referee.
AWG-25/TMP-10: Working document towards a preliminary draft new APT [Recommendation/Report] on “model[s] for FWS link performance degradation due to wind”, Tech. rep., Asia-Pacific Telecommunity Wireless Group, Tangerang, Indonesia, 2019. a
Ericsson: Ericsson Mobility Report, available at: https://www.ericsson.com/en/mobility-report/reports/november-2020 (last access: 7 April 2021), 2020. a
Fricke, A., Rey, S., Peng, B., Kurner, T., Seto, I., Hiraga, K., Yaita, M., Song, H., Kasamatsu, A., Hosako., I., He, D., Guan, K., Ogawa, H., Bo, A., Zhong, Z., Bars, P., L., and Mounir, A.: TG3d Channel Modelling Document (CMD), in: IEEE 802.15 Document 15-14-0310-19-003d, IEEE P802.15 Wireless Personal Area Networks, Macau, 1–61, 2016. a
German weather service: Weather data, available at: https://www.dwd.de/EN/climate_environment/cdc/cdc_node.html/, last access: 7 April 2021. a
GSM Association: Mobile backhaul options Spectrum analysis and recommendations, available at: https://www.gsma.com/spectrum/resources/mobile-backhaul-options/ (last access: 7 April 2021), 2018. a
IEEE Std 802.15.3d: IEEE Standard for High Data Rate Wireless Multi-Media Networks–Amendment 2: 100 Gb/s Wireless Switched Point-to-Point Physical Layer, IEEE Std 802.15.3d-2017 (Amendment to IEEE Std 802.15.3-2016 as amended by IEEE Std 802.15.3e-2017), IEEE Computer Society, New York, 1–55, https://doi.org/10.1109/IEEESTD.2017.8066476, 2017. a, b, c
ITU-R F.1245-3: Mathematical model of average and related radiation patterns for point-to-point fixed wireless system antennas for use in interference assessment in the frequency range from 1 GHz to 86 GHz, International Telecommunications Union, Geneva, 2019. a
ITU-R F.699-8: Reference radiation patterns for fixed wireless system antennas for use in coordination studies and interference assessment in the frequency range from 100 MHz to 86 GHz, International Telecommunications Union, Geneva, 2016. a
ITU-R P.676-12: Attenuation by atmospheric gases and related effects, International Telecommunications Union, Geneva, 2019. a
ITU-R P.838-3: Specific attenuation model for rain for use in prediction methods, International Telecommunications Union, Geneva, 2005. a, b
ITU-R P.840-8: Attenuation due to clouds and fog, International Telecommunications Union, Geneva, 2019. a
Jung, B. K., Dreyer, N., Eckhard, J. M., and Kürner, T.: Simulation and Automatic Planning of 300 GHz Backhaul Links, in: 2019 44th International Conference on Infrared, Millimeter, and Terahertz Waves (IRMMW-THz), 1–6 September, Paris, 1–3, https://doi.org/10.1109/IRMMW-THz.2019.8873734, 2019. a
Jung, B. K., Herold, C., Eckhard, J. M., and Kürner, T.: Link-Level and System-Level Simulation of 300 GHz wireless Backhaul Links, in: 2020 International Symposium on Antennas and Propagation (ISAP), 25–28 January, Osaka, 1–2, 2021. a
Kürner, T., Hirata, A., Jung, B. K., Sasaki, E., Jurcik, P., and Kawanishi, T.: Towards Propagation and Channel Models for the Simulation and Planning of 300 GHz Backhaul/Fronthaul Links, in: 2020 XXXIIIrd General Assembly and Scientific Symposium of the International Union of Radio Science, 29 August–5 September, Rome, 1–4, https://doi.org/10.23919/URSIGASS49373.2020.9232186, 2020. a
Rose, D. M., Baumgarten, J., Hahn, S., and Kurner, T.: SiMoNe – Simulator for Mobile Networks: System-Level Simulations in the Context of Realistic Scenarios, in: 2015 IEEE 81st Vehicular Technology Conference (VTC Spring), 11–14 May, Glasgow, 1–7, https://doi.org/10.1109/VTCSpring.2015.7146084, 2015. a
Tetens, O.: Über einige meteorologische Begriffe, Zeitschrift für geophysik, Friedrich Vieweg & Sohn Akt.-Gesellschaft, available at: https://books.google.de/books?id=ey5UtAEACAAJ (last access: 18 May 2021), 1930. a
Thales group: Building a 5G world we can all trust, available at: https://www.thalesgroup.com/en/markets/digital-identity-and-security/mobile/5G-challenges (last access: 7 April 2021), 2018. a
ThoR D2.4: Definition of Scenarios for Demonstration and Simulation, available at: https://thorproject.eu/wp-content/uploads/2019/07/ThoR_TUBS_190522_A_WP6-D2.4-Scenarios-for-demo-and-simulation.pdf (last access: 7 April 2021), 2019. a, b
ThoR D5.2: Preliminary antenna, propagation and channel models, available at: https://thorproject.eu/wp-content/uploads/2021/02/ThoR-D5.2-Preliminary-antenna-propagation-and-channel-models.pdf (last access: 7 April 2021), 2019. a, b, c
ThoR website: TeraHertz end-to-end wireless systems supporting ultra high data Rate applications, available at: https://thorproject.eu/, last access: 7 April 2021. a