 | 17 Dec 2021
Road Surface Characteristics for the Automotive 77 GHz Band
Vera Kurz
Hannes Stuelzebach
Florian Pfeiffer
Carlo van Driesten
Erwin Biebl
In order to achieve a safety proof of autonomous driving using simulations, information about the environment has to be determined, which is not sufficiently available until now. This work is concerned with road surfaces and their scattering of radar signals. As it is not enough to look at geometries, as it is already done for many ray tracing approaches, also material and composition have to be investigated. Therefore, measurements are performed using a SAR setup in a laboratory as well as open space measurements using a radar evaluation board on a testing area of the Federal Highway Research Institute. The SAR setup enables a quick estimation on differences in reflection of different test objects. With the result from the latter values for the relative permittivity are calculated for different road surface types exploiting Fresnel's equations. The differences in reflection depending on material and surface structure of the road see in the measurements of both setups are discussed in the paper.
- Article
(6341 KB) - Full-text XML
- BibTeX
- EndNote


Autonomous driving is one of the technologically most important topics of the future. Automobile manufacturers from all over the world are competing to be the first to achieve breakthrough progress. However, not only technical aspects like the development of lane keep assist (LKA) or autonomous emergency breaking (AEB) have to be considered, but also legal aspects. In Germany for example the road traffic act (StVG) was changed in 2017, which clarifies basic questions about driving cars with highly and fully automated driving functions. The changes are established by Deutscher Bundestag (2017). But even so, aspects remain unresolved. Therefore, a legally profound safety proof of autonomously driving vehicles is a burning issue to provide a basis for a more far-reaching legal decision. One point, on which experts agree, is that it will not be possible to provide one without resorting to simulations to some point (Winner, 2018). In order to set ones up it is necessary to have information about the surrounding of the traffic participants.
Simulations can be done in various different manners. A popular approach is using ray tracing algorithms. For example Wald and Weinmann (2019) propose two methods to generate synthetic scattered field strength data for automotive simulations. These approaches use geometry information to obtain a ray propagation path. But this is not always sufficient as attenuation effects are different depending on the material of the impinged surface as well.
20 years ago Li and Sarabandi (1999) and Sarabandi et al. (1997) already analyzed microwave scattering on roads at 94 GHz. But their investigations are limited to the laboratory and the analyzed frequency is not in the automotive band.
One common measurement method to analyze surfaces is using a synthetic aperature radar (SAR). The principle of SAR is that by moving a small antenna and always knowing its position a bigger synthetic antenna can be realized (Richards, 2014). It is already applied on road surfaces in other context. So Babu and Baumgartner (2020) use a SAR setup to assess the condition of road surfaces monitoring its roughness as well as roadway damage. Although this allows a statement to be made about the roughness of a road, this deals with larger irregularities than those that are discussed here.
Schneider et al. (2000) however determine the impact of a road surface considering all road surface types as equal in their impact on the automotive radar road scattering. Even a relative permittivity is calculated. This work is very popular and commonly referenced for building up simulations and models. But when using currently available simulators and models, it is noticeable that satisfactory results have not yet been achieved. Therefore, the radar scattering of road surfaces is investigated in more detail in the following in the laboratory as well as on a free space measurement area.
In the laboratory a SAR setup was used to analyze various drill core samples. The samples cover the different road surfaces used on German freeways.
Despite the SAR measurements, measurements using a focus beam setup, that is described by Pfeiffer (2010), was performed. It was seen that the transmission through the 3–5 cm thick samples is highly attenuated. Due to the high roughness of the samples, this did not lead to any useful result and the setup was discarded as not being fit for the purpose. Nevertheless, this confirms that only the top layer with a typical thickness of 12 cm has an influence on the scattering.
2.1 Measurement setup
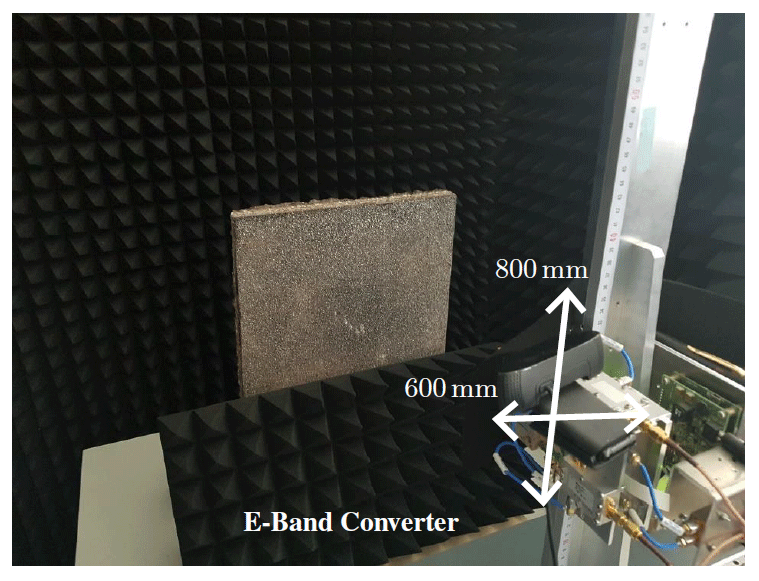
The drill cores are analyzed using a synthetic aperature radar with a synthetic aperature size of 800 mm × 600 mm. For this purpose, the RF frontend is mounted on a sliding table moving in x and z direction, what is depicted in Fig. 1. A full 3D radar image can be calculated using a back projection algorithm. As center frequency 76.7 GHz is selected and a bandwidth of 2 GHz is chosen. The setup offers 2 mm transversal resolution in near range and <0.2∘ angle resolution in far range. The sample is encircled with absorbers to erase outside influences. The mounting of the sample is shielded using an absorber as well. The specimen is positioned at a distance of about 34 cm, where the distance to the measured surface depends on the thickness of the DUT. In order to check, if a change in polarization changes the result of the measurements, the samples are rotated by 90∘ additionally. The setup is depicted in Fig. 2. A washer is placed on one side of the drill core samples to obtain a calibration point. The metallic washer is assumed to be fully reflecting.
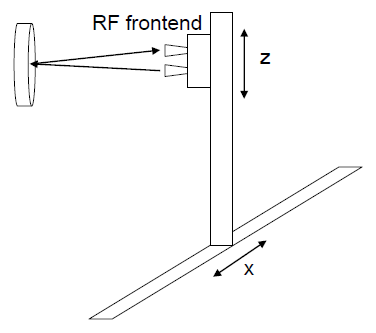
Figure 1Schematic of the SAR measurement setup showing antenna movement and wave propagation.
2.2 Drill core samples
Roads are made of different material mixtures depending on the requirements that a street has to fullfill. Therefore, a road surface is not equal to any other road surface. Main parameters are air content, material composition and stone size. So in the laboratory different drill core samples are analyzed. As at 77 GHz the ground penetration is low, it is sufficient to use the top layers. Scholz et al. (2011) give an overview of German road surfaces, their usage and their material composition. Additionally, asphalts causing only low noise are defined by Bayrische Staatskanzlei (2014). The drill cores were selected to cover the extremes of road surface differences using the above mentioned sources as basis for decision. This is mastix asphalt (MA), stone mastic asphalt (SMA), asphalt concrete (AC) and thin asphalt layers in hot application on sealant (DSH-V) or colloqually also called low noise asphalt. Beyond the surface type the blended maximum grain size is distinguished. The diameter is given by the number in the denotation in the unit millimeter. The final letter S or respectively DS is the abbreviation for heavy load, which represent the extreme values of surfaces. Figure 3 shows the resulting compilation of samples. The measurements were not performed using entire drill cores but only a top layer sample. This layer was prepared by the Centre for Building Materials of TU Munich, who sawed the cores into several slices. Thus, test objects were available, each with a realistic road surface and a smoothly sawn surface made of the same material. The measurements were conducted for both sides.
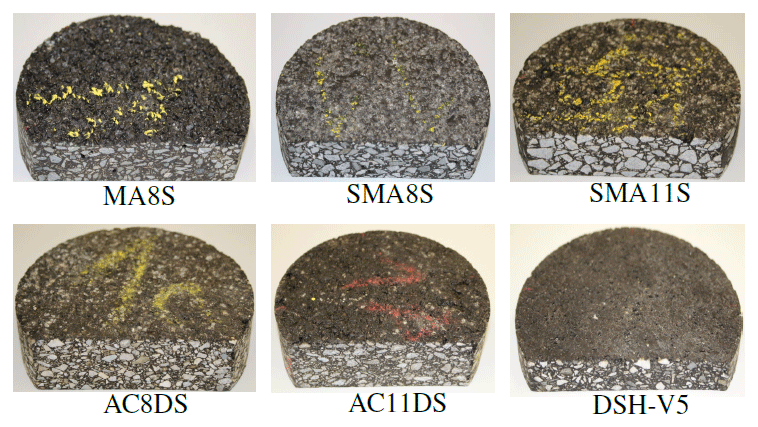
Figure 3Drill core samples, which represent the diversity of German highway surfaces (mastix asphalt, stone mastic asphalt, asphalt concrete and thin asphalt layers in hot application on sealant). Photograph source: authors.
2.3 Results
When comparing the front and back sides, one can first evaluate, how strong the differences in scattering due to geometry are. As expected one can see the unevenness of the samples in the attenuation map. The attenuation in the notches is higher for the rougher samples. This can be seen in Fig. 4, where front and back measurements are shown for the SMA11S. The elongated wave pattern at the lower edge comes from the fixture, the reflection of which is attenuated by an absorber. The bright ring top left is caused by the calibrating flat washer.
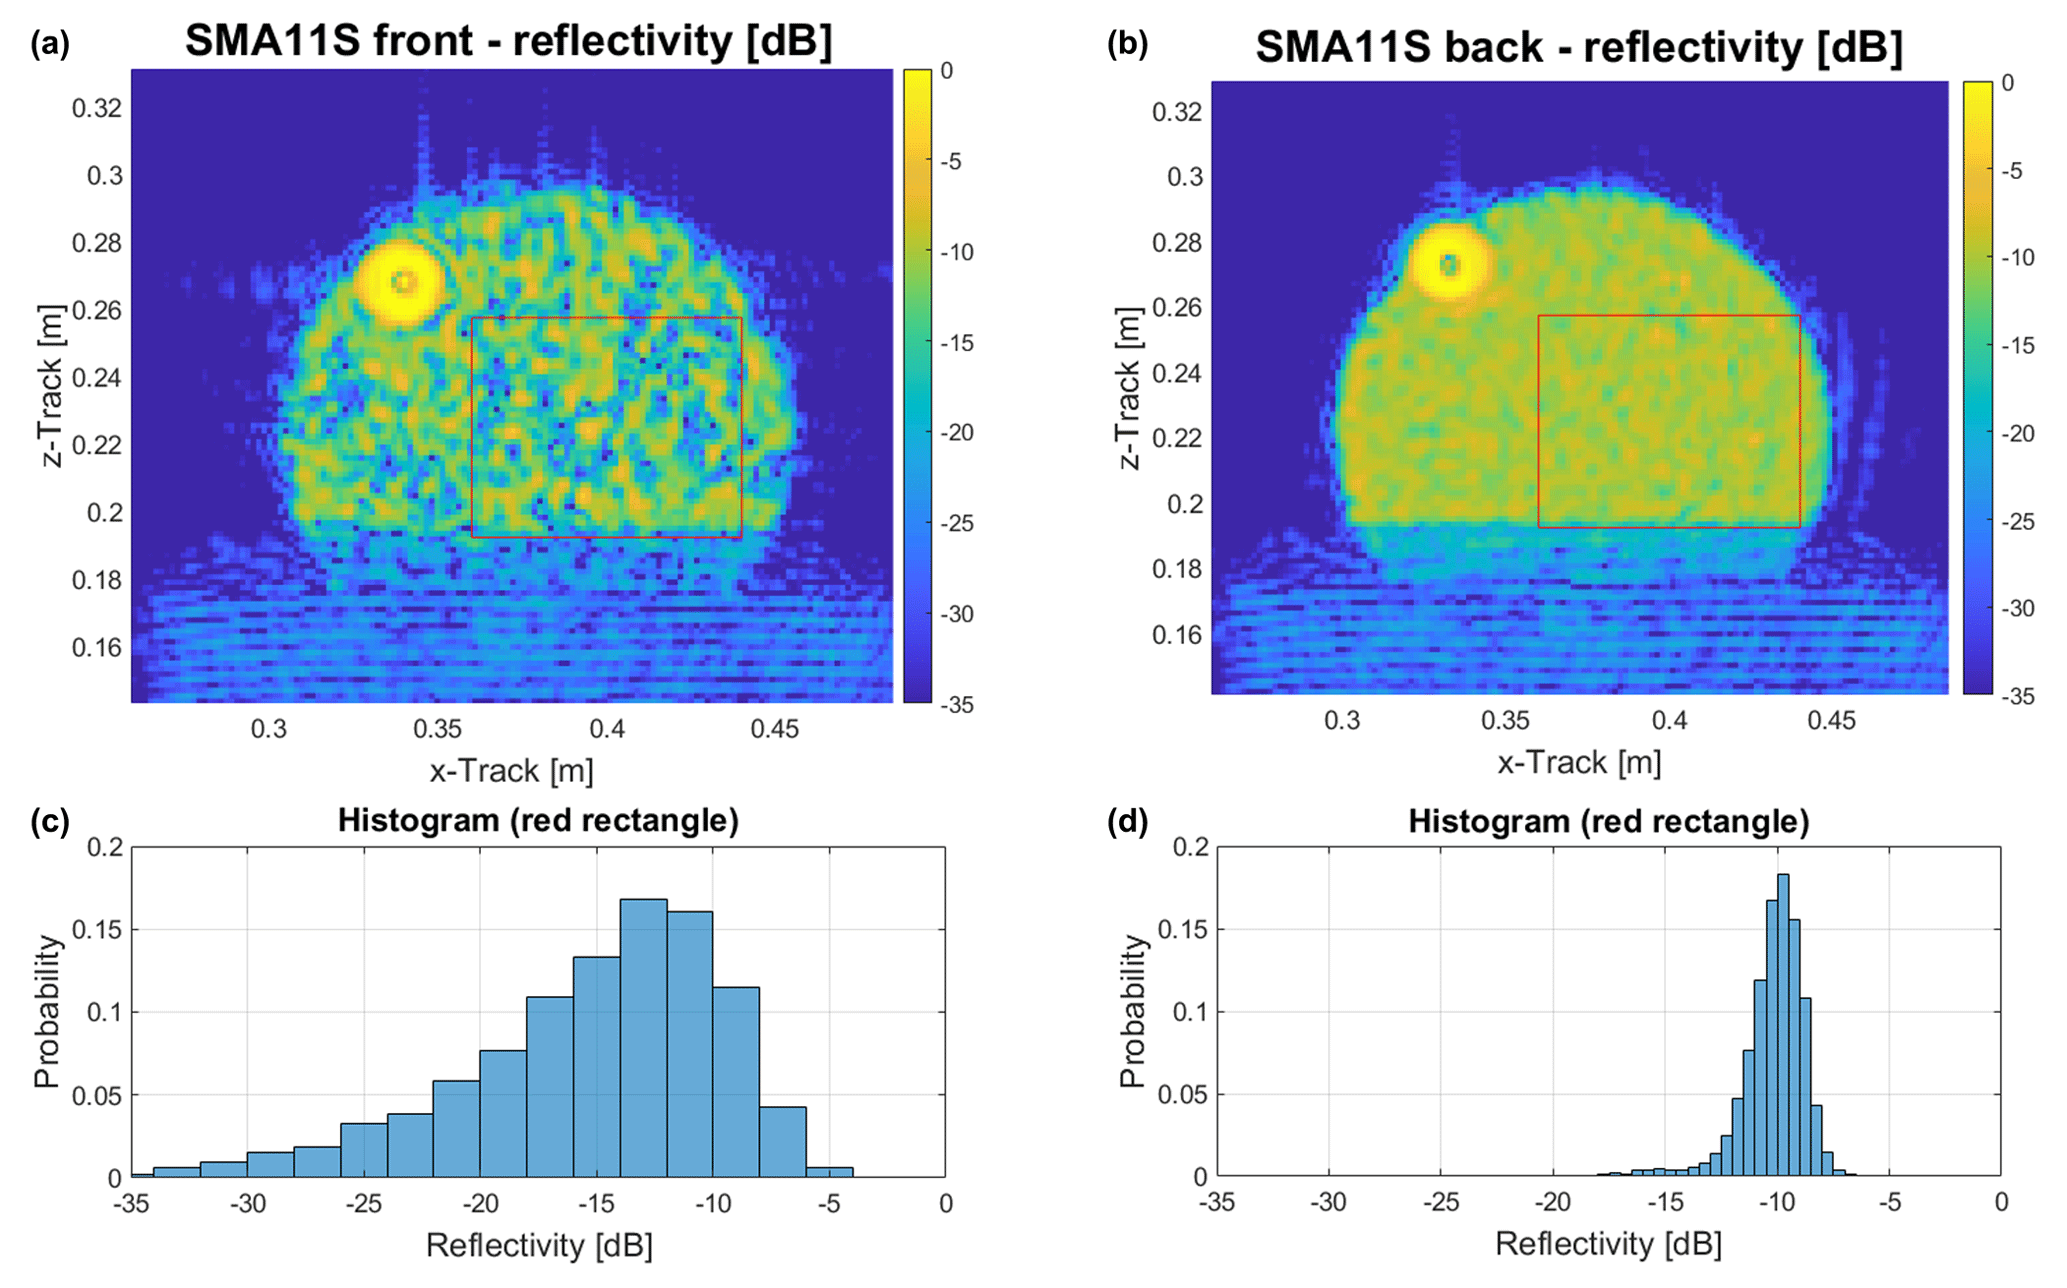
Figure 4SMA11S reflectivity measured on the front (rough surface) and on the back (smooth surface); the histograms on the bottom use the data in the red rectangle of the plot on the top.
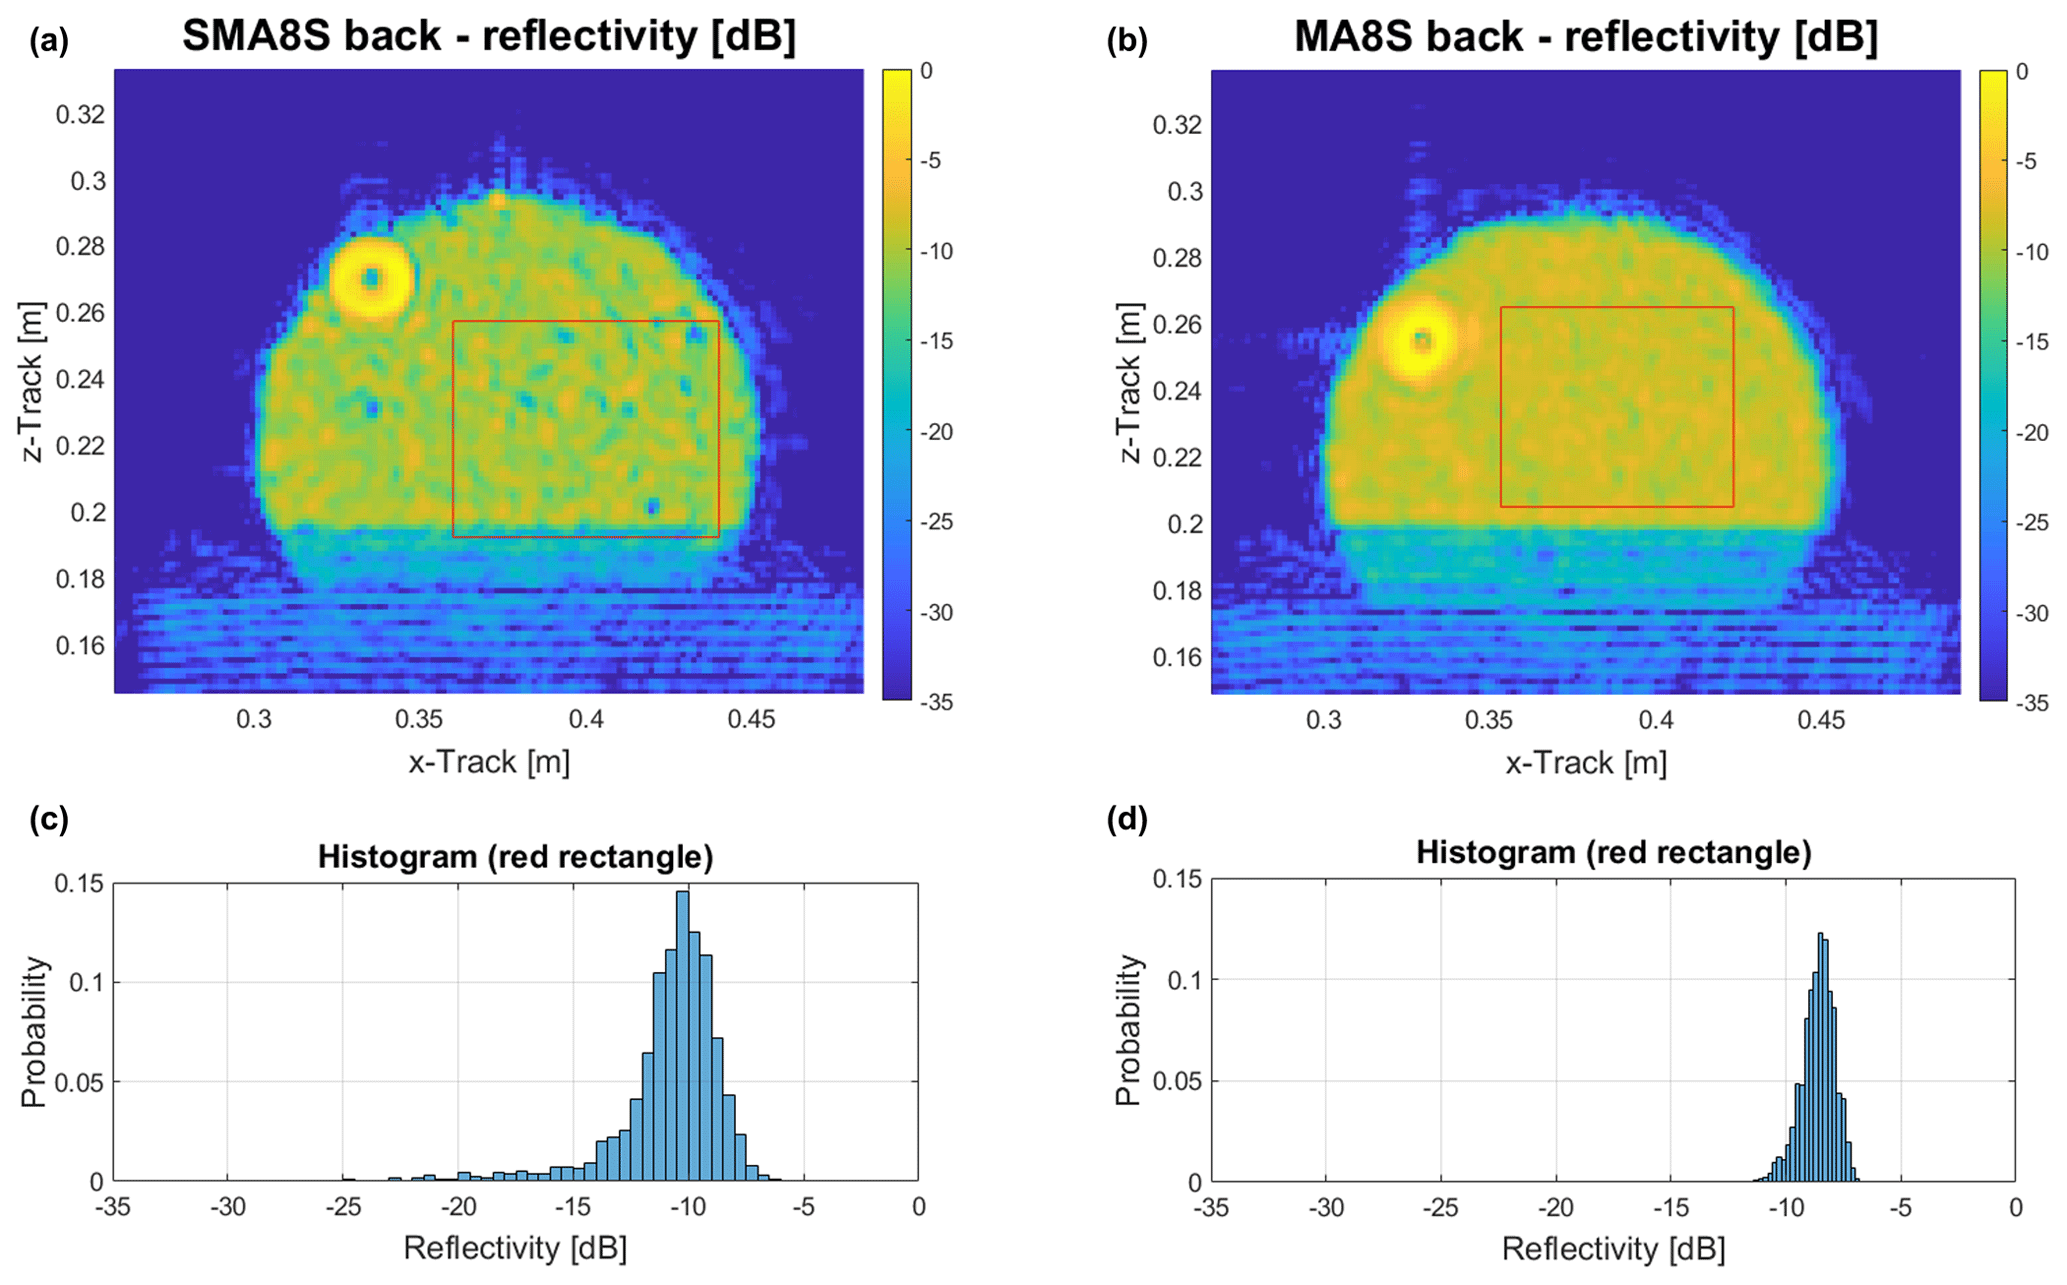
Figure 5Reflectivity measured on the back (smooth surface) for MA8S on the right and SMA8S on the left side; the histograms on the bottom use the data in the red rectangle of the plot on the top.
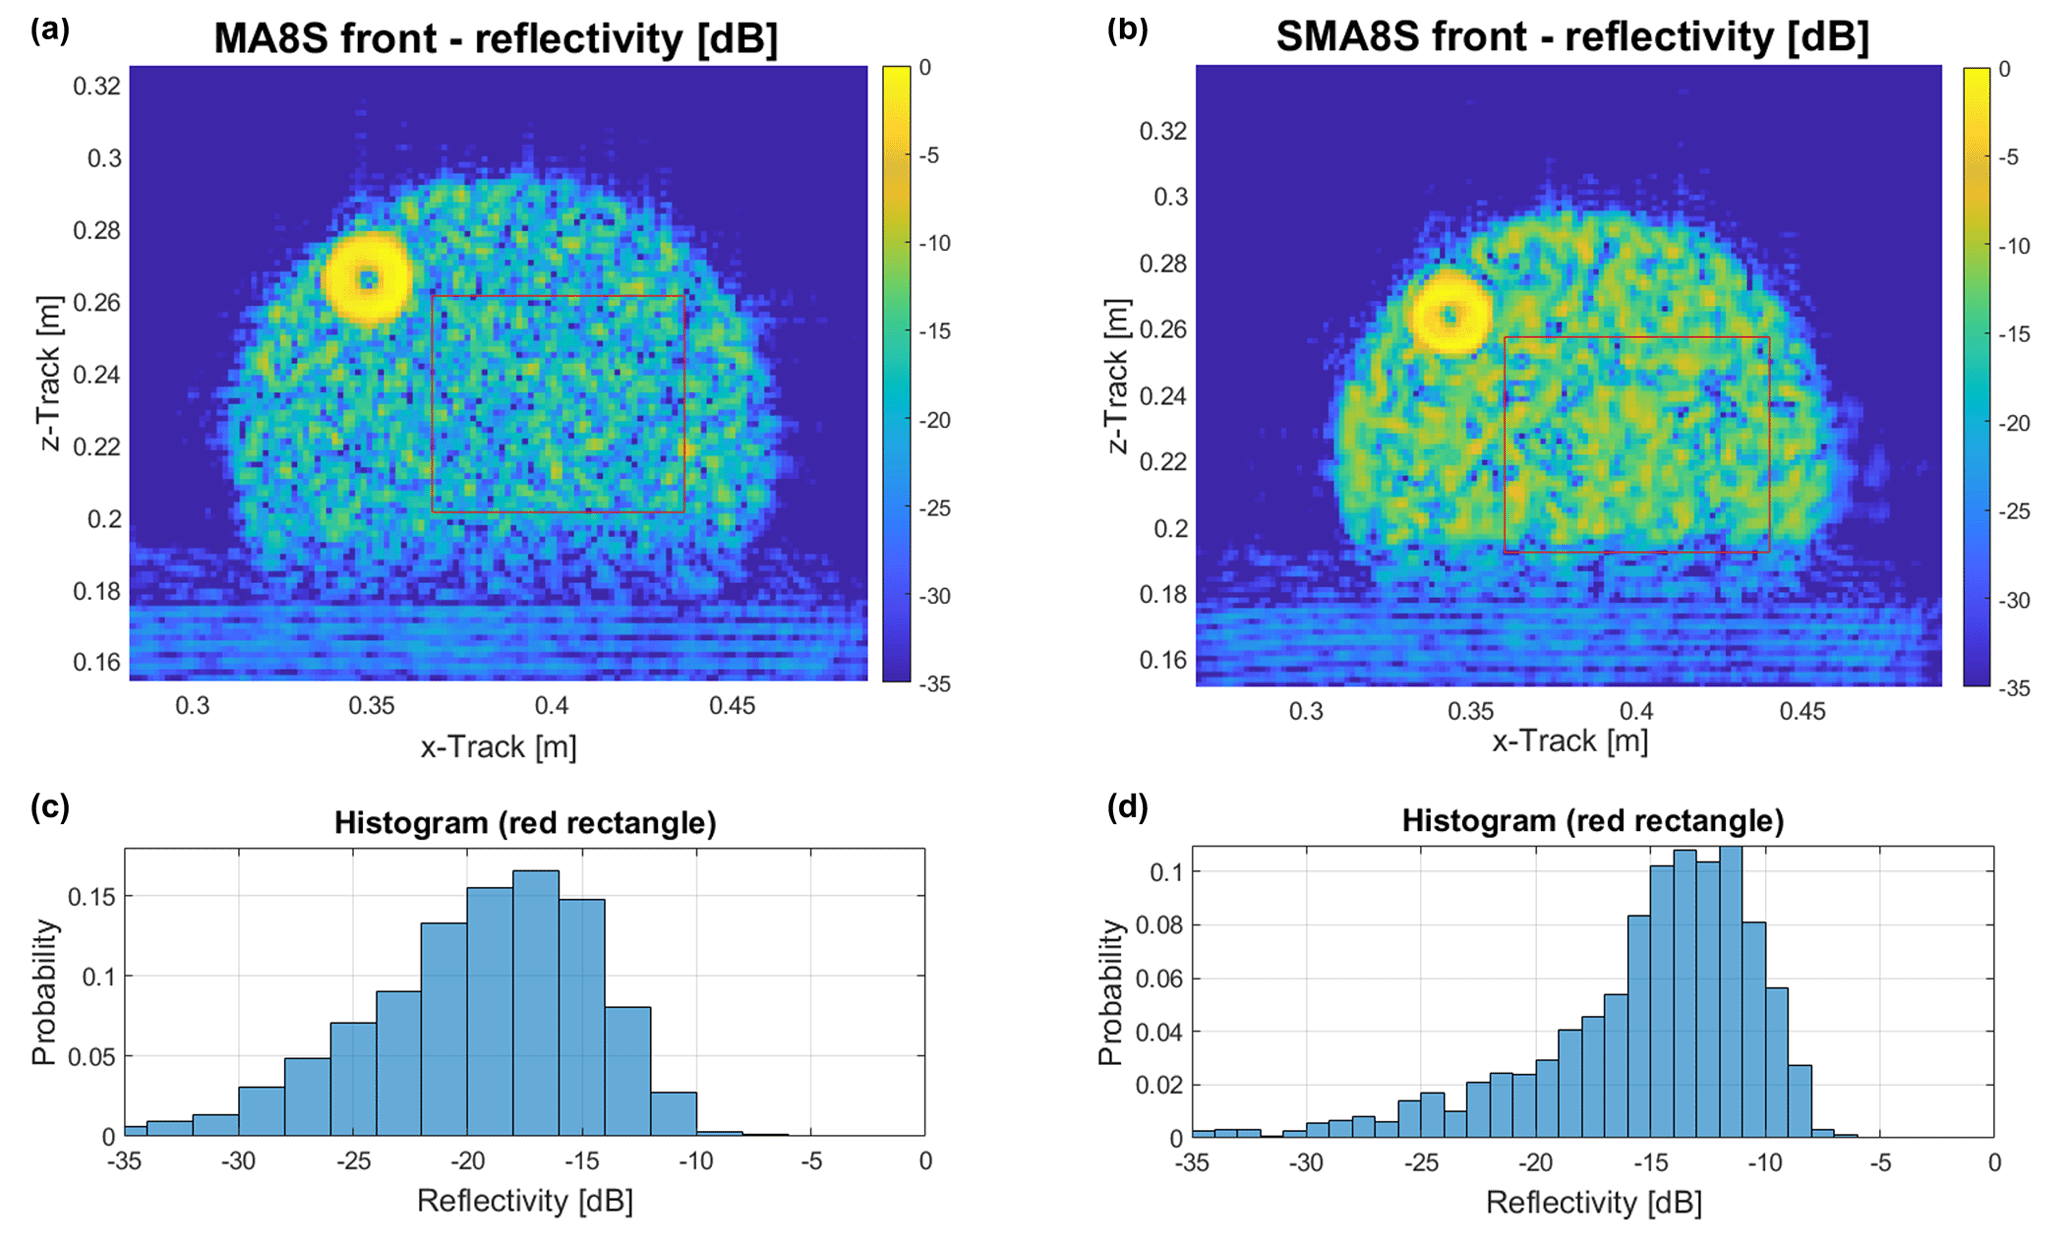
Figure 6Reflectivity measured on the front (rough surface) for MA8S on the left and SMA8S on the right side; the histograms on the bottom use the data in the red rectangle of the plot on the top.
The grain size shows a difference as well, when the surface roughness is not taken into account. A larger maximum grain size leads to a higher average reflection and a lower variance of reflection values. The difference can be seen comparing SMA11S in Fig. 4 on the right and SMA8S in Fig. 5 on the right. Some differences can also be seen in the material composition, which is depicted by the comparison of MA8S and SMA8S seen in Fig. 5. For this, the back side is considered in order to eliminate surface structure effects. The graphs shown here depict the range of the variation. The other samples show a reflectivity that is inbetween or similar to the results in Figs. 4 and 5. In addition to the individual effects, the total difference in reflection of different road samples can be observed like shown in Fig. 6. Differences can be observed for all samples with varying characteristic. The shown two probes MA8S and SMA8S are selected, as they are consisting of different material but having the same maximum grain size.
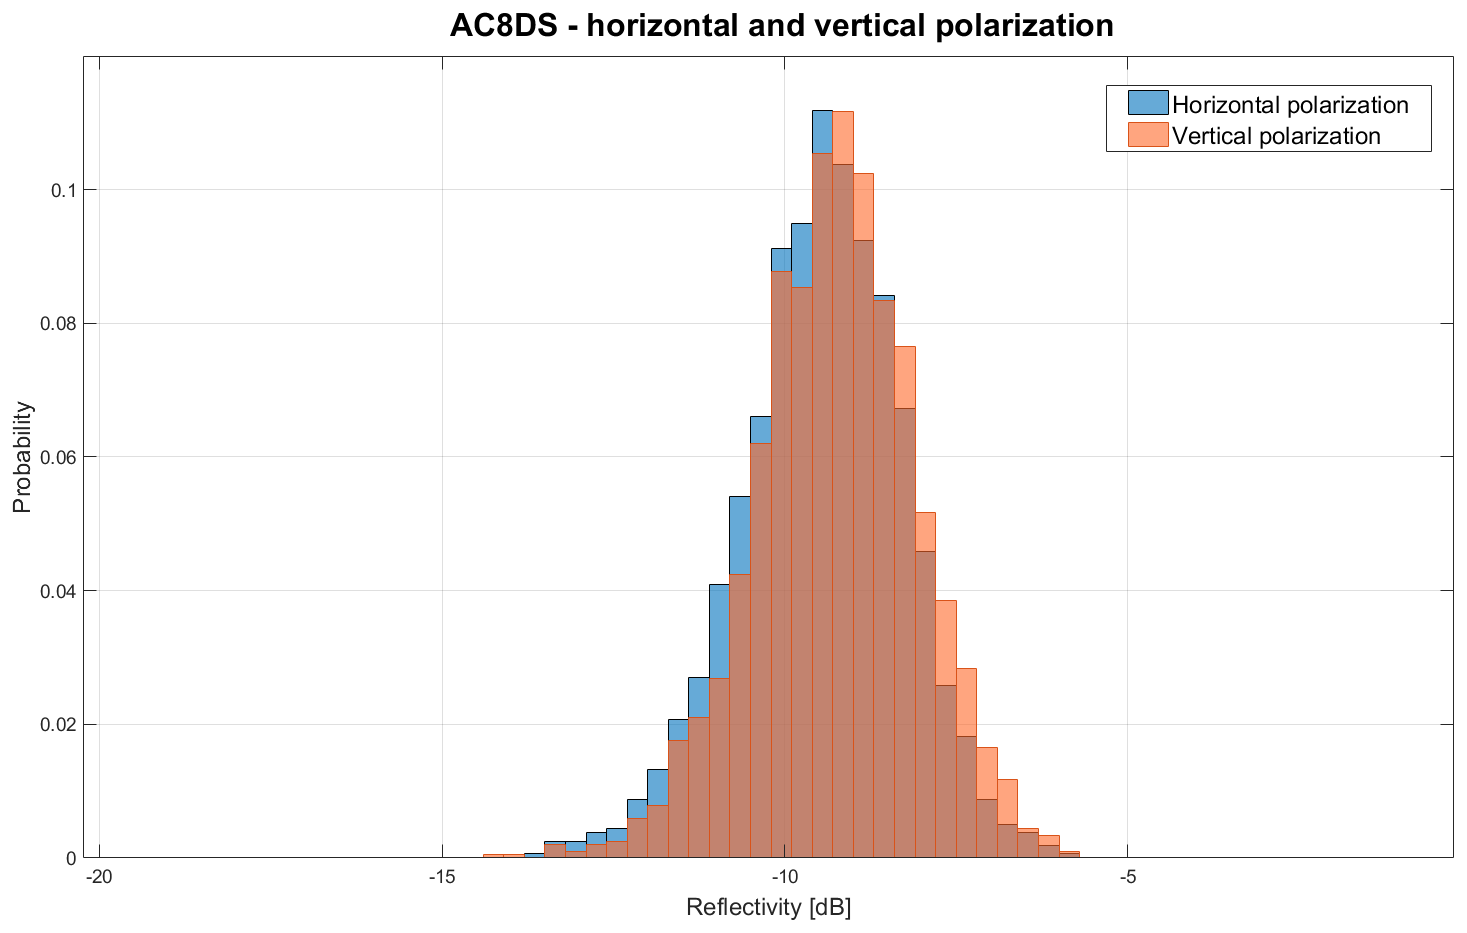
Figure 7Reflectivity for AC8DS measured with horizontal and vertical polarization evaluated in the same area (red rectangle) as in the previous figures.
Changing the polarization from horizontal to vertical polarization did not change the distribution noteworthily, but only the absolute position of attenuation peaks caused by the geometry. In the histogram, depicted in Fig. 7, an attenuation of the complete reflectivity distribution for AC8DS can be seen exemplarily. This matches the results of the investigation for other inciding angles is documented in Giallorenzo et al. (2018), where an attenuation was found when comparing horizontal and vertical polarization. However, the attenution is weaker for the here considered setup. This can be explained due to averaging effects caused by the SAR algorithm as well as due to the fact that the wave is incident perpendicularly on the test object in the SAR setup. These results are obtained by using a measurement setup with an incidence angle of 0∘ meaning 90∘ between the propagation direction of the wave and the tested surface. In a real-world scenario radar sensors are usually used for long range surveillance. Thus, this angle is rather small and an open space measurement covering these angles is necessary as a comparison in order to be able to make an informed conclusion.
As mentioned before, the SAR measurements provide a qualitative estimation on differences in road surface scattering. These can be carried out relatively quickly and inexpensively, so they can be used for a quick overview. However, the results are not sufficient for the use in automotive simulations and can therefore not replace the already validated open space measurements. These open space measurements were realized on the road test area “duraBASt” of the Federal Highway Research Institute (BASt). On the site several road surfaces are installed and precisely documented regarding installation, material and condition. Further information regarding this area can be found in BASt (2020).
3.1 Road surfaces
The surfaces on the test site are regularly replaced in order to carry out a wide variety of tests and are partially documented by long-term tests. Accordingly, the same road surfaces are not always available. The measurments were performed in november 2020. In that time the following surfaces were available for measurements:
-
asphalt concrete
-
split mastic asphalt with a maximum grain size of 8 mm
-
split mastic asphalt with a maximum grain size of 11 mm
-
self-healing asphalt
-
thin asphalt layers in hot application on sealant
-
Whisper concrete
-
concrete installed as factory made plate
-
concrete installed using broom finish technique
All surfaces are installed in such a way that possible other reflections can be avoided or filtered out.
3.2 Measurement setup
Kurz et al. (2019) already describe the measurement setup as well as the post-processing that is used to gain information about the road surfaces in the free space measurements. Only the used radar evaluation board was changed to the newer version, the TI AWR2243 BOOST (Texas Instruments, 2020). In short the radar board is put in front of a corner reflector on a certain road surface. For the open space measurements the properties of a corner reflector are exploited. In the received spectrum the direct path from sensor to target and back can be separated from the indirect path, which includes a reflection on the ground twice. The measurement is performed with the reflector aligned with the sensor and afterwards aligned with the reflection point on the ground. Afterwards the radar equation (Skolnik, 2001) and Fresnel's equations (Hecht, 2009) are used to calculate a relative permittivity by
with
for a vertical polarization. In this equation ρ is the amplitude reflection coefficient, Θ the angle of reflection and m the refraction index of air.
For a calibration between the measurements an aluminium plate is put in between as well as absorbers in additional measurements. Using the absorber plate eliminates the multipath of the measurement. Thus, it can be excluded that the multipath is not the reflection on the ground but caused by any other reflection in the surrounding. For the metal plate the reflectivity is known, so all measurment results can be related to that value. Both devices have to be big enough to cover the incidence area of the wave, where the reflected wave hits the corner reflector afterwards. To estimate the roughness of a surface, the Kaufmann method, like DIN (2010) describes, can be exploited. Here roughness means the average difference in surface height. The measurement itself is already used and described in Kurz et al. (2019). The Rayleigh criterion (Rees, 1993), determining at which angle a surface is smooth, then makes it possible to evaluate it from an electromagnetic point of view. The setup on the measurement area is shown in Fig. 8. All measurements are performed several times to exclude coincidences.
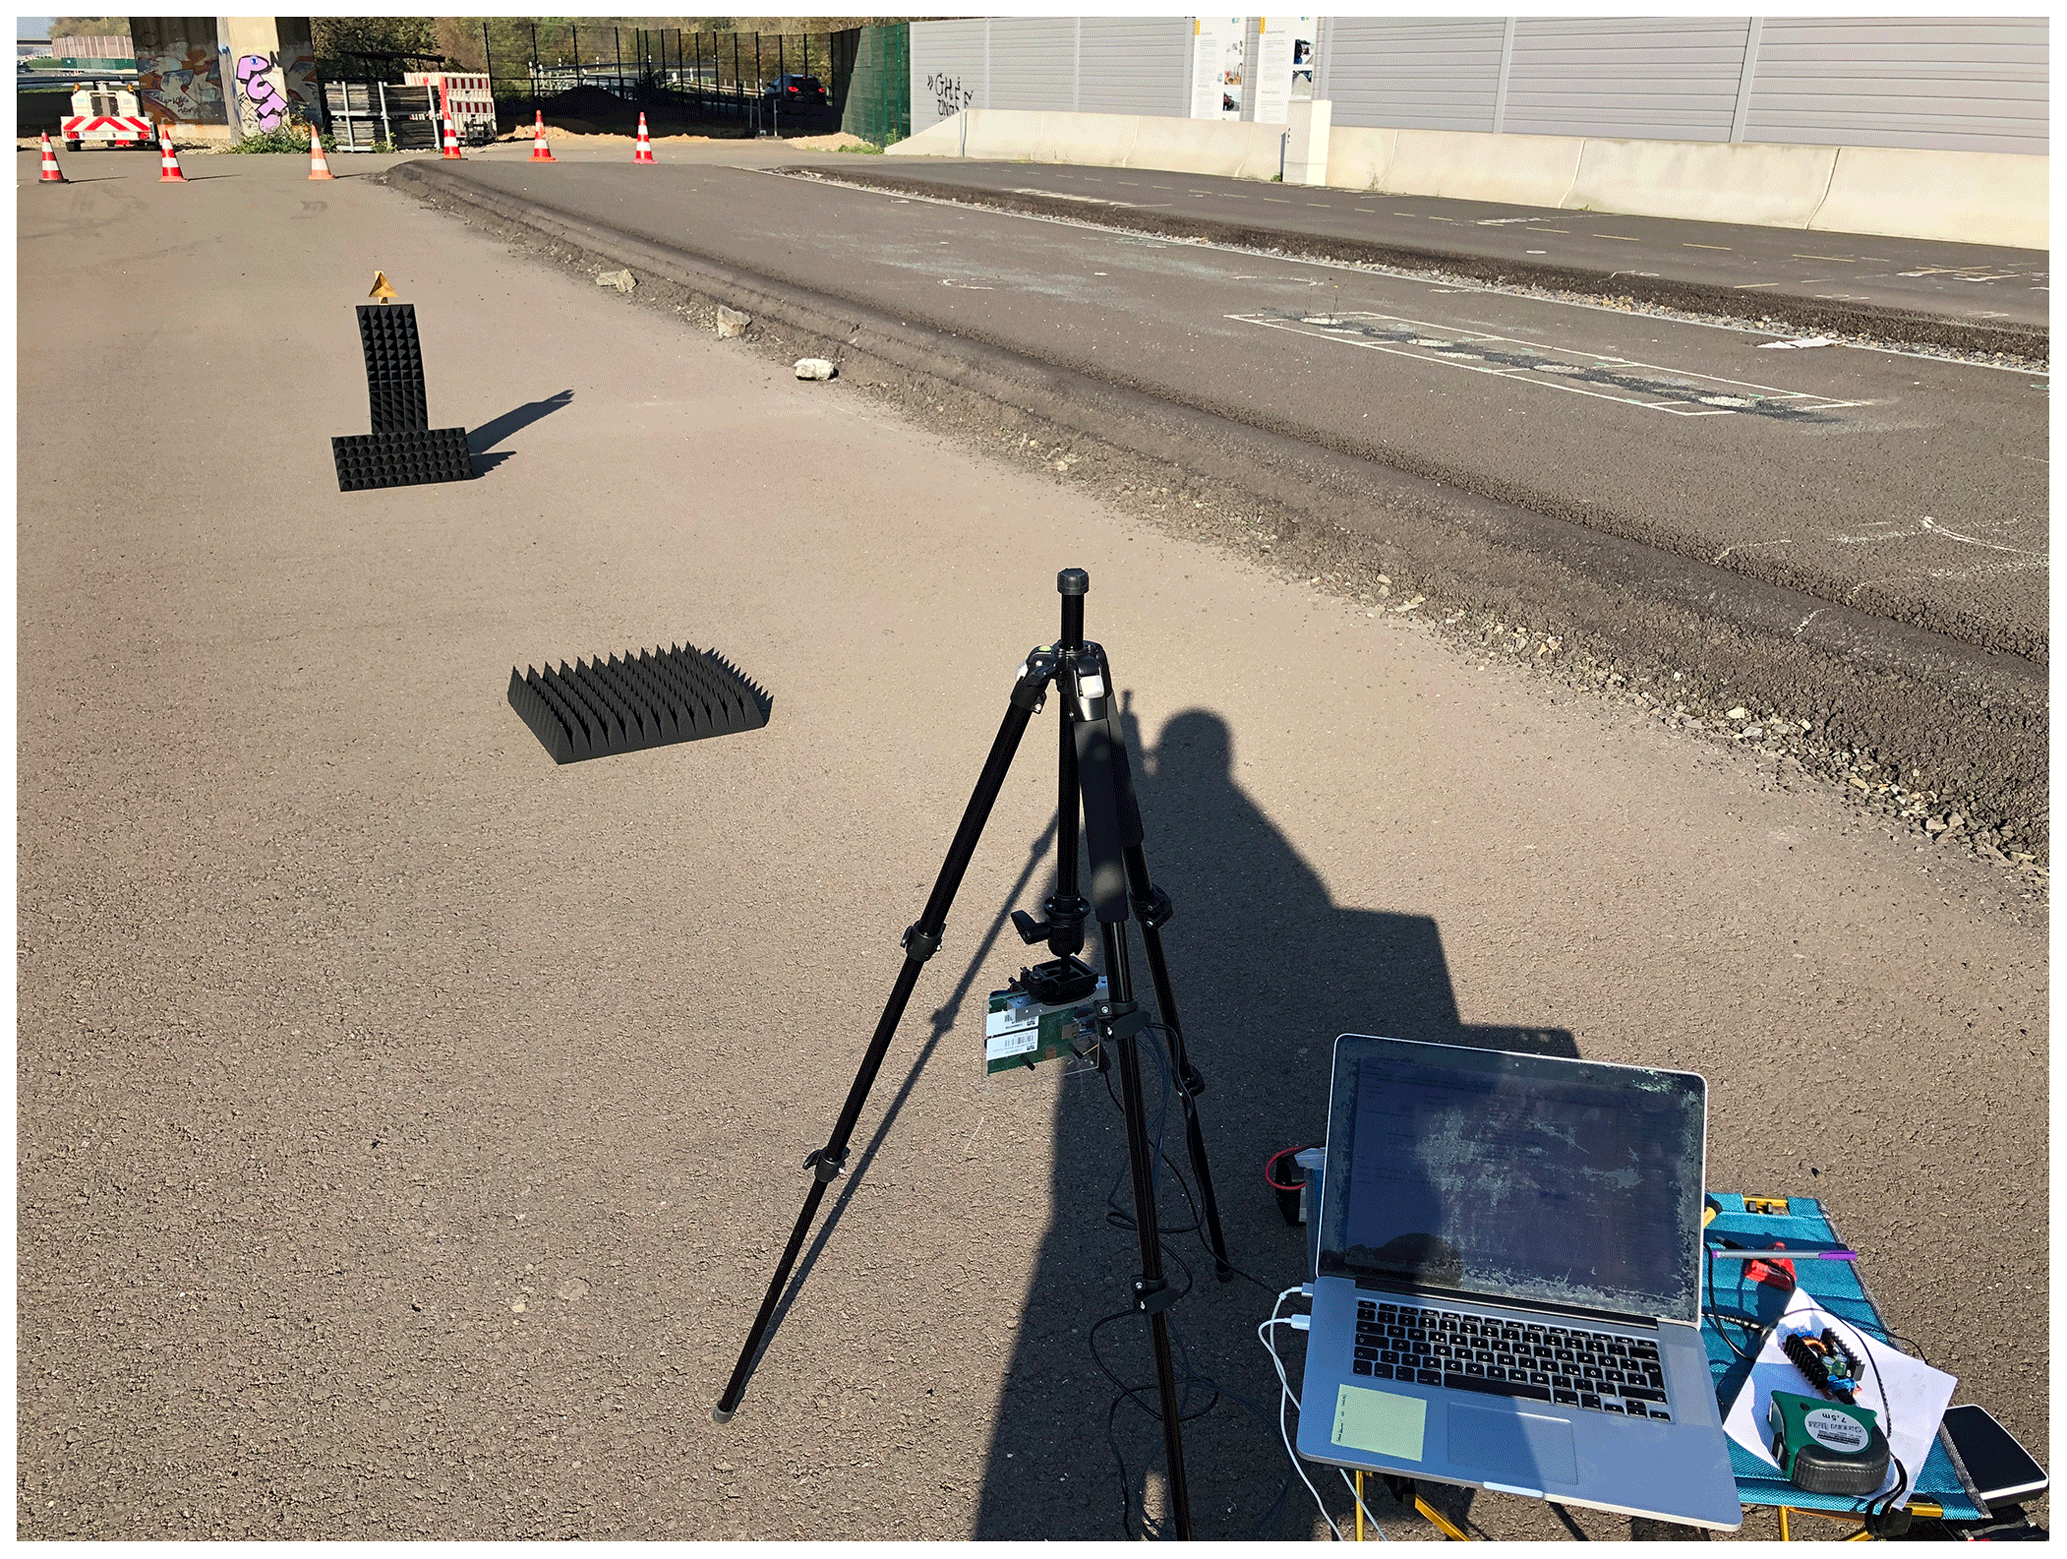
Figure 8Measurement setup on the asphalt concrete surface at durabast with an absorber plate in the middle; the lane to the right consists of the self-healing asphalt. Photograph source: authors.
3.3 Results
Applying the before mentioned Kaufmann method at first, the average roughness of the road surfaces can be determined. The results are shown in Table 1.
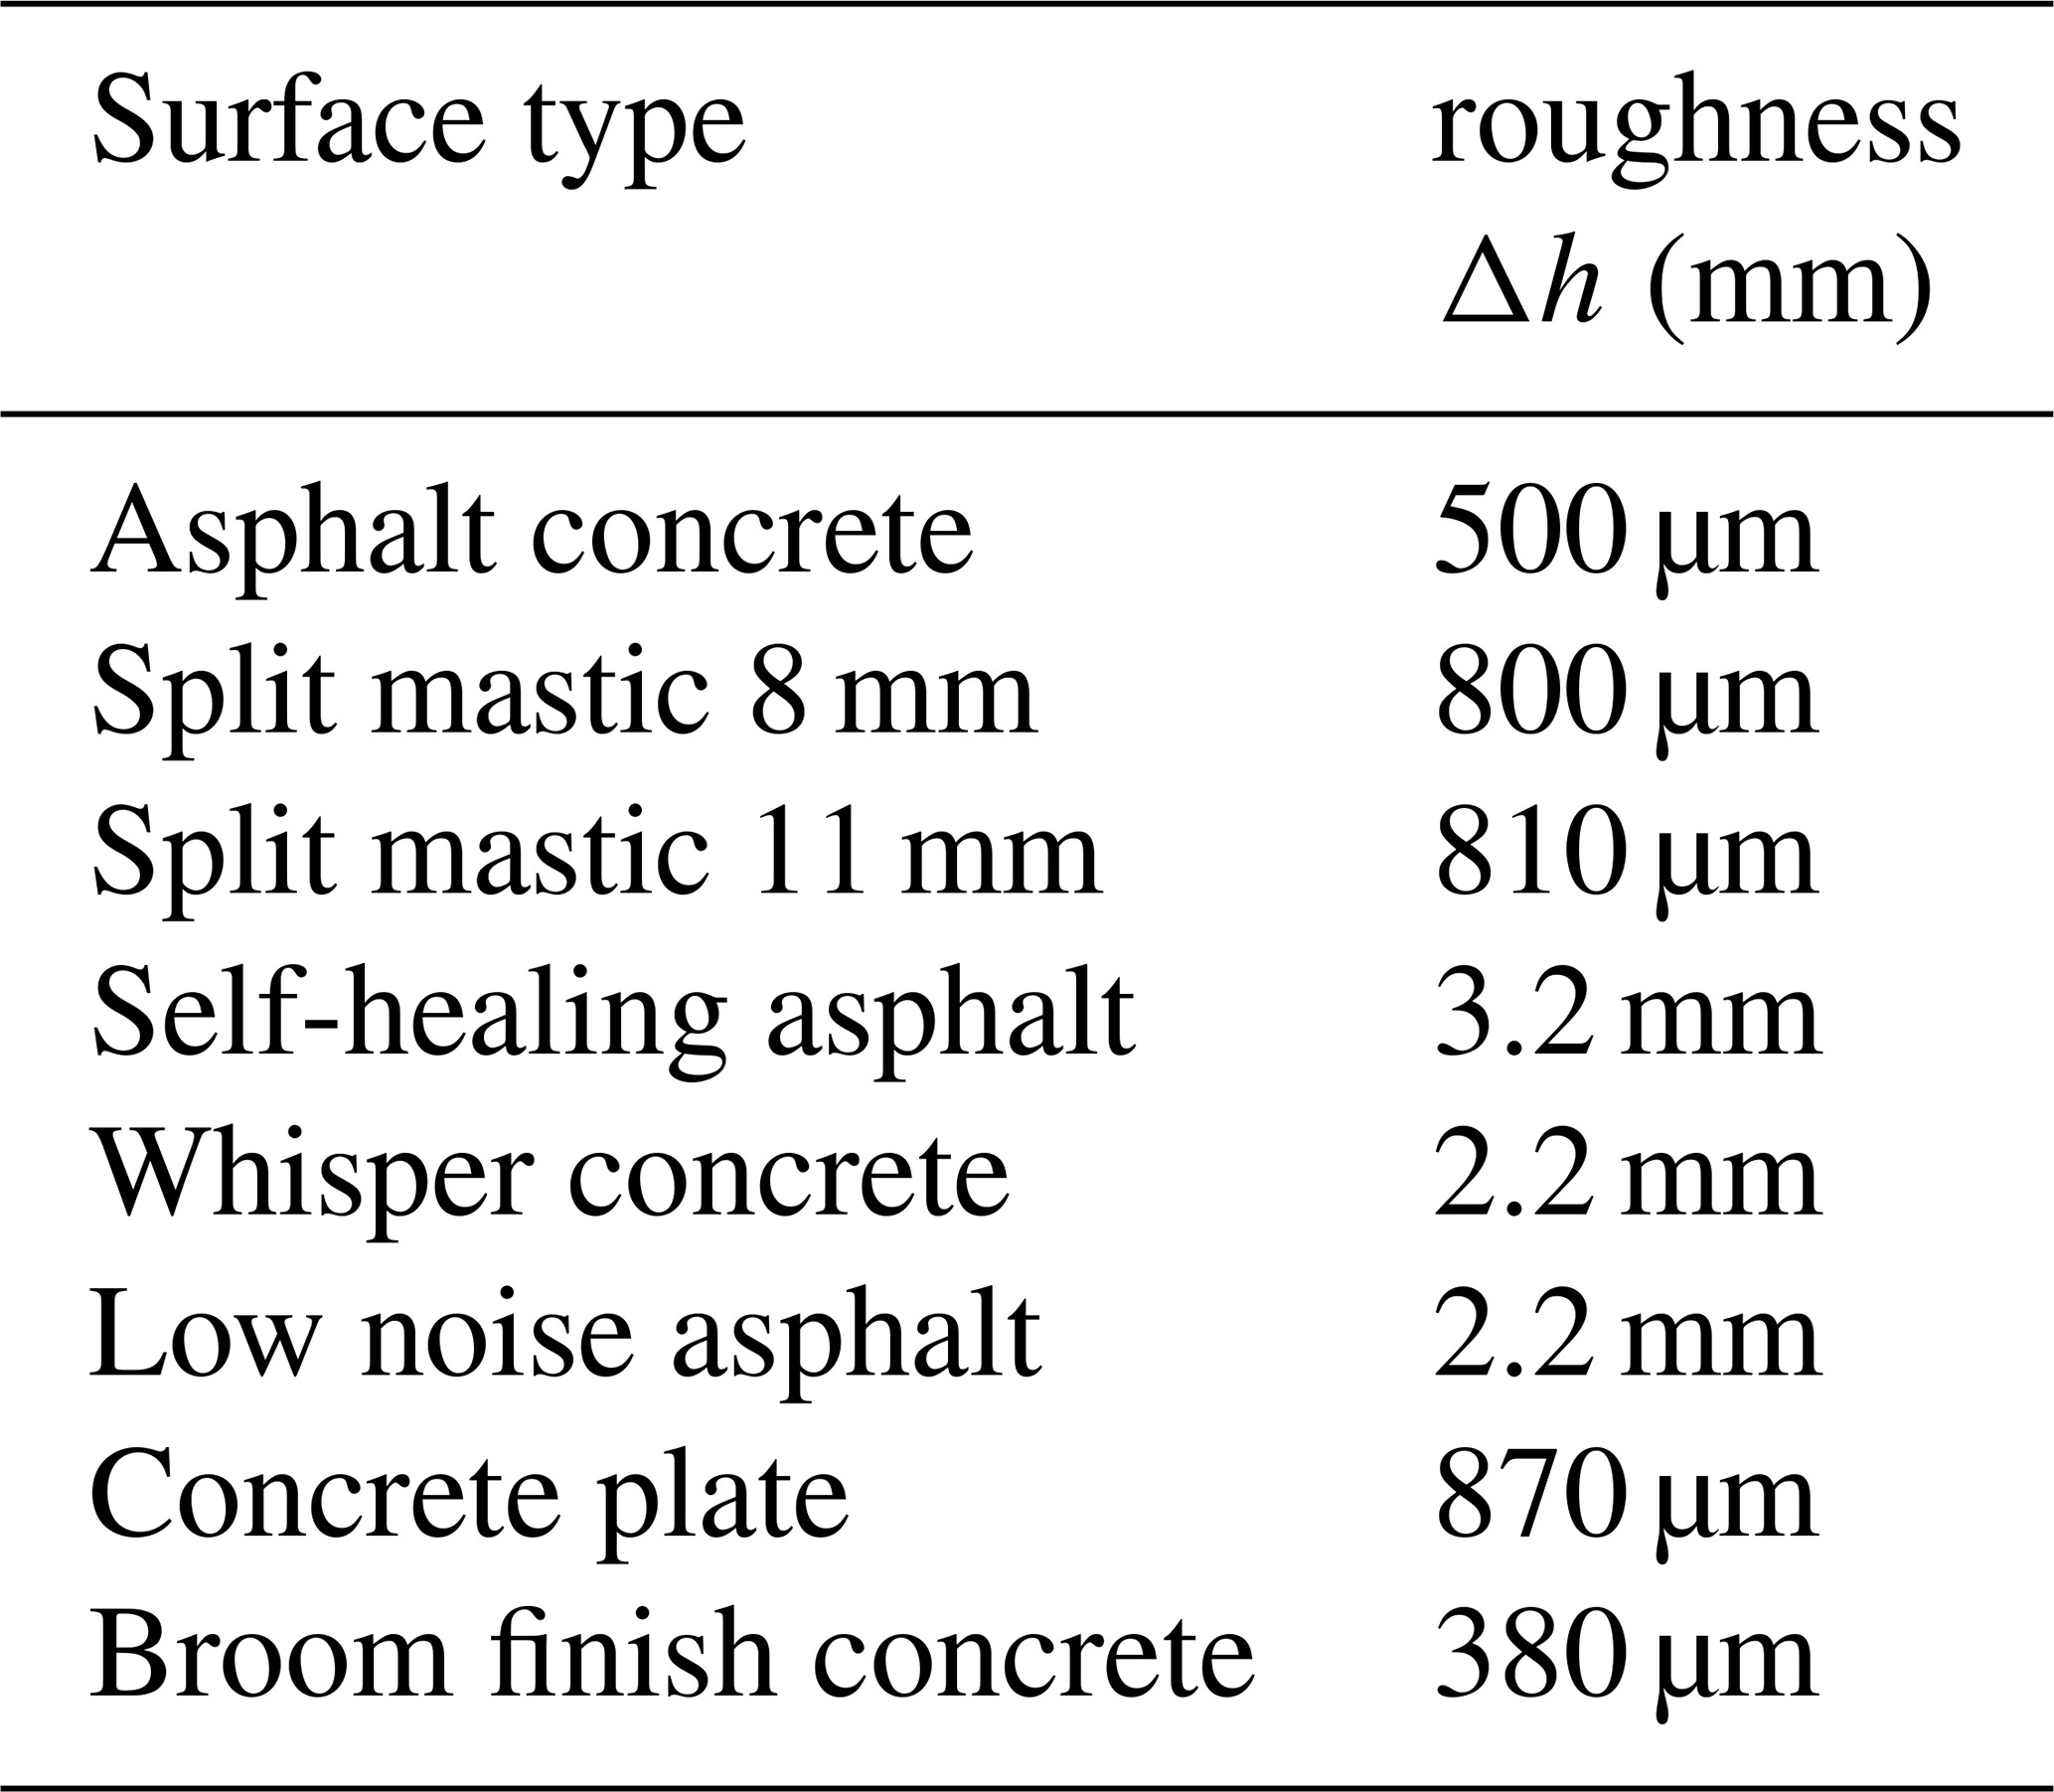
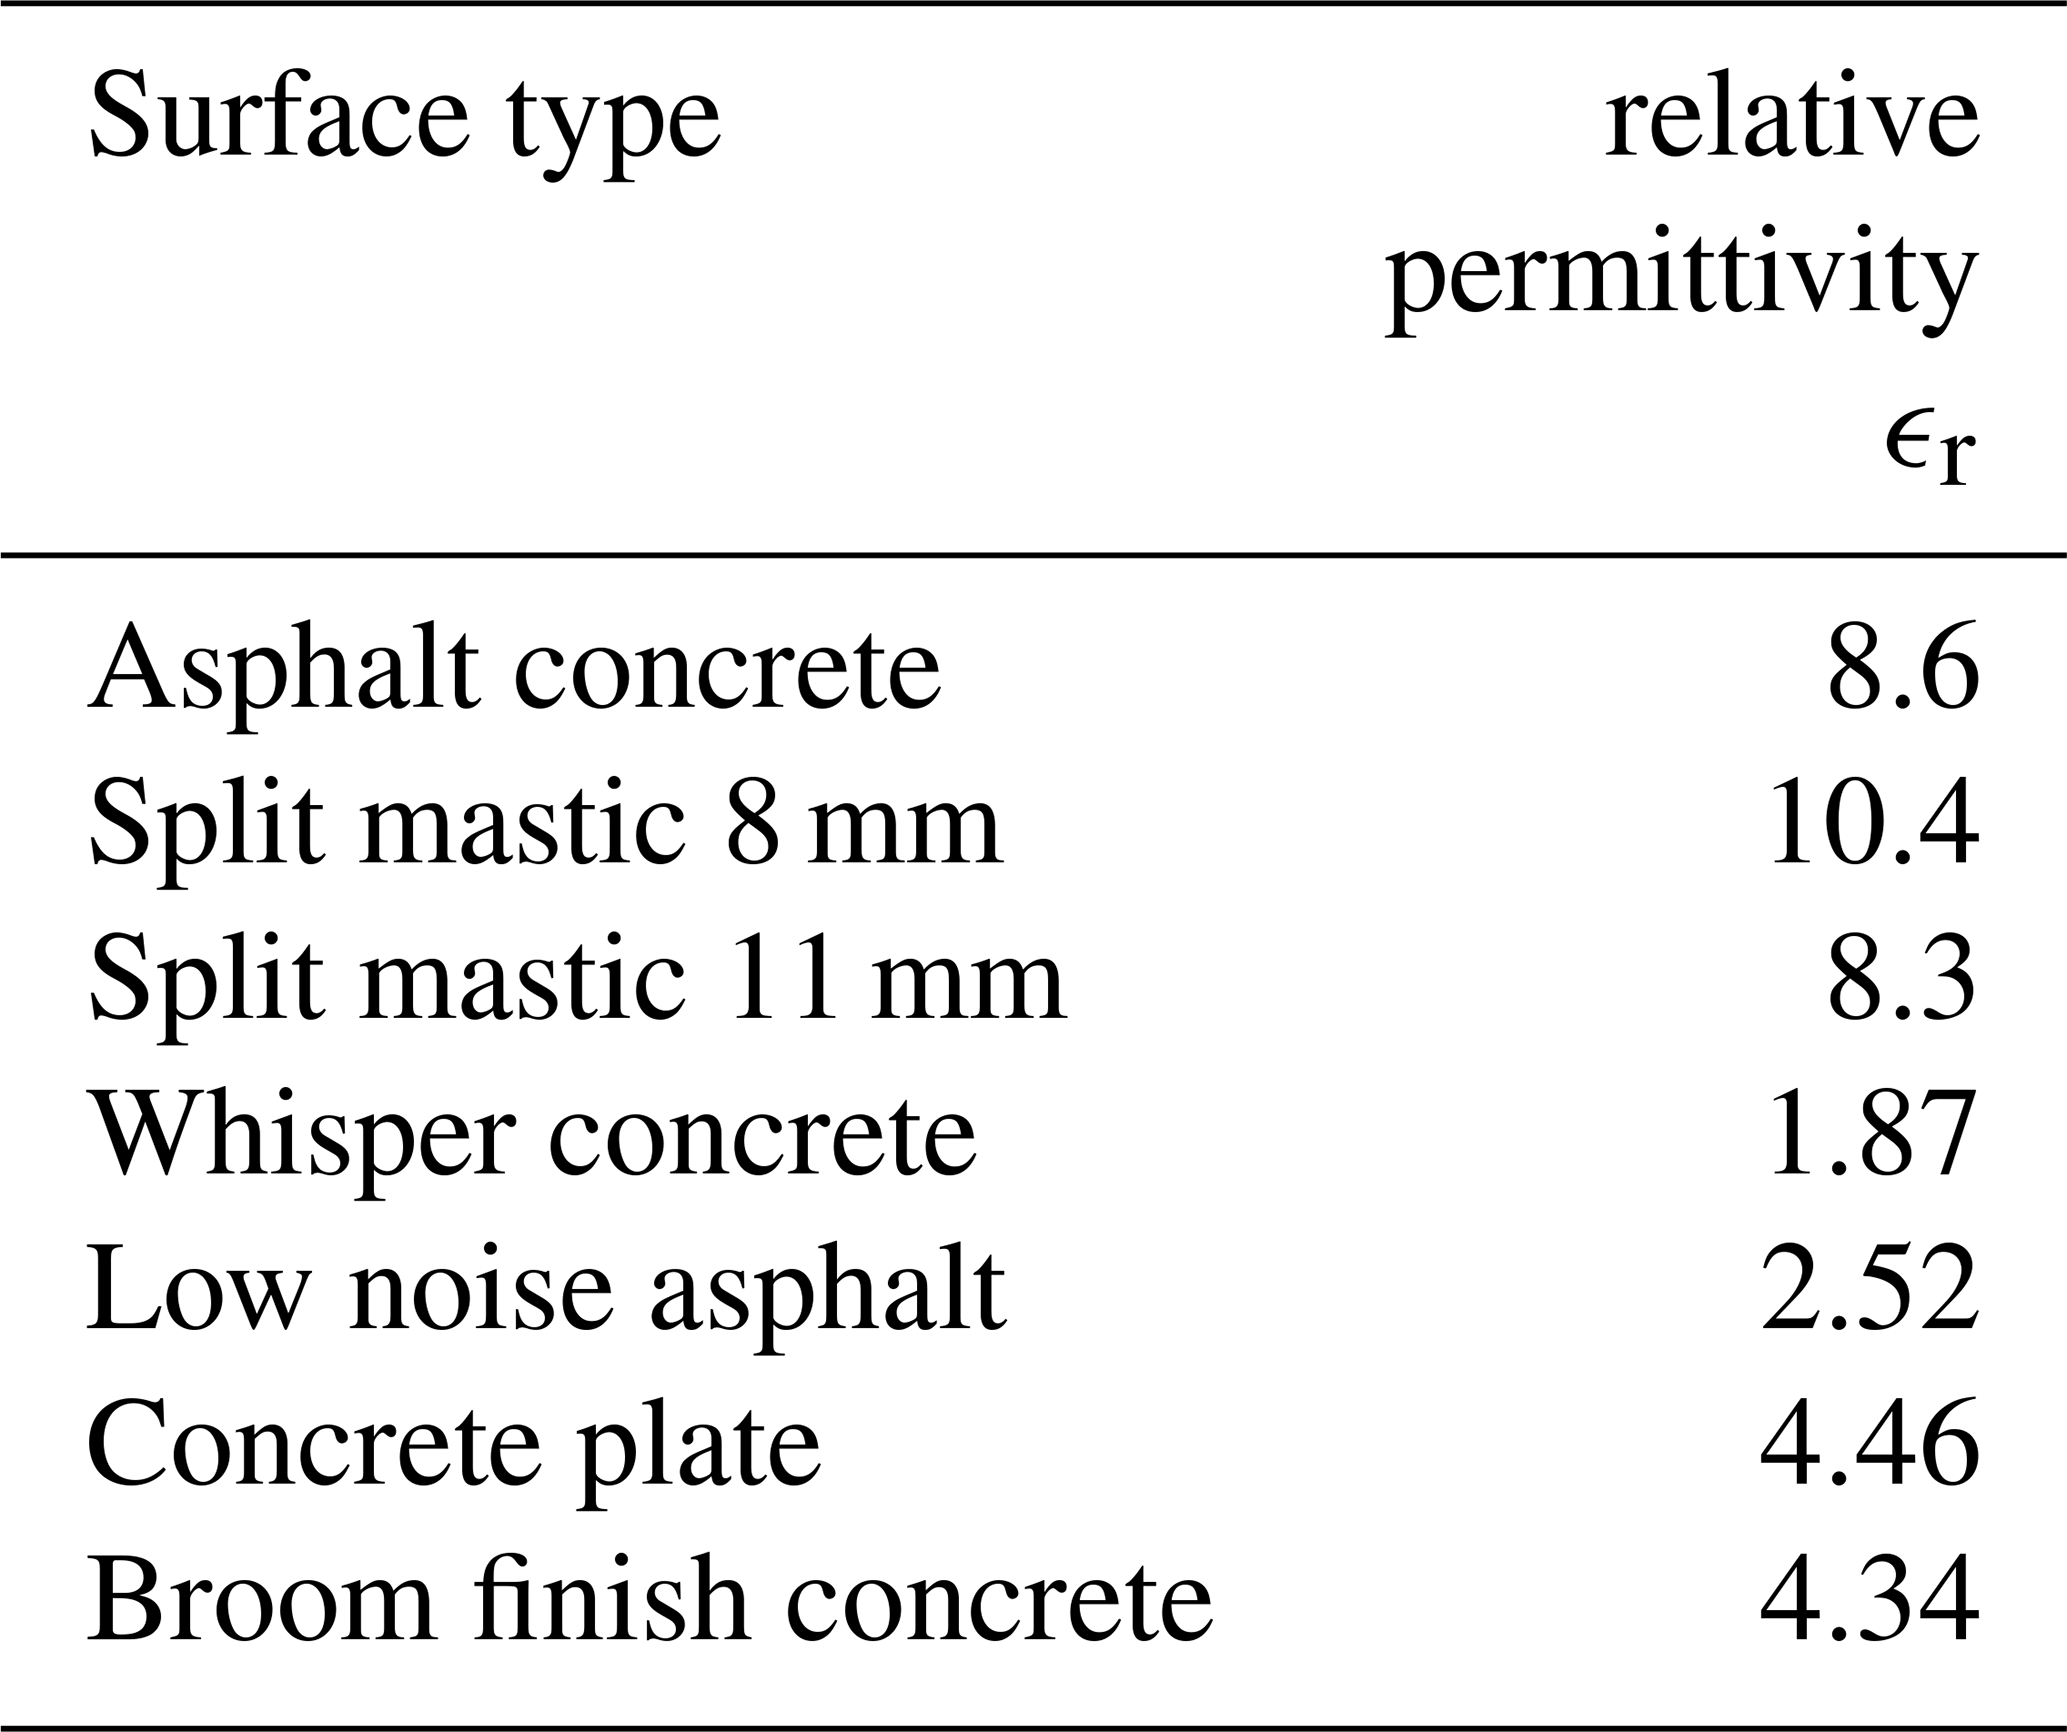
As seen for the SAR measurements the reflection of the wave is increasing with a smaller grain size. Also the irregularity of the surface shows the same effect as before. The self-healing asphalt was the only rough surface in this setup according to the Rayleigh criterion. The scattering of it was lower than of the rest. But assuming an incidence on a rough surface, the followed calculations do not fit and are skipped for this asphalt. Furthermore, it can be seen that the low noise surfaces are scattering less than other surfaces. They contain a higher percentage of air. Moreover, their roughness is in the limit range, in which a smooth surface can be assumed. So these two values are not 100 % reliable, yet. Therefore, further measurements must be performed to obtain reliable results for a feasible correlation between permittivity and roughness of a road additionally to the difference in material. Figure 9 shows a measured range spectrum with the two paths separated in two peaks. The slight difference in amplitude between the measurement with the reflector adjusted to the sensor and the one adjusted to the reflection point on the ground can be seen as well. To calculate the permittivity the amplitudes in the range spectrum are calibrated and afterwards averaged over several chirps. Table 2 finally lists the calculated relative permittivities. The two concrete processings are very similar as well as the low noise surfaces. The other asphalts show a higher permittivity. So, that differences in reflection and permittivity are caused by material of the road and roughness, can be seen in both measurements.
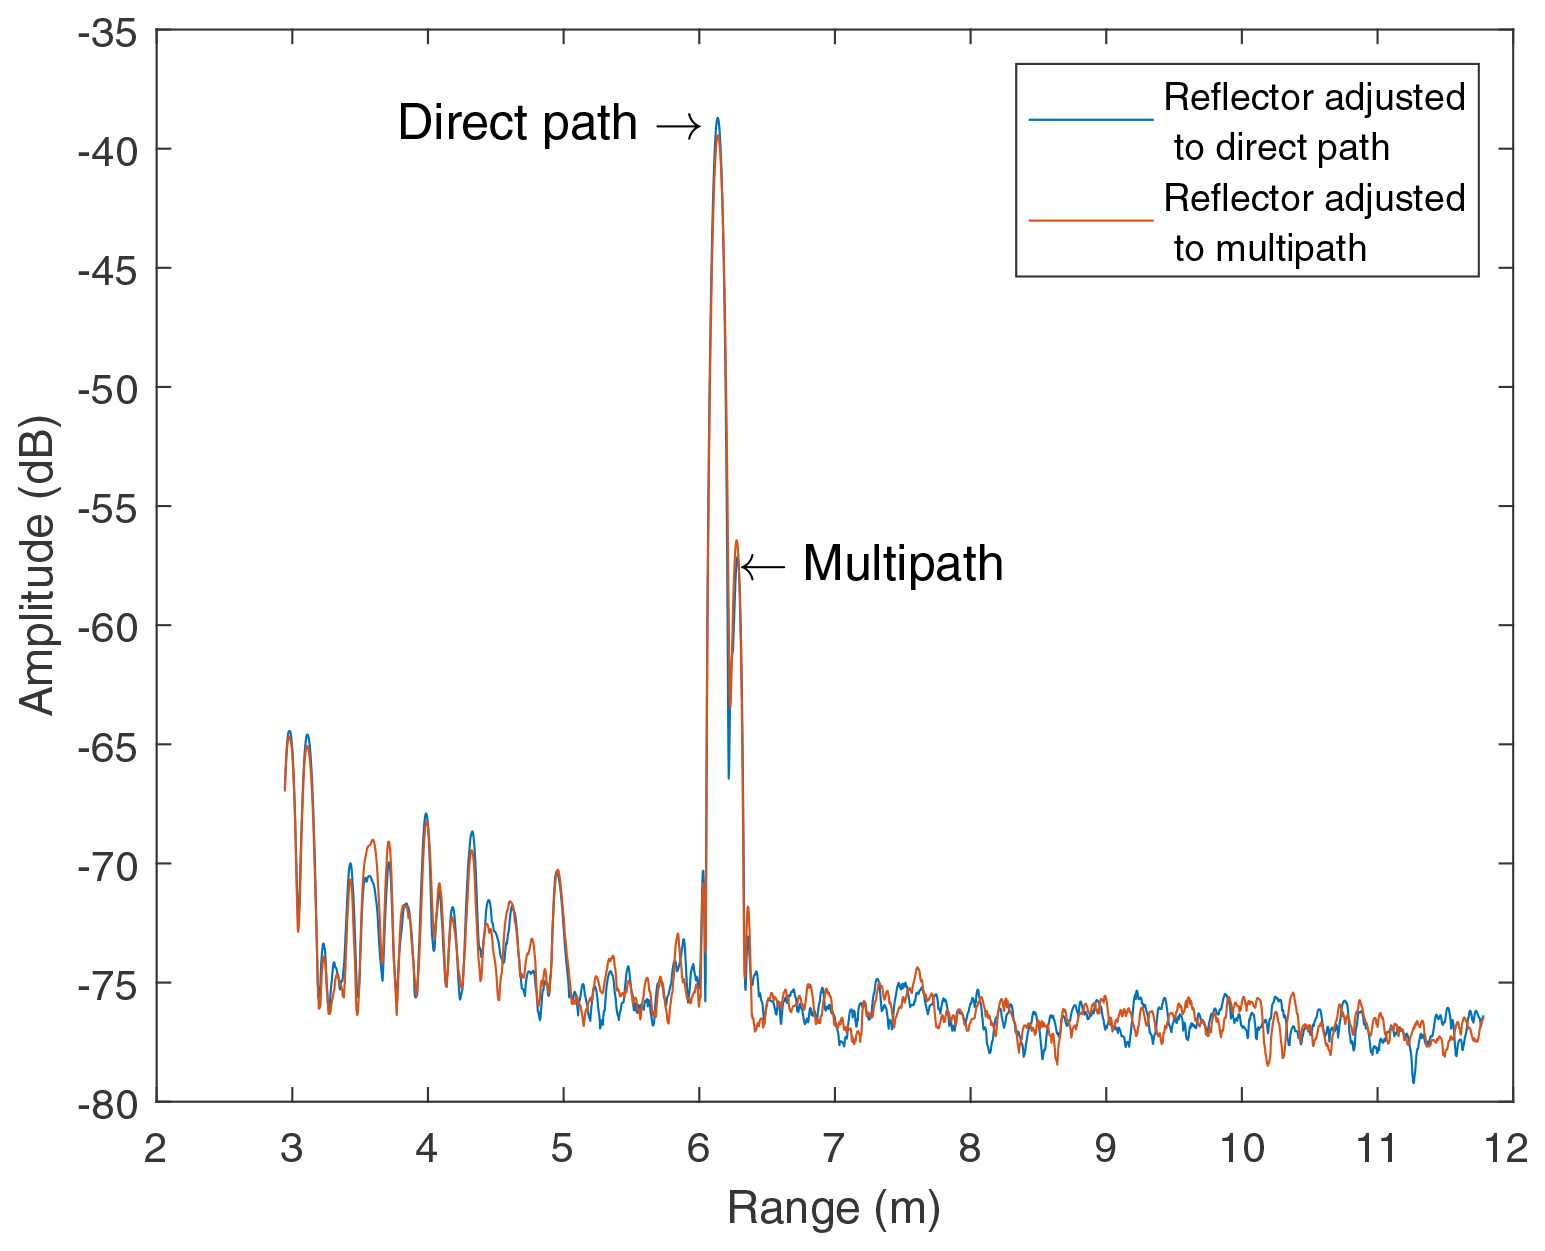
Table 2Calculated relative permittivity of the different road surfaces.
In this work two different measurement methods to assess the scattering of road surfaces in the automotive band were presented. The laboratory setup shows a qualitative variety, that is obtained by measuring drill cores with a SAR setup. It is a comparatively cheap and fast measurement method that can provide a quick overview. By contrast the open space measurements also allow a quantitative statement. It is obtained with a radar evaluation board and a corner reflector on an open space, specified road surface. The results are used to calculate a relative permittivity of the road surface, which can be used in automotive simulations to improve the accuracy and reduce the susceptibility to errors. The two measurement methods agree in their basic results.
In future other surfaces might be interesting to analyze. Additionally it would be interesting to measure the self-healing in a constellation so that the surface is smooth. The measurement of whisper concrete and low noise asphalt should also be repeated, as the result does not sea resonable and the setup was used at the boundaries of validation. Equally interesting would be to investigate the influence of temperature, so they can be repeated with warmer weather. However the measurement results shall be integrated in simulations to cross-check the results again and afterwards extend the models.
The research data used in this paper can be requested from the authors.
VK developed the measurement setup of the free space measurements. VK, HS and FP developed the measurements setup for the laboratory measurements. VK and HS performed the measurements. VK post-processed the obtained data and prepared the manuscript. All other authors gave feedback and approved to the final version. CvD and EB supervised the project.
The author declares that there is no conflict of interest.
Publisher's note: Copernicus Publications remains neutral with regard to jurisdictional claims in published maps and institutional affiliations.
This article is part of the special issue “Kleinheubacher Berichte 2020”.
This study was done in cooperation with BMW group and the Centre for Building Materials of TU Munich. Special thanks to the latter for providing the drill cores. Furthermore, thanks to the BASt, who opened their measurement area “duraBASt” for the open space measurements.
This work was supported by the German Research Foundation (DFG) and the Technical University of Munich (TUM) in the framework of the Open Access Publishing Program.
This paper was edited by Madhu Chandra and reviewed by Dennis Vollbracht and one anonymous referee.
Babu, A. and Baumgartner, S. V.: Road Surface Quality Assessment Using Polarimetric Airborne SAR, 2020 IEEE Radar Conference (RadarConf20), 21–25 September 2020, Florence, Italy, 2020. a
BASt: The duraBASt Research – Develop – Investigation, available at: https://www.durabast.de/durabast/EN/duraBASt/durabast_node.html (last access: 18 January 2021), 2020. a
Bayrische Staatskanzlei: Bekanntmachung des Bayerischen Staatsministeriums des Innern, für Bau und Verkehr über Zusätzliche Technische Vertragsbedingungen und Richtlinien für die Bauliche Erhaltung von Verkehrsflächenbefestigungen (ZTV BEA-StB 09/13), Munich, Germany, az. IID9-43415-005/97, 2014. a
Deutscher Bundestag: Entwurf eines ... Gesetzes zur Änderung des Straßenverkehrsgesetzes, Berlin, Germany, 31 March 2017. a
DIN EN 13036-1:2010-10: Oberflächeneigenschaften von Straßen und Flugplätzen- Prüfverfahren- Teil 1: Messung der Makrotexturtiefe der Fahrbahnoberfläche mit Hilfe eines volumetrischen Verfahrens; Deutsche Fassung EN_13036-1:2010, https://doi.org/10.31030/1668968, 2010. a
Giallorenzo, M., Cai, X., Nashashibi, A., and Sarabandi, K.: Radar Backscatter Measurements of Road Surfaces at 77 GHz, 2018 IEEE International Symposium on Antennas and Propagation & USNC/URSI National Radio Science Meeting, 8–13 July 2018, Boston, MA, USA, 2421–2422, https://doi.org/10.1109/APUSNCURSINRSM.2018.8609191, 2018. a
Hecht, E.: Optik, 5th edn., Oldenbourg, München, Germany, 2009. a
Kurz, V., Buchberger, C., van Driesten, C., and Biebl, E.: Retroreflective mmWave Measurements to Determine Road Surface Characteristics, 2019 Kleinheubach Conference, 23–25 September 2019, Miltenberg, Germany, 2019. a, b
Li, E. S. and Sarabandi, K.: Low grazing incidence millimeter-wave scattering models and measurements for various road surfaces, IEEE T. Antenn. Propag., 47, 851–861, https://doi.org/10.1109/8.774140, 1999. a
Pfeiffer, F.: Analyse und Optimierung von Radomen für automobile Radarsensoren, Dissertation, Technical University of Munich, Munich, Germany, 2010. a
Rees, W. G.: Physical principles of remote sensing, vol. 1 of Topics in remote sensing, reprinted. edn., Cambridge Univ. Press, Cambridge, UK, 1993. a
Richards, M. A.: Fundamentals of Radar Signal Processing, 2nd edn., McGraw-Hill Education, New York, USA, 2014. a
Sarabandi, K., Li, E. S., and Nashashibi, A.: Modeling and measurements of scattering from road surfaces at millimeter-wave frequencies, IEEE T. Antenn. Propag., 45, 1679–1688, https://doi.org/10.1109/8.650080, 1997. a
Schneider, R., Didascalou, D., and Wiesbeck, W.: Impact of Road Surfaces on Millimeter-WavePropagation, IEEE T. Veh. Technol., 49, 1314–1320, https://doi.org/10.1109/25.875249, 2000. a
Scholz, W., Moehring, R., and Hiese, W.: Baustoffkenntnis, 17th edition edn., Werner Verlag, Cambridge, UK, 2011. a
Skolnik, M. I.: Introduction to radar systems, McGraw-Hill electrical engineering series, 3rd edn., McGraw Hill, Boston, MA, USA, 2001. a
Texas Instruments: AWR2243 Single-Chip 76- to 81-GHz FMCW Transceiver, available at: https://www.ti.com/lit/ds/swrs223a/swrs223a.pdf (last access: 25 January 2021), 2020. a
Wald, S. O. and Weinmann, F.: Ray Tracing for Range-Doppler Simulation of 77 GHz Automotive Scenarios, 13th European Conference on Antennas and Propagation (EuCAP), 31 March–5 April 2019, Krakow, Poland, 2019. a
Winner, H.: Introducing autonomous driving: an overview of safety challenges and market introduction strategies, Automatisierungstechnik, 66, 100–106, https://doi.org/10.1515/auto-2017-0106, 2018. a