 | 17 Jan 2022
Measurement and optimization of a continuously tunable 10×10 reflectarray antenna for 5G metrology in the K-band
Thomas Harz
Thomas Kleine-Ostmann
A functional 10×10 reflectarray antenna is developed for millimeter-waves. It has a gain of approximately 10 dBi and a continuous steering range from −30 to 30∘ in the horizontal plane. In this paper, the entire design process is explained, beginning with the design and function of the antenna element and followed by considerations regarding positioning of the feed antenna. Steering and controlling of the beam are discussed. Finally, the antenna patterns for different steering angles were measured in an anechoic chamber. The design is scalable, built with commercial off-the-shelf components, and the array does not need active cooling.
- Article
(9916 KB) - Full-text XML
- BibTeX
- EndNote


The demand for high data rates in mobile communications and the limited bandwidth available in the sub-6 GHz frequency range has directed the focus towards millimeter-waves. At such high frequencies, antennas with high gain are needed to compensate the high free-space path loss and to achieve a good signal-to-noise ratio. Furthermore, the antennas have to be steerable to cover a large area and to increase spectral efficiency. Because energy is directed, less interference with neighboring cells is given. In comparison to sub-6 GHz mobile communication networks, a large number of antennas have to be installed to establish good coverage. To make this economically reasonable, the antennas must be cost-effective, energy-efficient, and easy to maintain. The reflectarray antenna type fulfills these requirements. Therefore, it is the preferred antenna type to investigate 5G antenna parameters.
The functionality of a reflectarray antenna is based on a feeding antenna, that illuminates a reflecting surface. The reflecting surface consists of a large number of elements that change the phase of the reflected, outgoing elementary waves to form a plane wave in the desired direction (Huang and Encinar, 2008). Different types of reflecting surfaces can be summarized in four categories as follows: waveguide reflectarray, dielectric reflectarray, metallic reflectarray, and microstrip reflectarray (Dahri et al., 2017). The first known publication of a reflectarray antenna is based on the concept of a waveguide reflectarray antenna. It consists of waveguides with short-circuited terminations. The phase of the reflected wave is tuned by the length of the waveguide (Berry et al., 1963). The dielectric reflectarray antenna uses elements, e.g. cuboids, which are made of non-conductive materials. Depending on the dimension and the permittivity of the cuboids, the phase of the reflected wave is changed (Nayeri et al., 2014). In a metallic reflectarray, the phase of the reflected wave is changed by conducting elements of different height. Depending both on the position of the elements on the reflecting surface and their height, the elements have a certain distance to a defined reference plane in order to generate the required phase shift of the reflected wave. The maximum height difference of the elements is half a wavelength in free space to achieve a phase shift range of 360∘. This approach has already been realized at 95 GHz (Lee et al., 2015). In the late 1980s, with the availability of affordable printed circuit board (PCB) materials, the microstrip reflectarray emerged. Nowadays, this is the most commonly used type of reflectarray, and it has the largest variety of designs with different characteristics (Nayeri et al., 2018).
Because of these reasons, a microstrip reflectarray has been realized in this work. This paper is organized as follows: Sect. 2 explains the development of the reflectarray element operating at 26 GHz. The verification of the reflectarray element functionality using a waveguide simulator is shown in Sect. 3. Section 4 presents the results of optimizing the position of the feed antenna. The functionality of the prototype reflector antenna is shown in Sect. 5. The steering of the antenna pattern is demonstrated and evaluated in Sect. 6, and finally, results are summarized in Sect. 7.
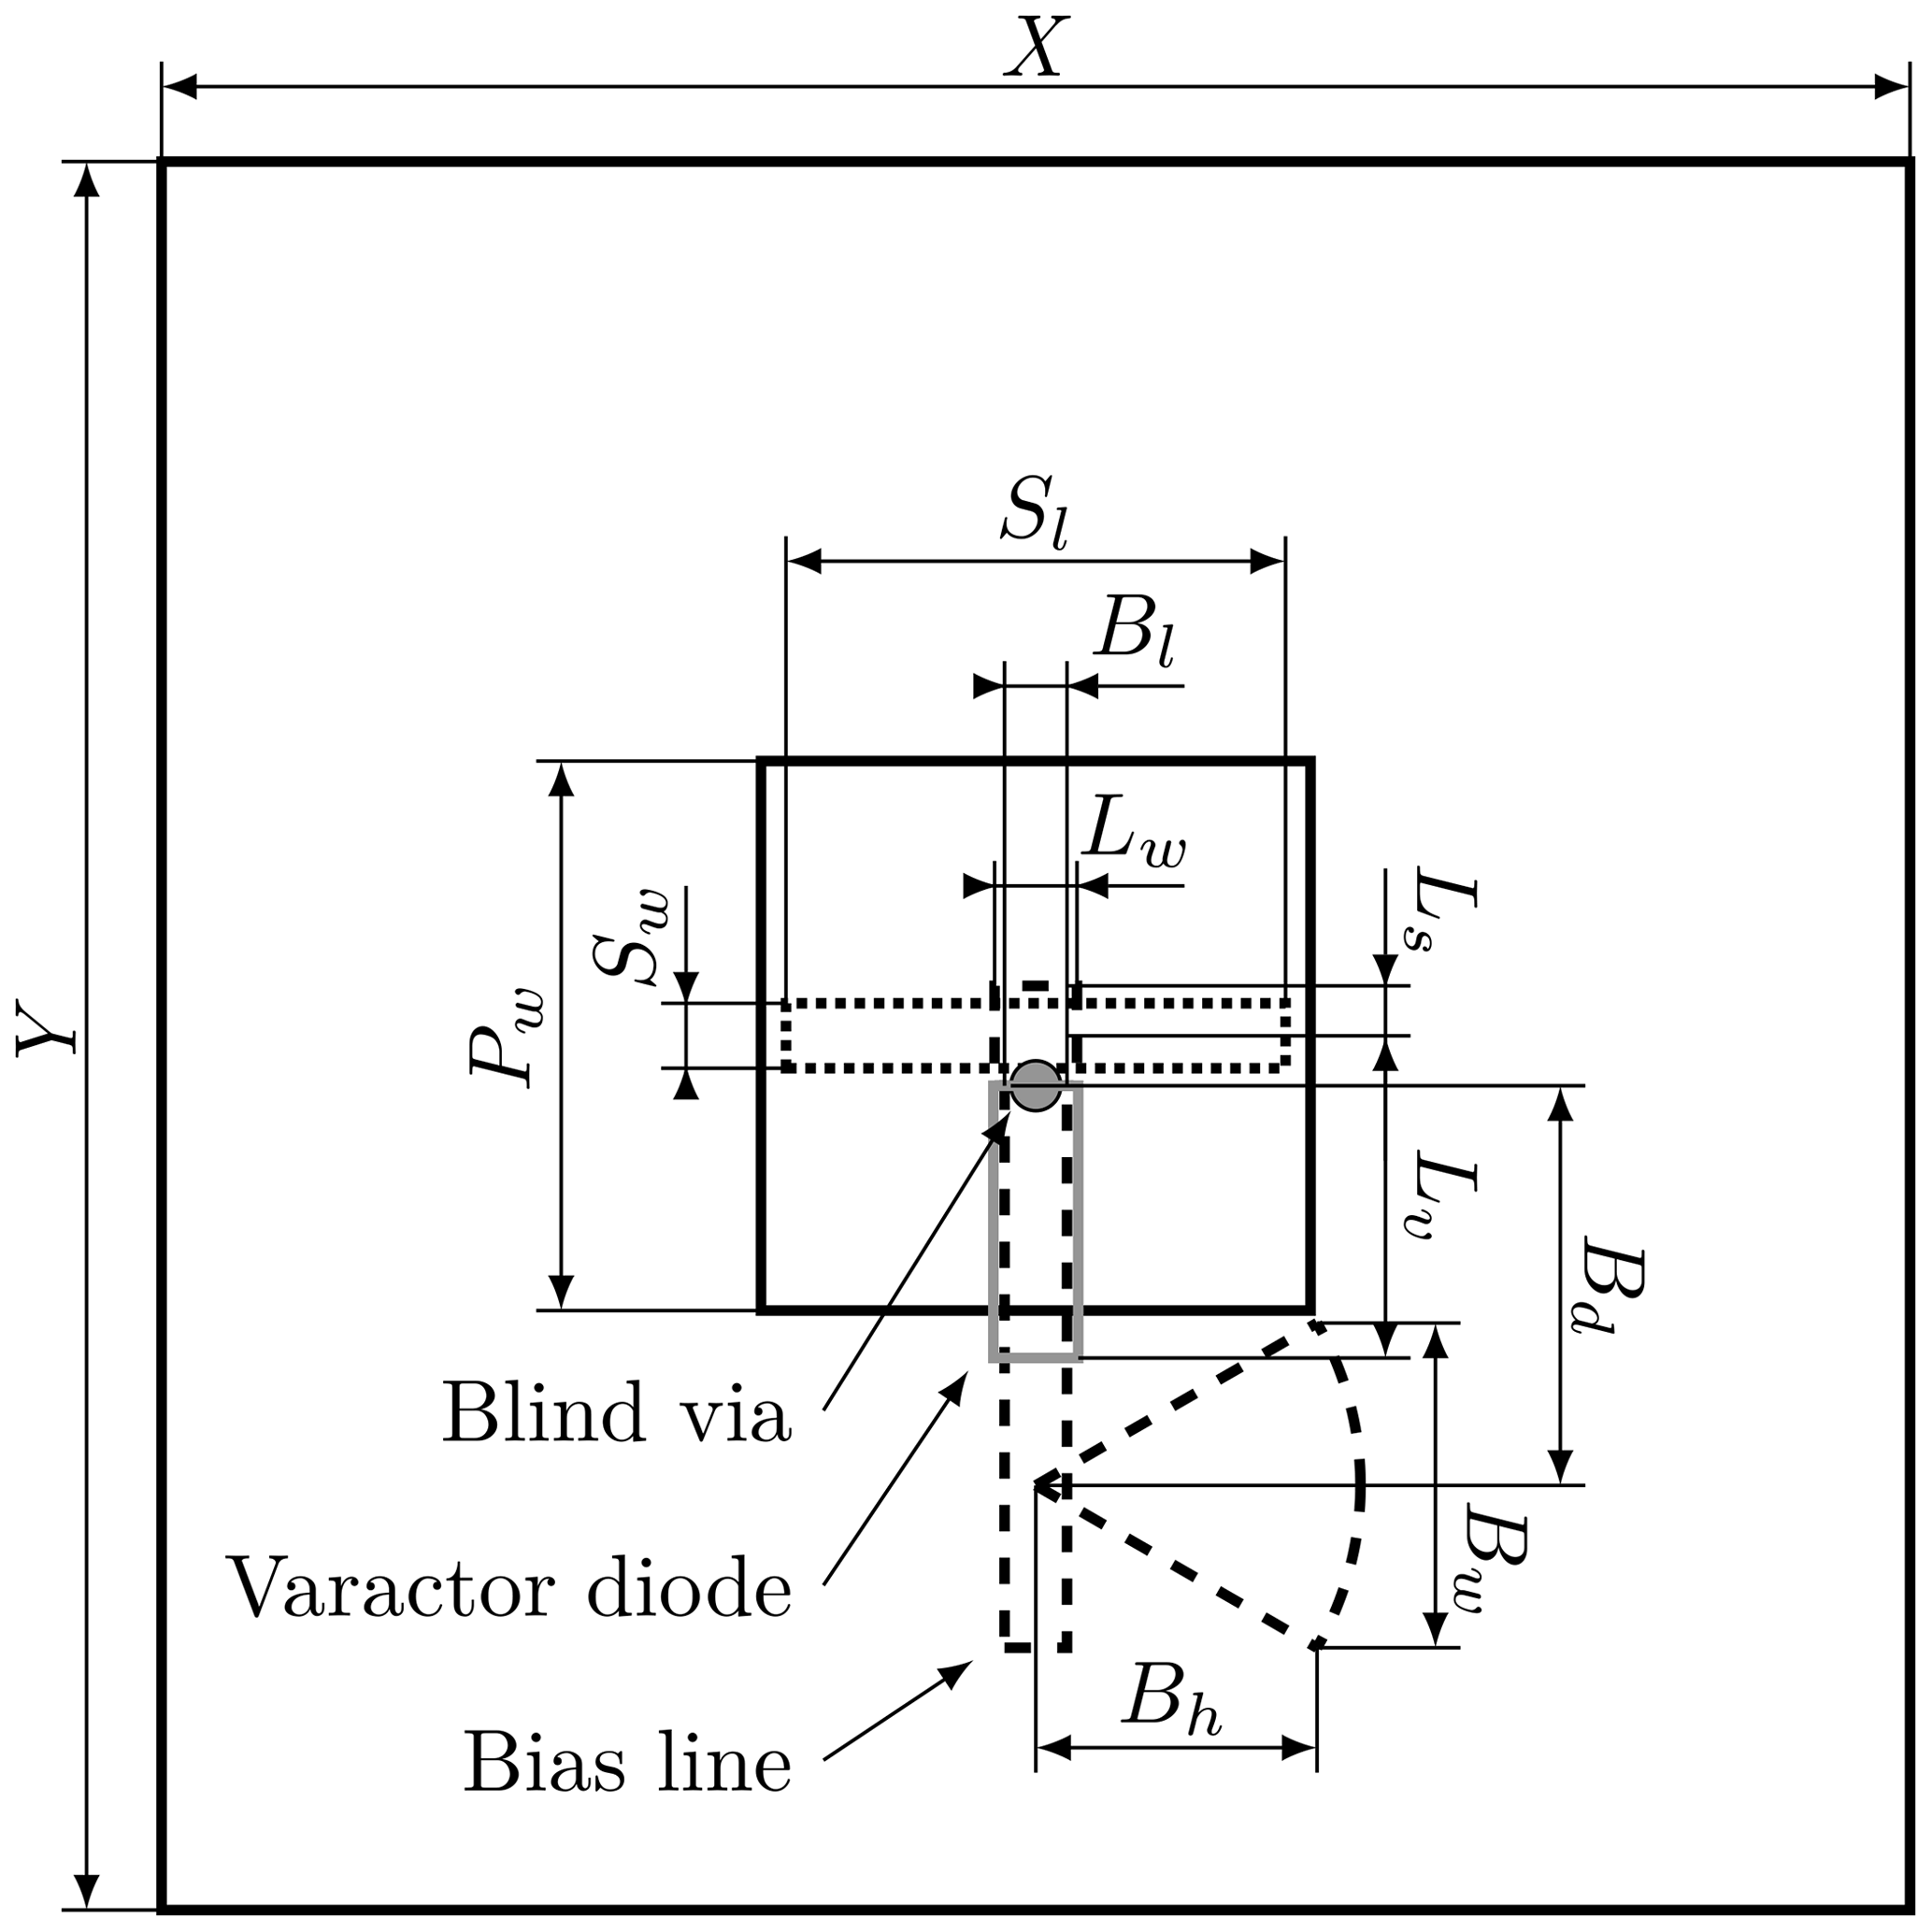
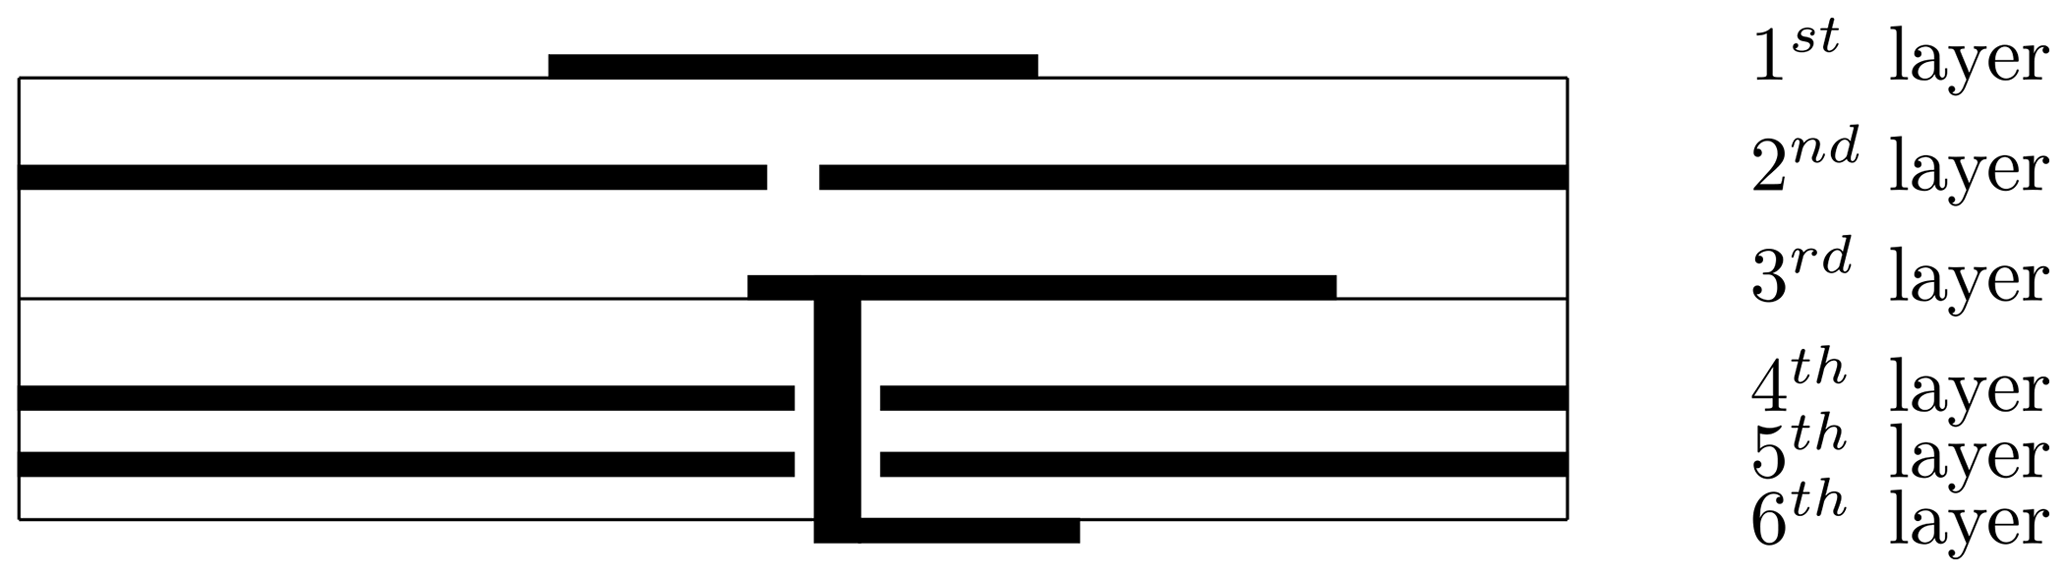
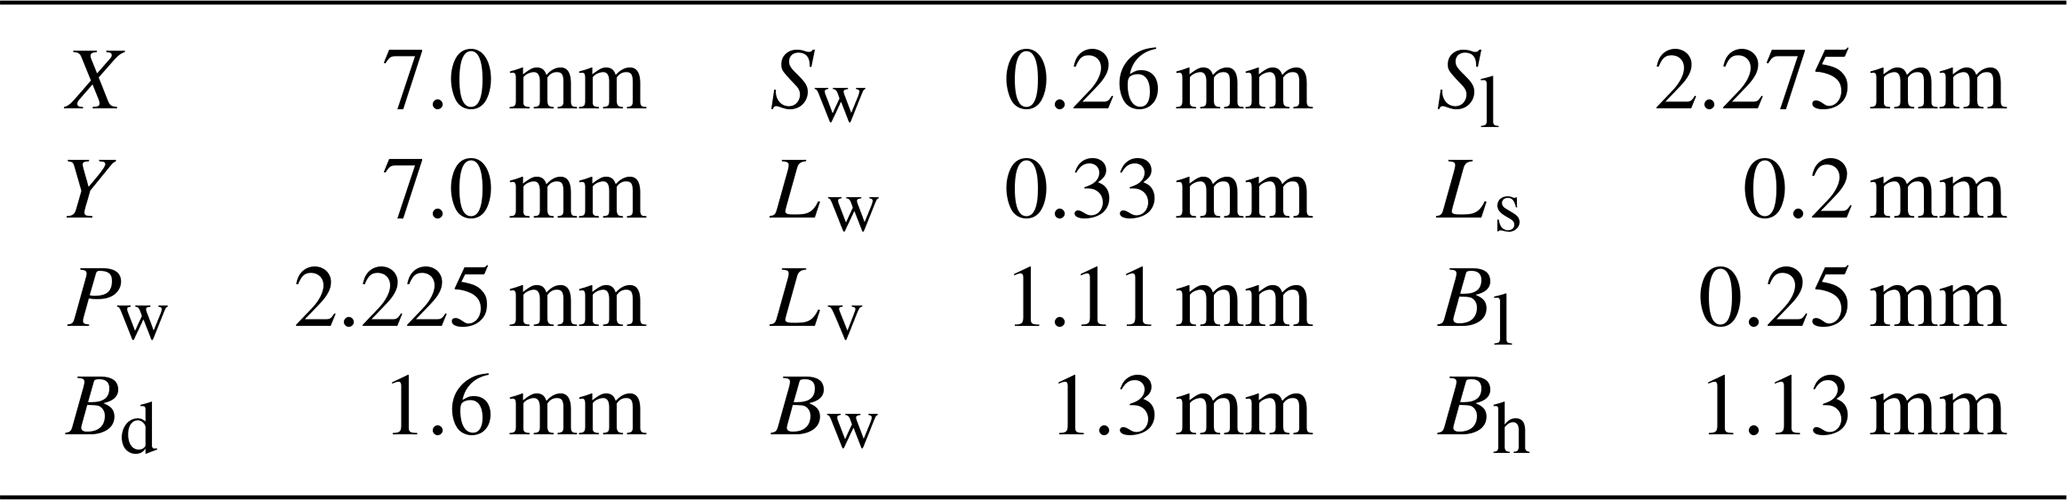
For a millimeter-wave antenna, we require an antenna element, which can be produced using common PCBs, and which is robust against manufacturing tolerances. Aperture-coupled antennas, including a varactor diode for continuous phase shift of the reflected wave, comply with these requirements. The mechanical dimensions of the microstrip patch and the coupling slot of the antenna element can be realized easily. Additionally, this design has the advantage that all parts required for changing the phase can be positioned underneath the ground plane. All components, including the power supply of the varactor diode, fit within the size of an antenna element. This is possible because the required phase shift can be archieved with one single varactor diode. A six-layer printed circuit board is used for the design of the reflector element (Figs. 1, 2). The first four layers cause a reflection with the desired phase shift. The last two layers are used to route the signals to the varactor diode. The patch on the first layer receives the incoming wave, which is coupled into a stripline through the slot on the second layer. The stripline and the varactor diode form a resonant circuit, that shifts the phase of the reflected wave (Venneri et al., 2012). For determining the size of the patch, the slot width, the length, and the thickness of the dielectric layer, the antenna element was simulated with the test port on the stripline using a finite element method based simulator. As dielectric material, Isola Astra MT77, was chosen because it allows the realization of buried and blind vias as well. The material is specified with a permittivity of 3.0 and a loss factor of 0.0017 up to 20 GHz. These data were used in the simulation, and as shown later, good matching results were obtained. The same dielectric material is used for all layers so that no mechanical tension occurs that bows or twists the PCB. The thickness of the dielectric material for the first, the second, and the third layer is 254 µm. All other layers have a thickness of 127 µm. The antenna element was optimized in a unit cell configuration, which simulates the antenna element in a periodically structured array, including the influence of the neighboring antenna elements. The resonant circuit given by the stripline and the varactor diode was adjusted for the required phase shift of the reflected wave by tuning the lengths Ls and Lv (Fig. 1). The stripline stub Ls acts as inductive reactance to the resonant circuit. By matching the length Lv with the capacitance range of the varactor diode, the maximum phase range for the reflected wave is achieved (Venneri et al., 2013). A flip-chip varactor diode MAVR-011020-111™ (MACOM) with a capacitance in the range from 0.025 to 0.19 pF obtained by a control voltage between 0 and 15 V was selected. Because of its package size, it is expected to have an uncritical parasitic inductance. Unfortunately, the manufacturer does not provide parameters for the equivalent circuit. The final lengths Ls and Lv and the dimensions of the antenna element are given in Table 1. The main goal of the optimization was a wide range of phase shift, resulting in a maximum simulated phase shift of 337∘. A bias-T is connected to the varactor diode to apply a DC signal without disturbing the high-frequency path. It consists of a quarter-wavelength stripline transformer and a microstrip radial stub shunt. The microstrip radial shunt generates a short for the electromagnetic wave and the quarter-wavelength stripline transformer converts it into an open circuit at the junction to the high-frequency stripline. Because of the input impedance of an open circuit, the high-frequency path is decoupled from the DC path. With one radial stub shunt, a decoupling of 36 dB has been accomplished.
Single antenna elements were fabricated to measure their characteristics in a waveguide simulator (Fig. 3). The method has the advantage that only a few elements in the waveguide need to be measured to determine their performance in a reflectarray (Hannan and Balfour, 1965). According to the electric field distribution in the waveguide, two antenna elements were aligned at the end of the waveguide. The TE10 mode was excited in a WR-42 waveguide connected to the WR-62 waveguide via a tapered transition. The propagation direction of the plane wave in the waveguide at a given frequency is tilted under an angle of θ=21.4∘ as given by:
where λc is the wavelength at the cut-off frequency of the selected waveguide. is the free-space wavelength at a frequency f, and c is the speed of light. The reflection coefficient was measured to obtain the phase and loss of the two antenna elements. Normalization with a short was done to set the reference plane at the flange where the two antenna elements were mounted. The voltage for both varactor diodes was provided by a programmable DC power supply. The controlled voltage was varied from 0 to 15 V, and for every 5 mV step, the phase and loss in relation to the reference plane were measured over the frequency band from 25.6 to 26.6 GHz. These small voltage steps were necessary so that large changes in phase over the voltage could be resolved. In Fig. 4, the measured unwrapped phase over frequency and voltage range are shown. The sharp edges result from the unwrapping algorithm. In a bandwidth of 100 MHz, the maximum phase change range is between 308 and 336∘. Phase and attenuation versus voltage are shown in Fig. 5 at a frequency of 26.104 GHz. The phase change range at this frequency is 322∘.
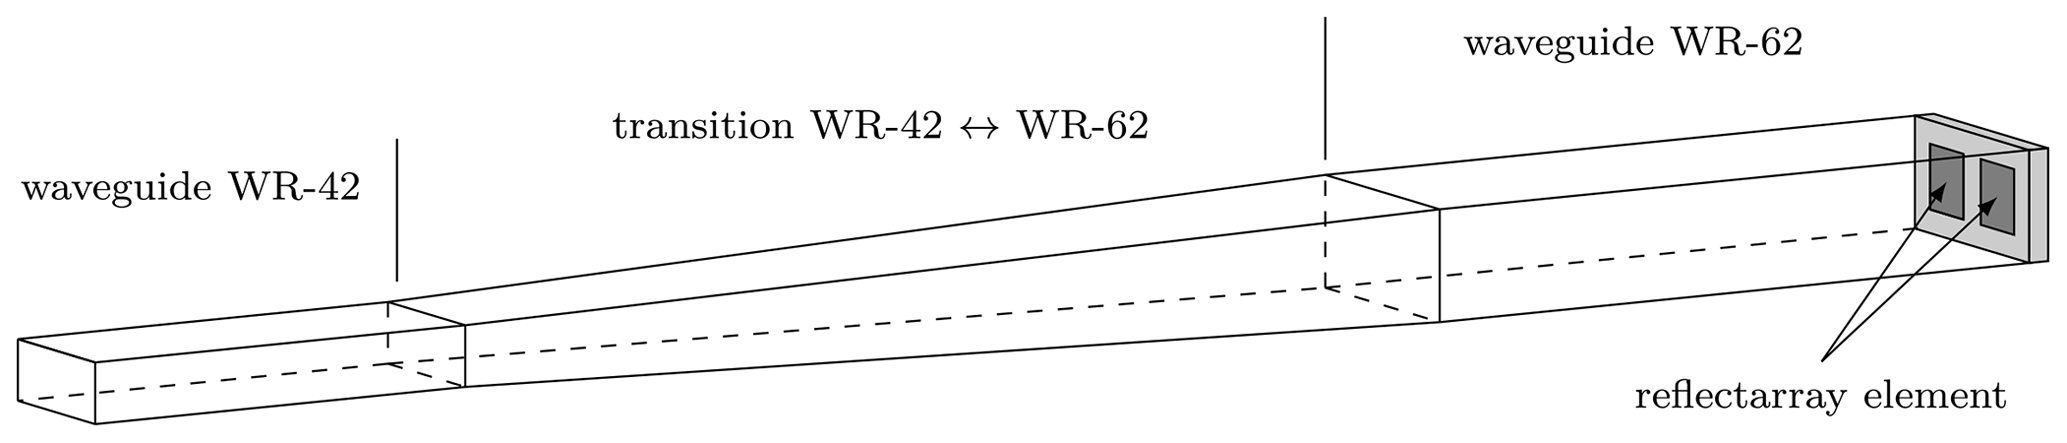
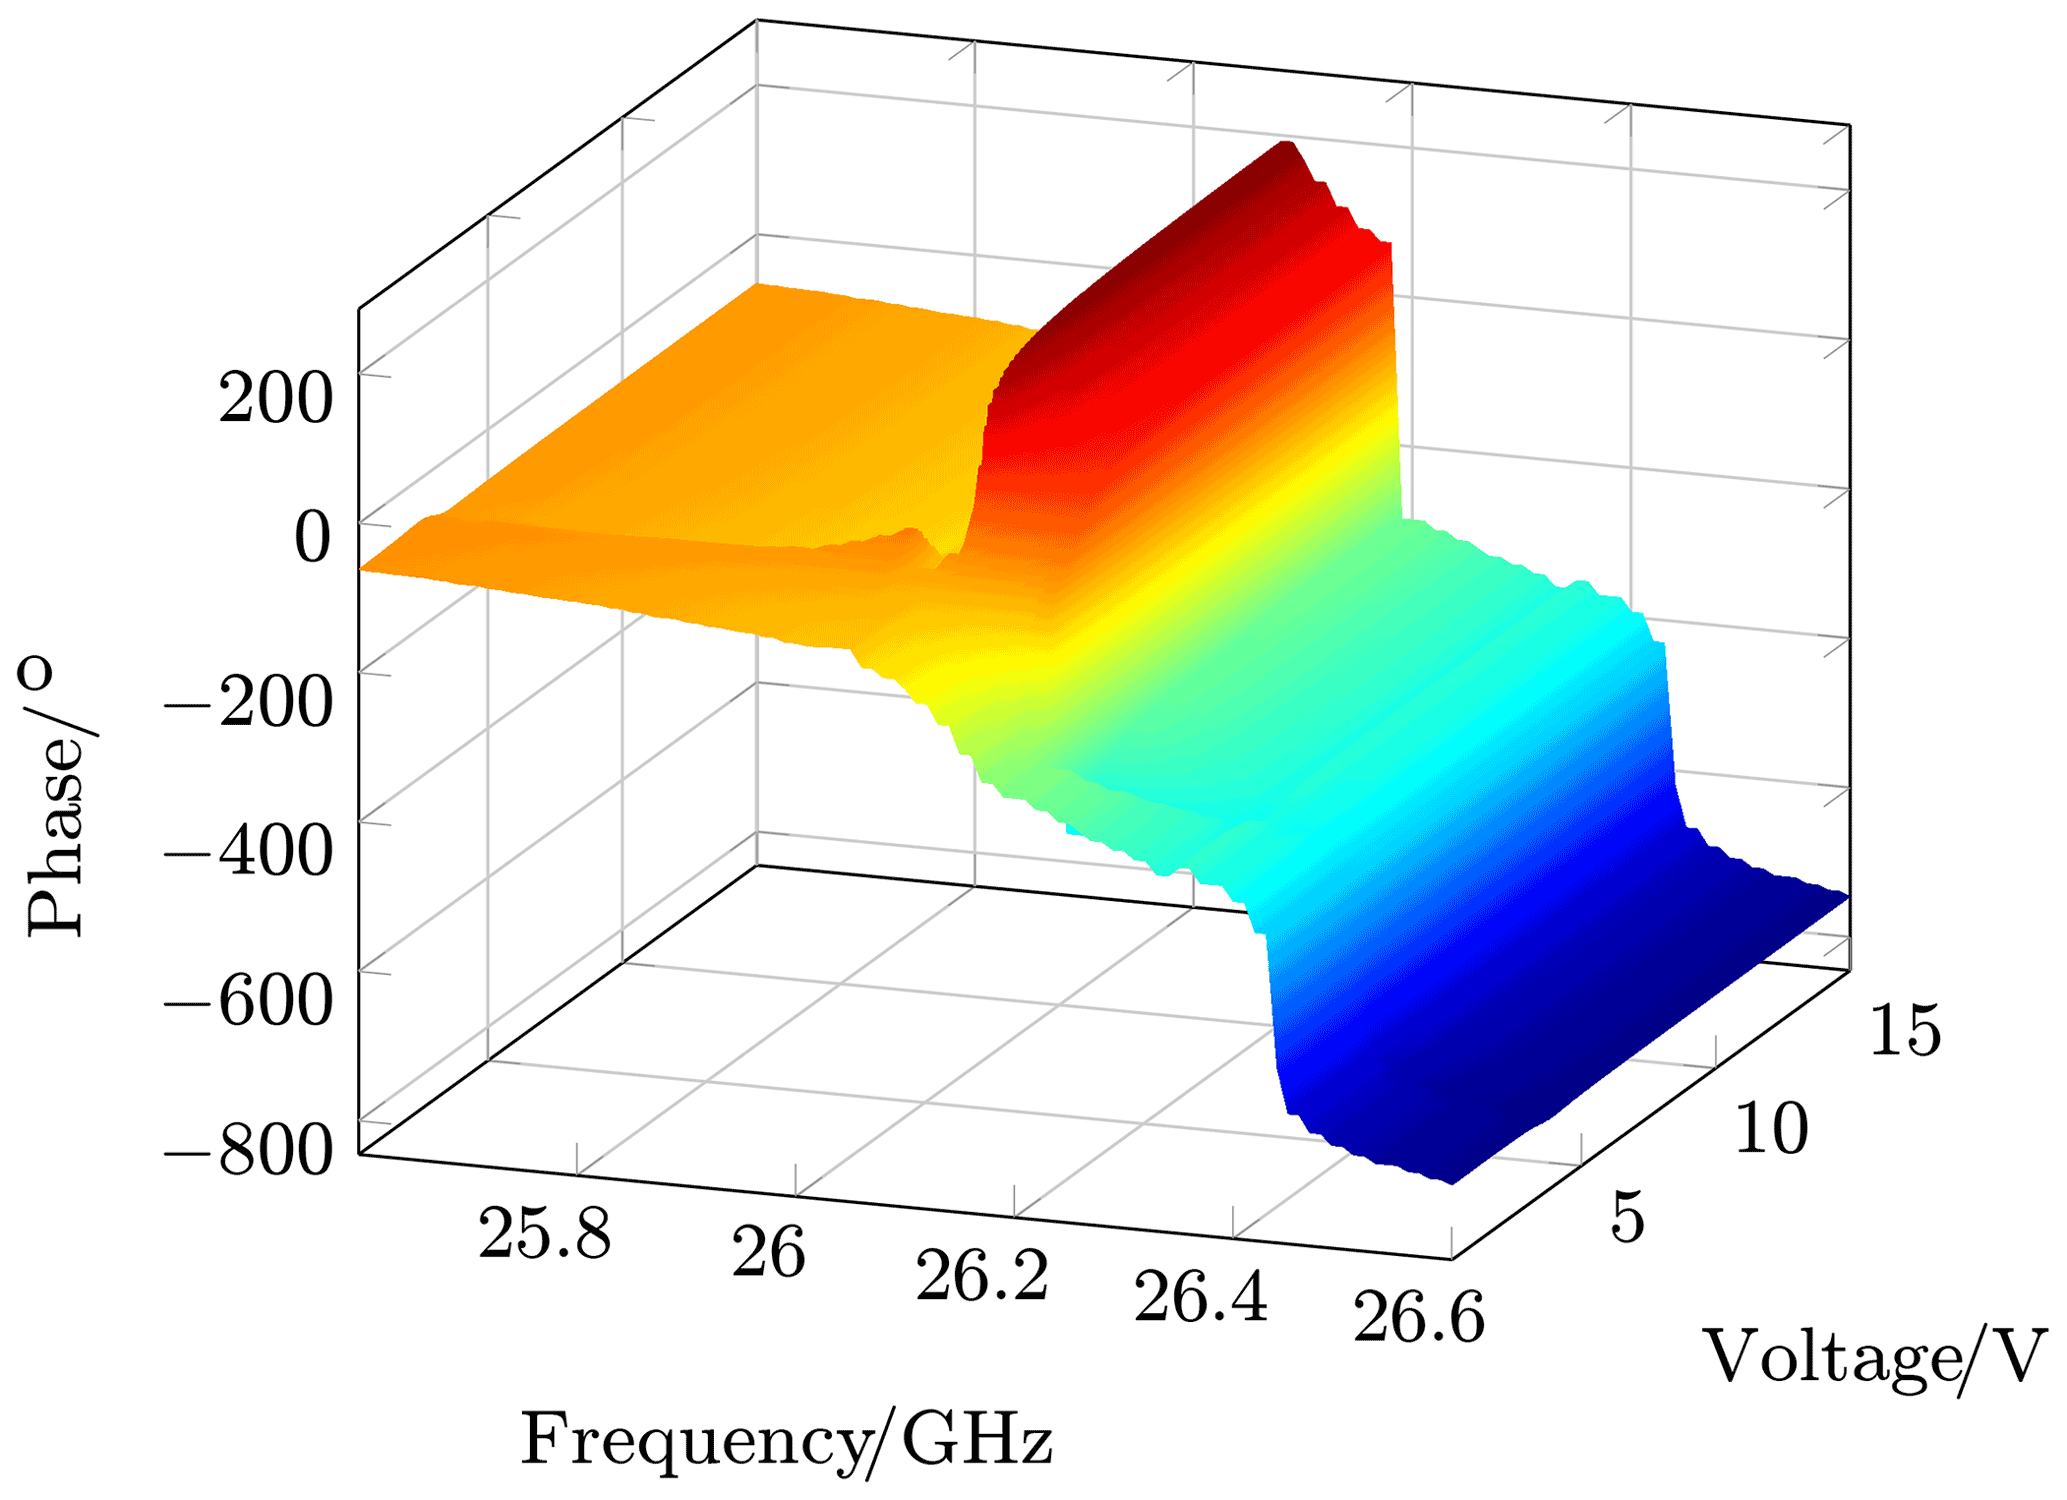
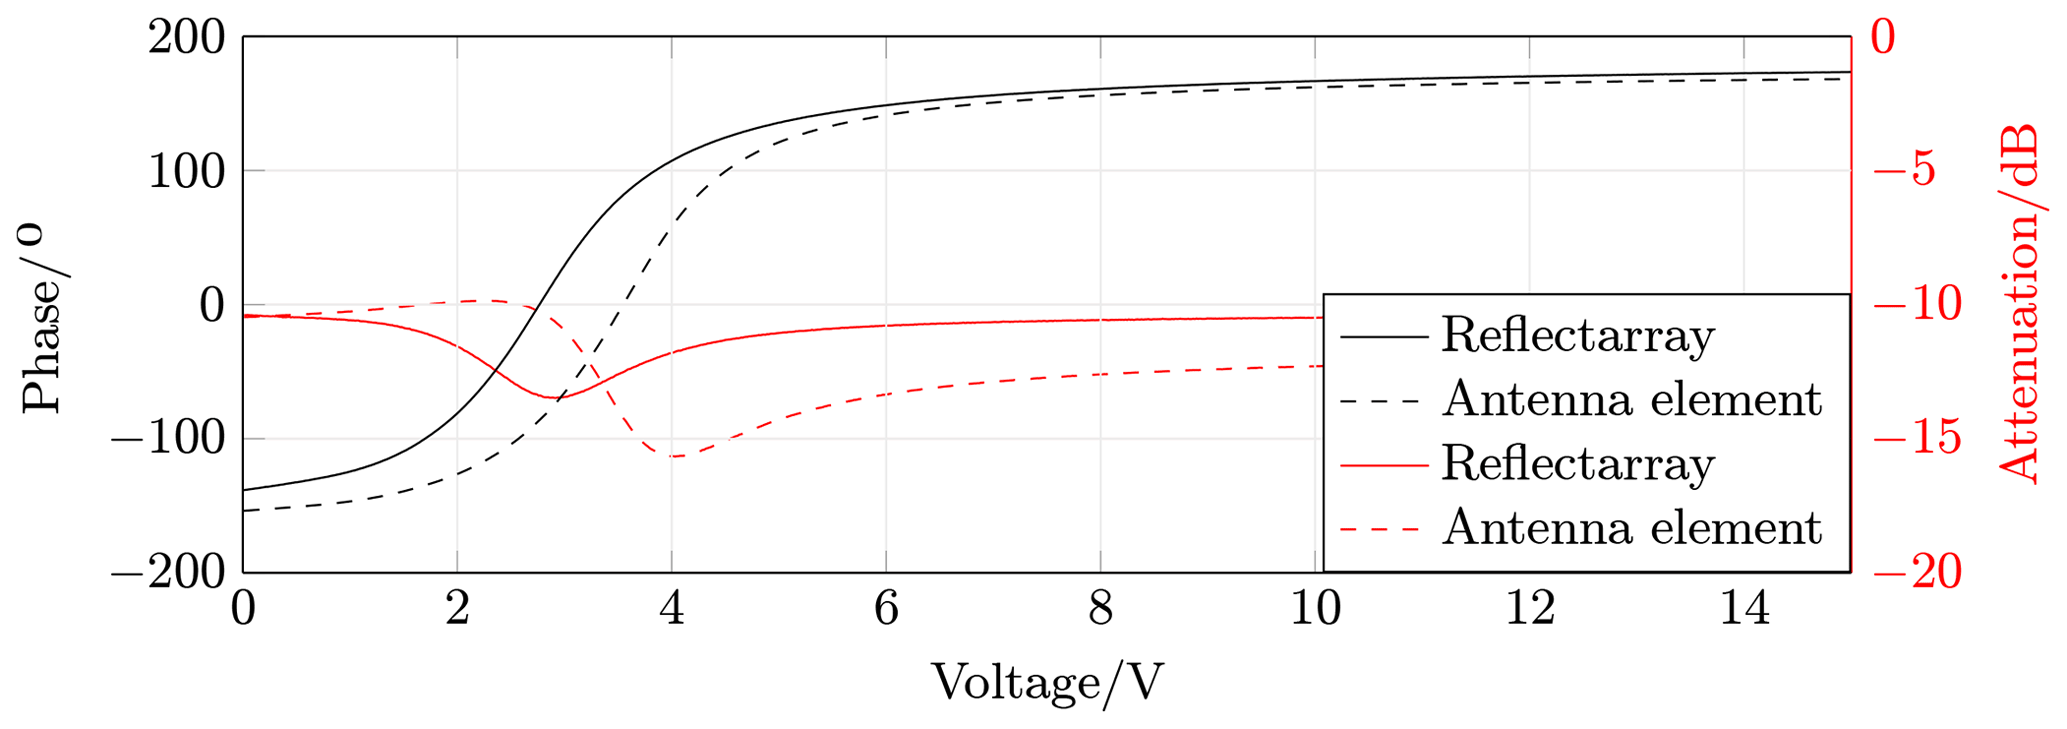
Figure 5Phase and attenuation vs. voltage. Measured with two antenna elements in the waveguide simulator and with the reflectarray antenna.
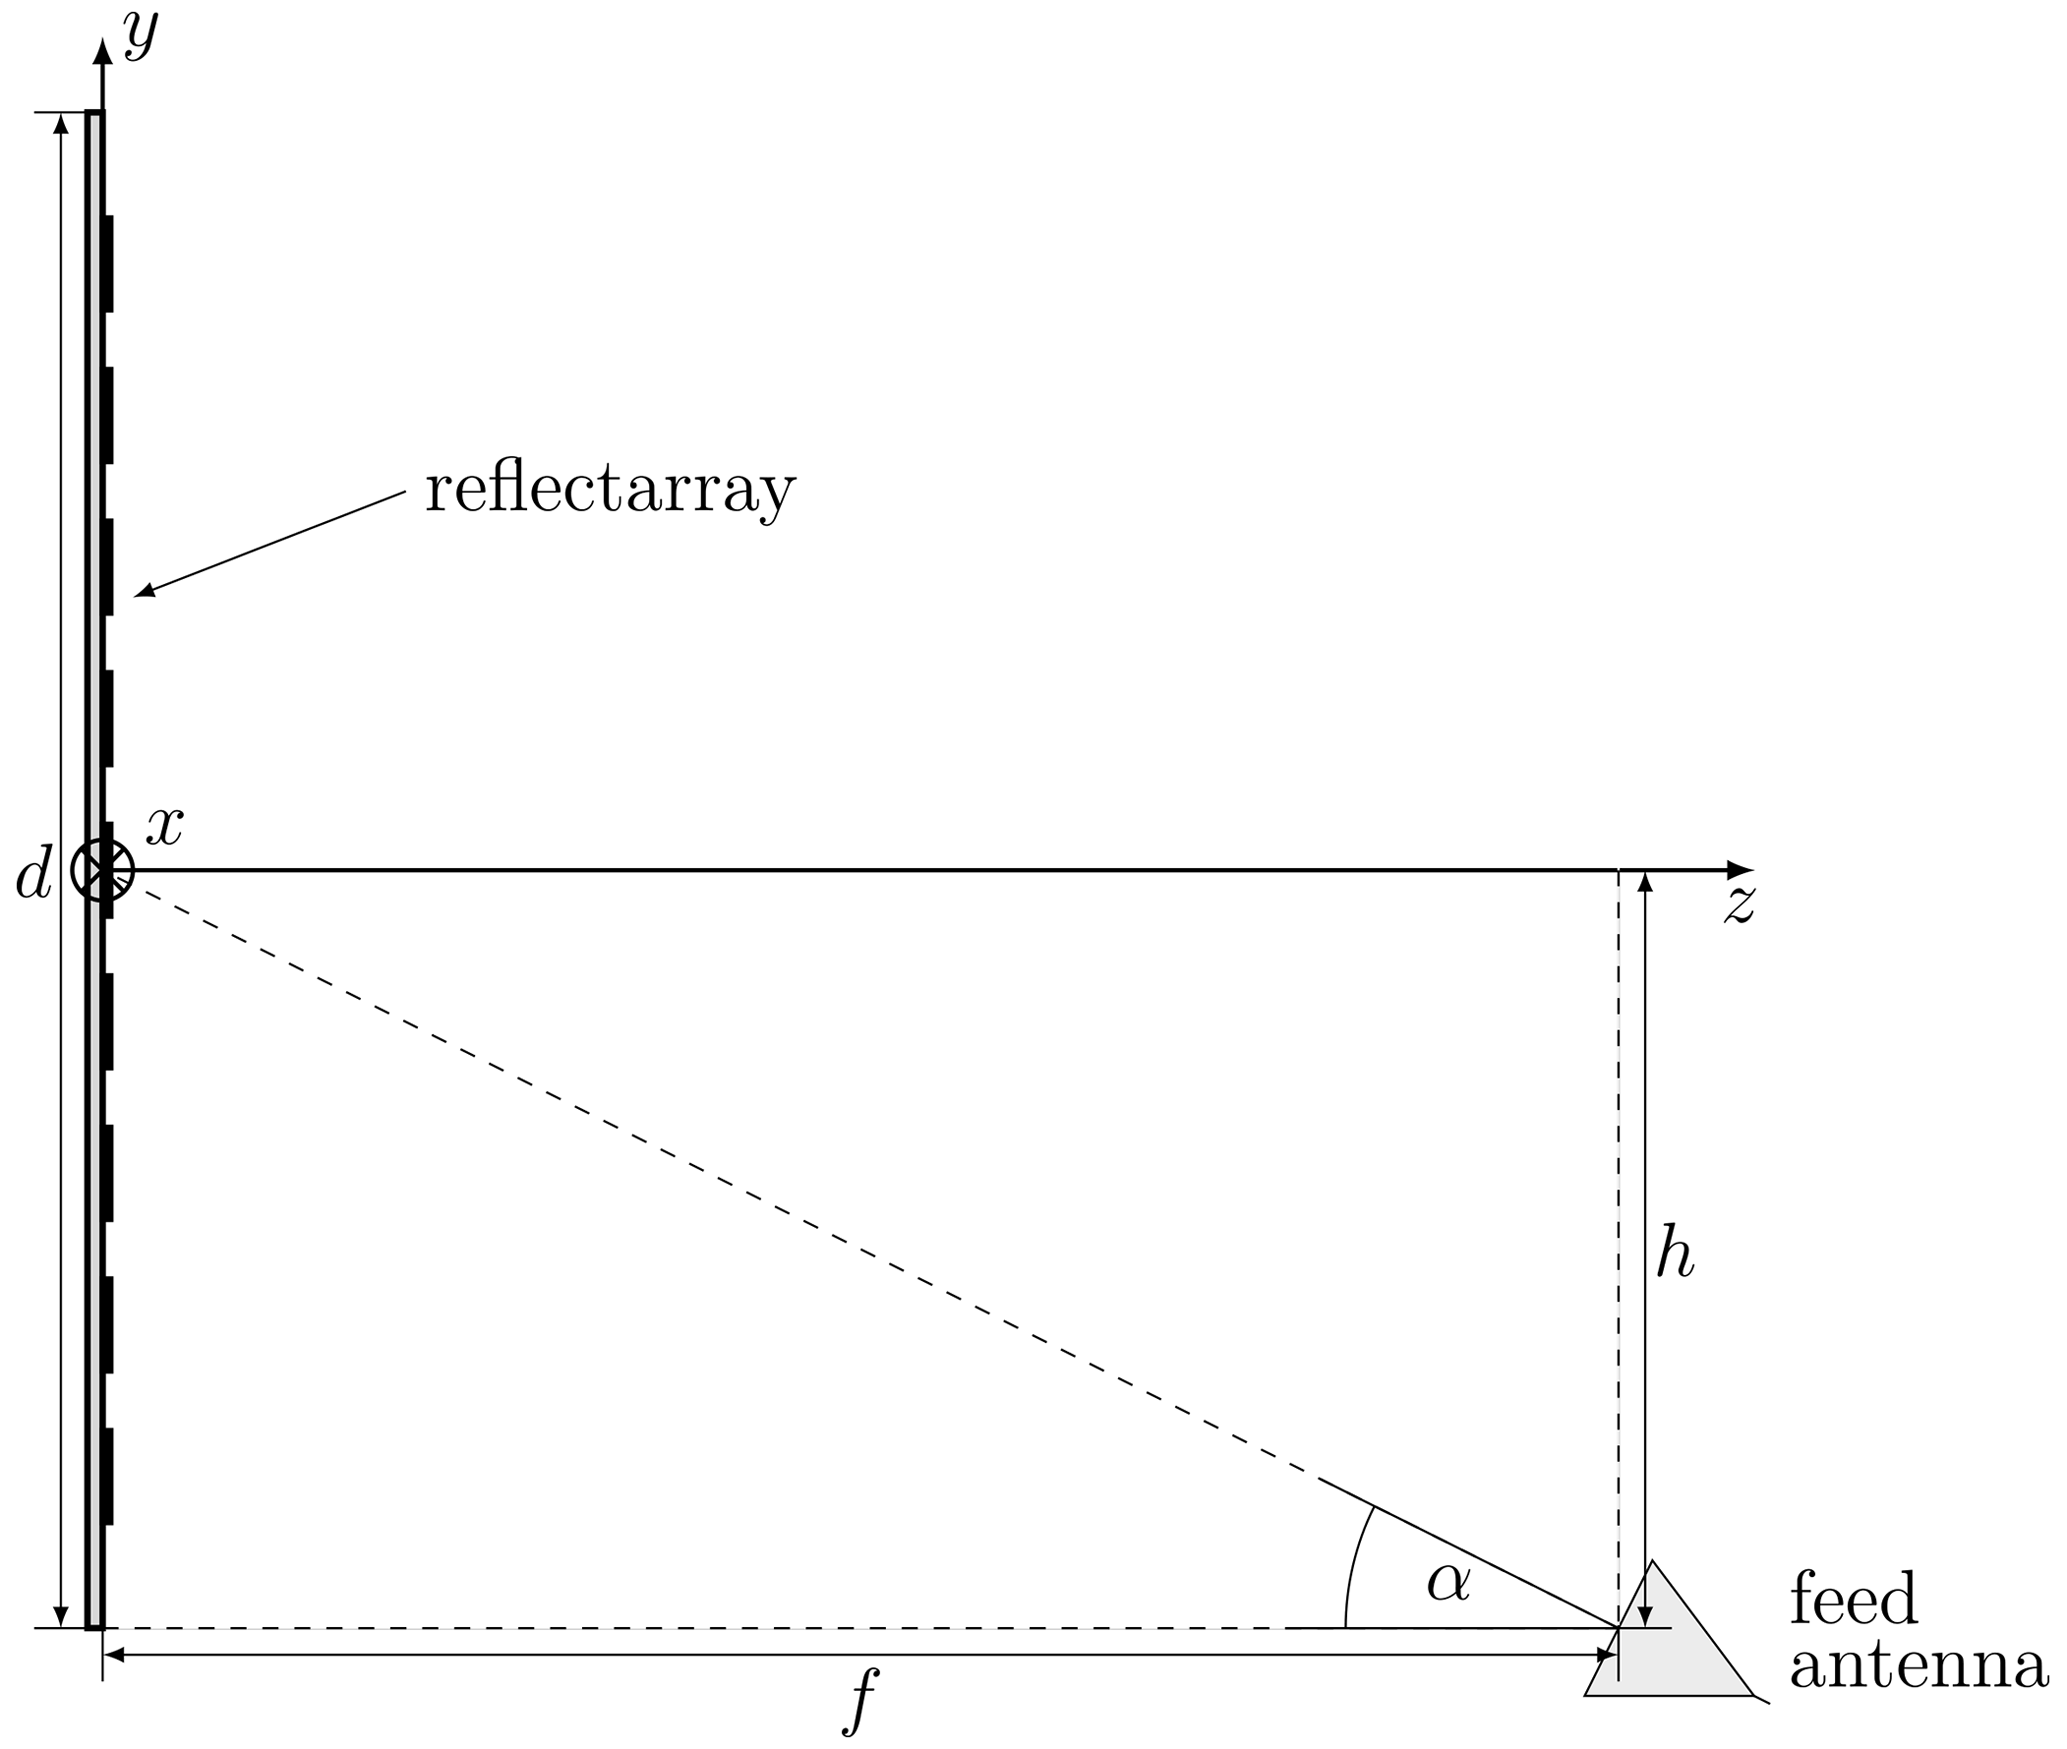
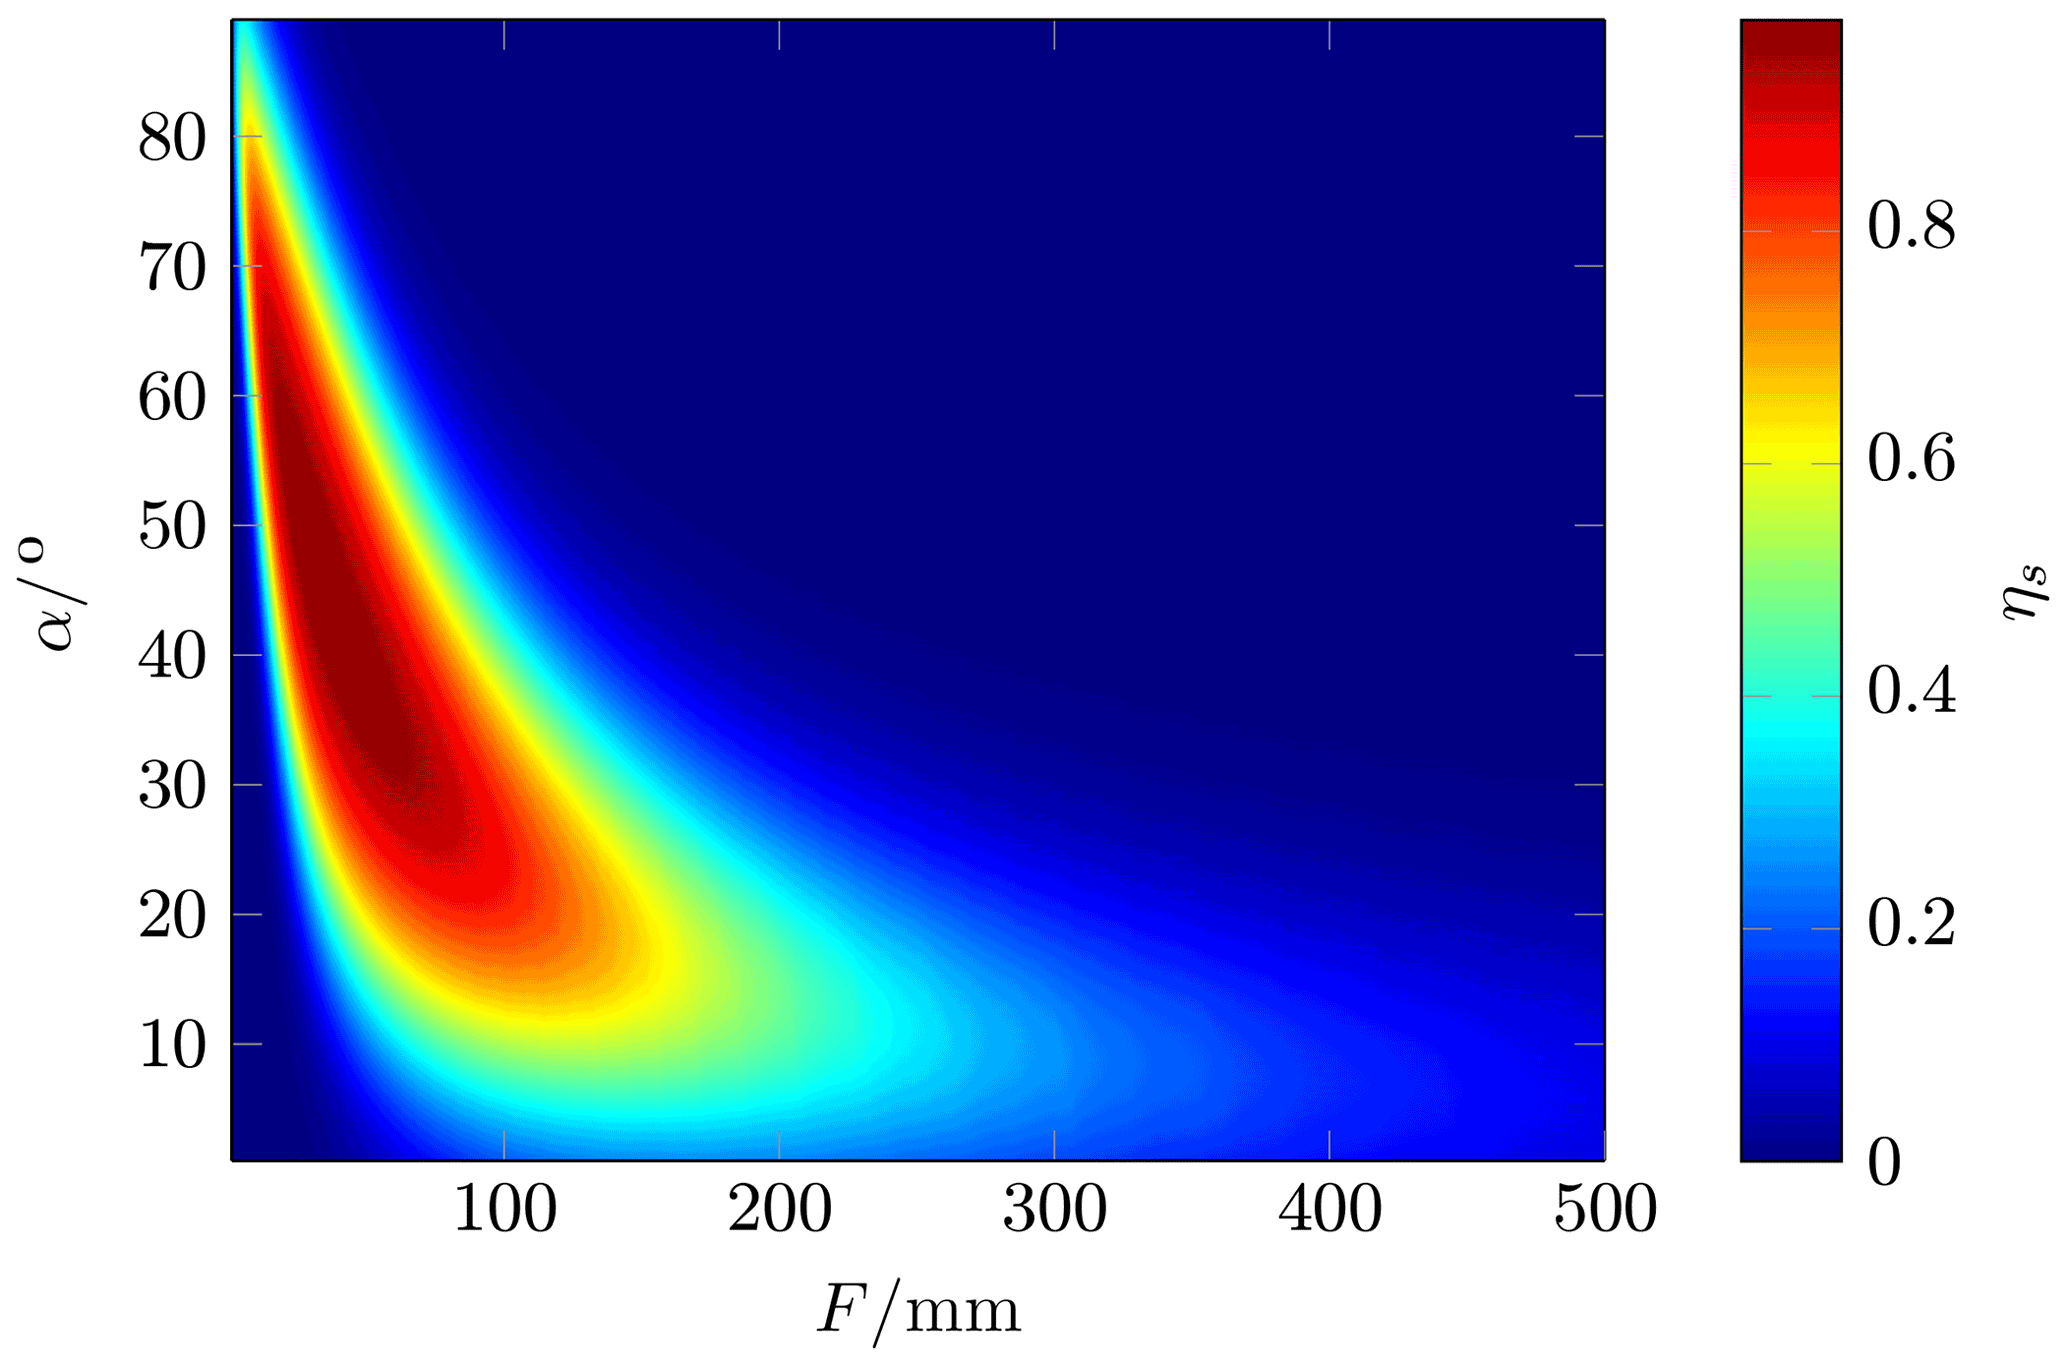
The efficiency of the reflectarray antenna depends on the position of the feed antenna. In Fig. 6, the measurement setup is shown. The feed antenna is in an offset position because of the aperture blockage. For optimizing the feed position, the offset distance h was kept constant. The focal length f and offset angle α was tuned. The efficiency ηa of the reflectarray antenna is the product of the spillover efficiency ηs and the illumination efficiency ηi (Eq. 2). In the calculation of ηs and ηi, the polarization loss, the losses in the feed antenna and in the antenna element are not considered.
The radiated power density vector P(r) of the feed antenna is distributed on a sphere surface (Fig. 7), but only a part of the overall power is used by the reflectarray. This ratio between the power received by the reflectarray and the total radiated power is the spillover efficiency. It is expressed by:
Figure 8 shows the result of varying both focal length f and offset angle α with an offset distance of h=50 mm, a reflection array size of 70 mm × 70 mm, and a ETS-Lindgren 3160-09TM horn antenna as the feed antenna. As the focal length f increases, the spillover efficiency decreases because less power is received by the reflectarray. With a focal length of f=35 mm and an offset angle of α=45∘, a maximum spillover efficiency of ηs=98.2 was calculated.
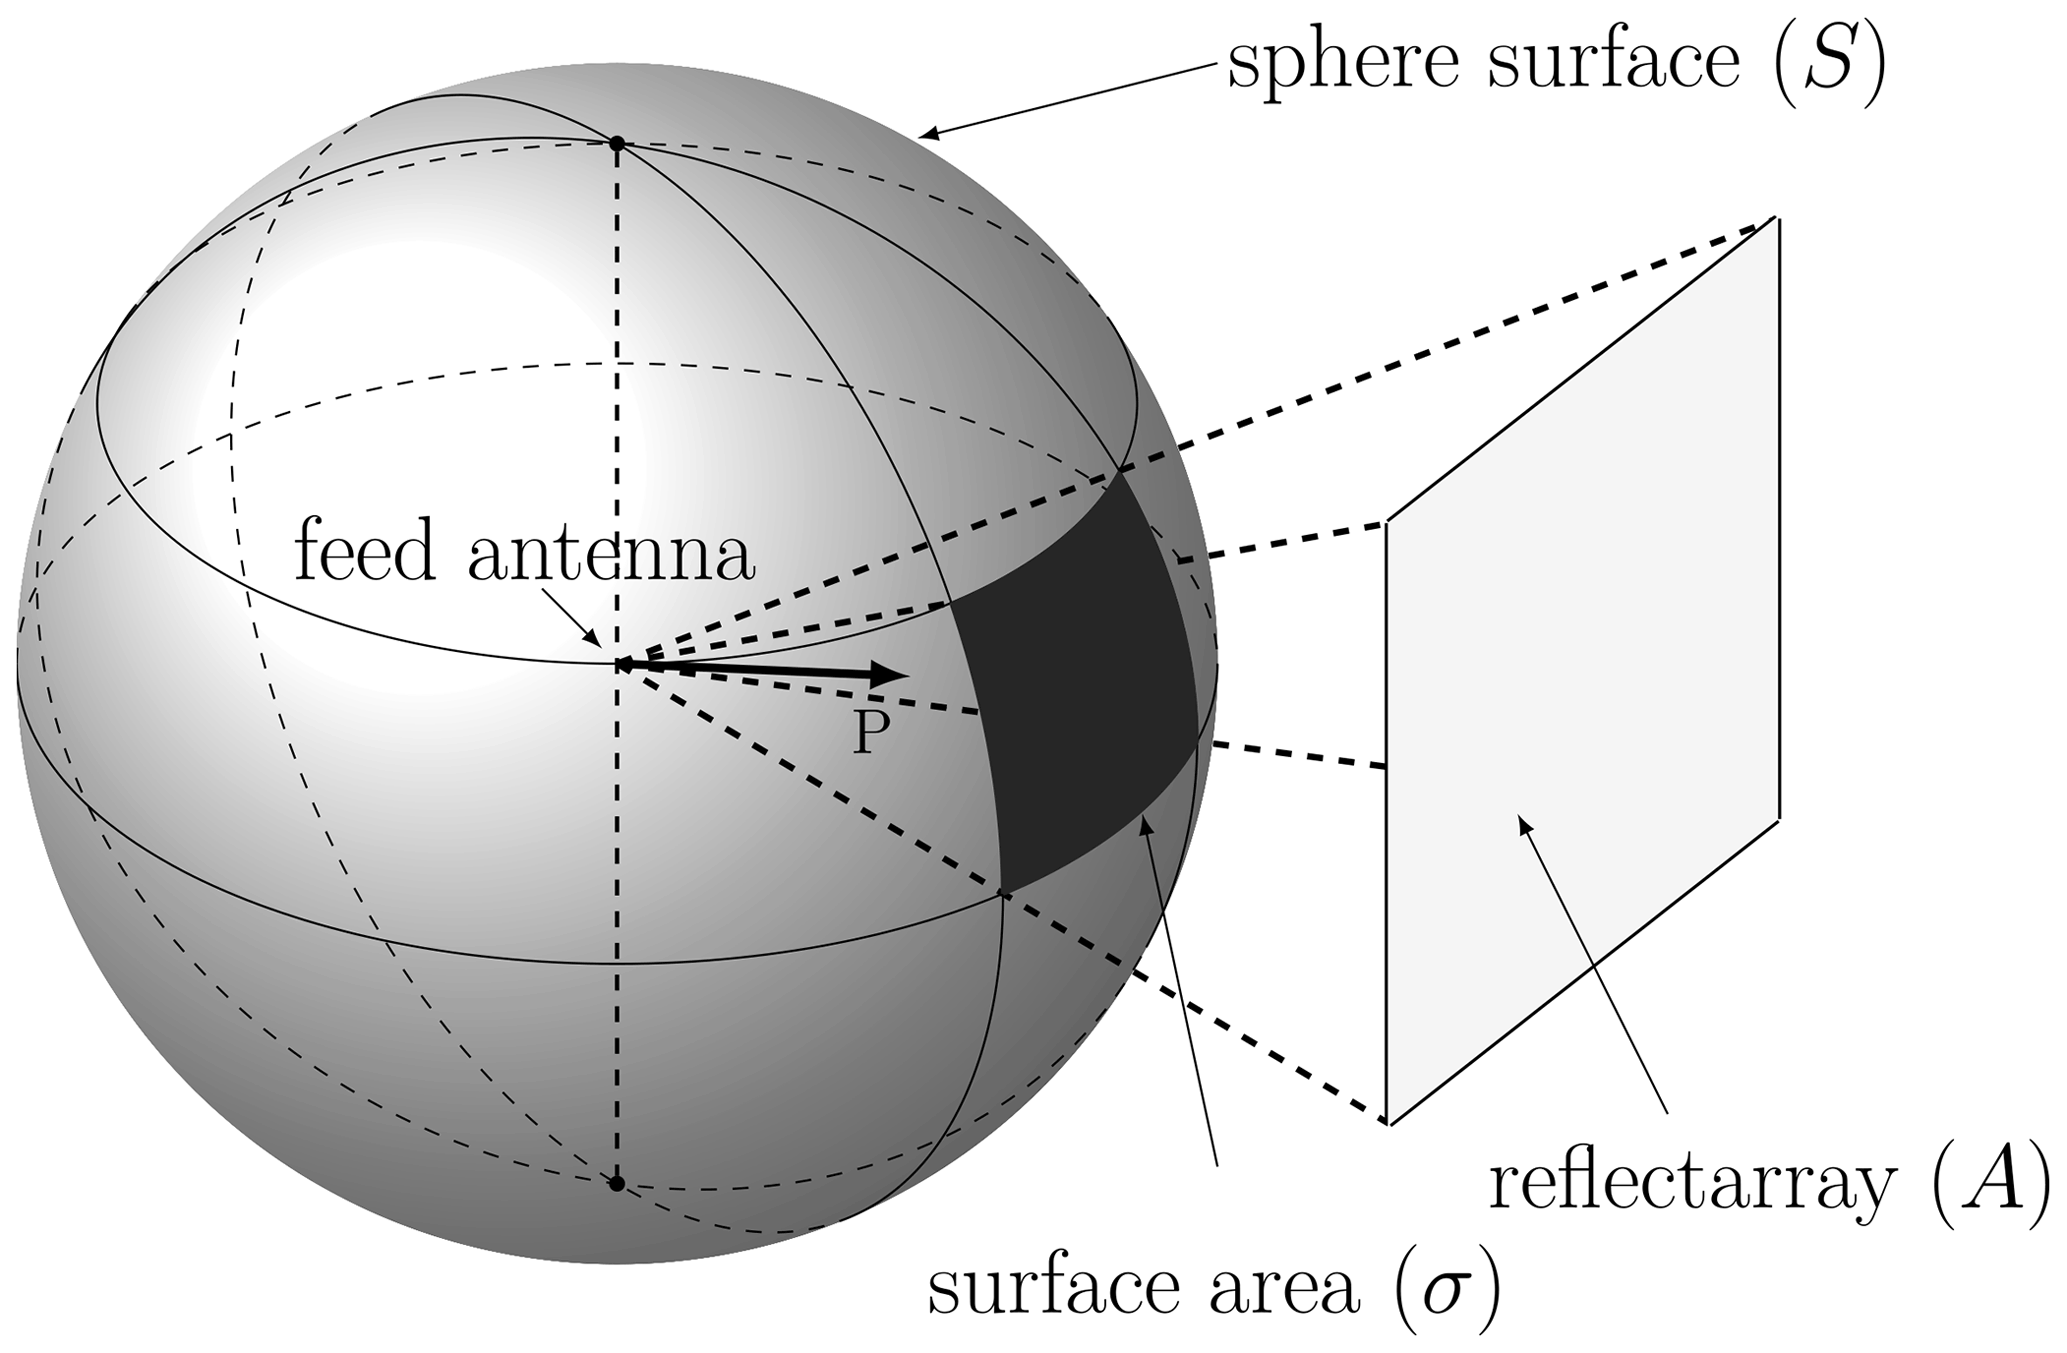
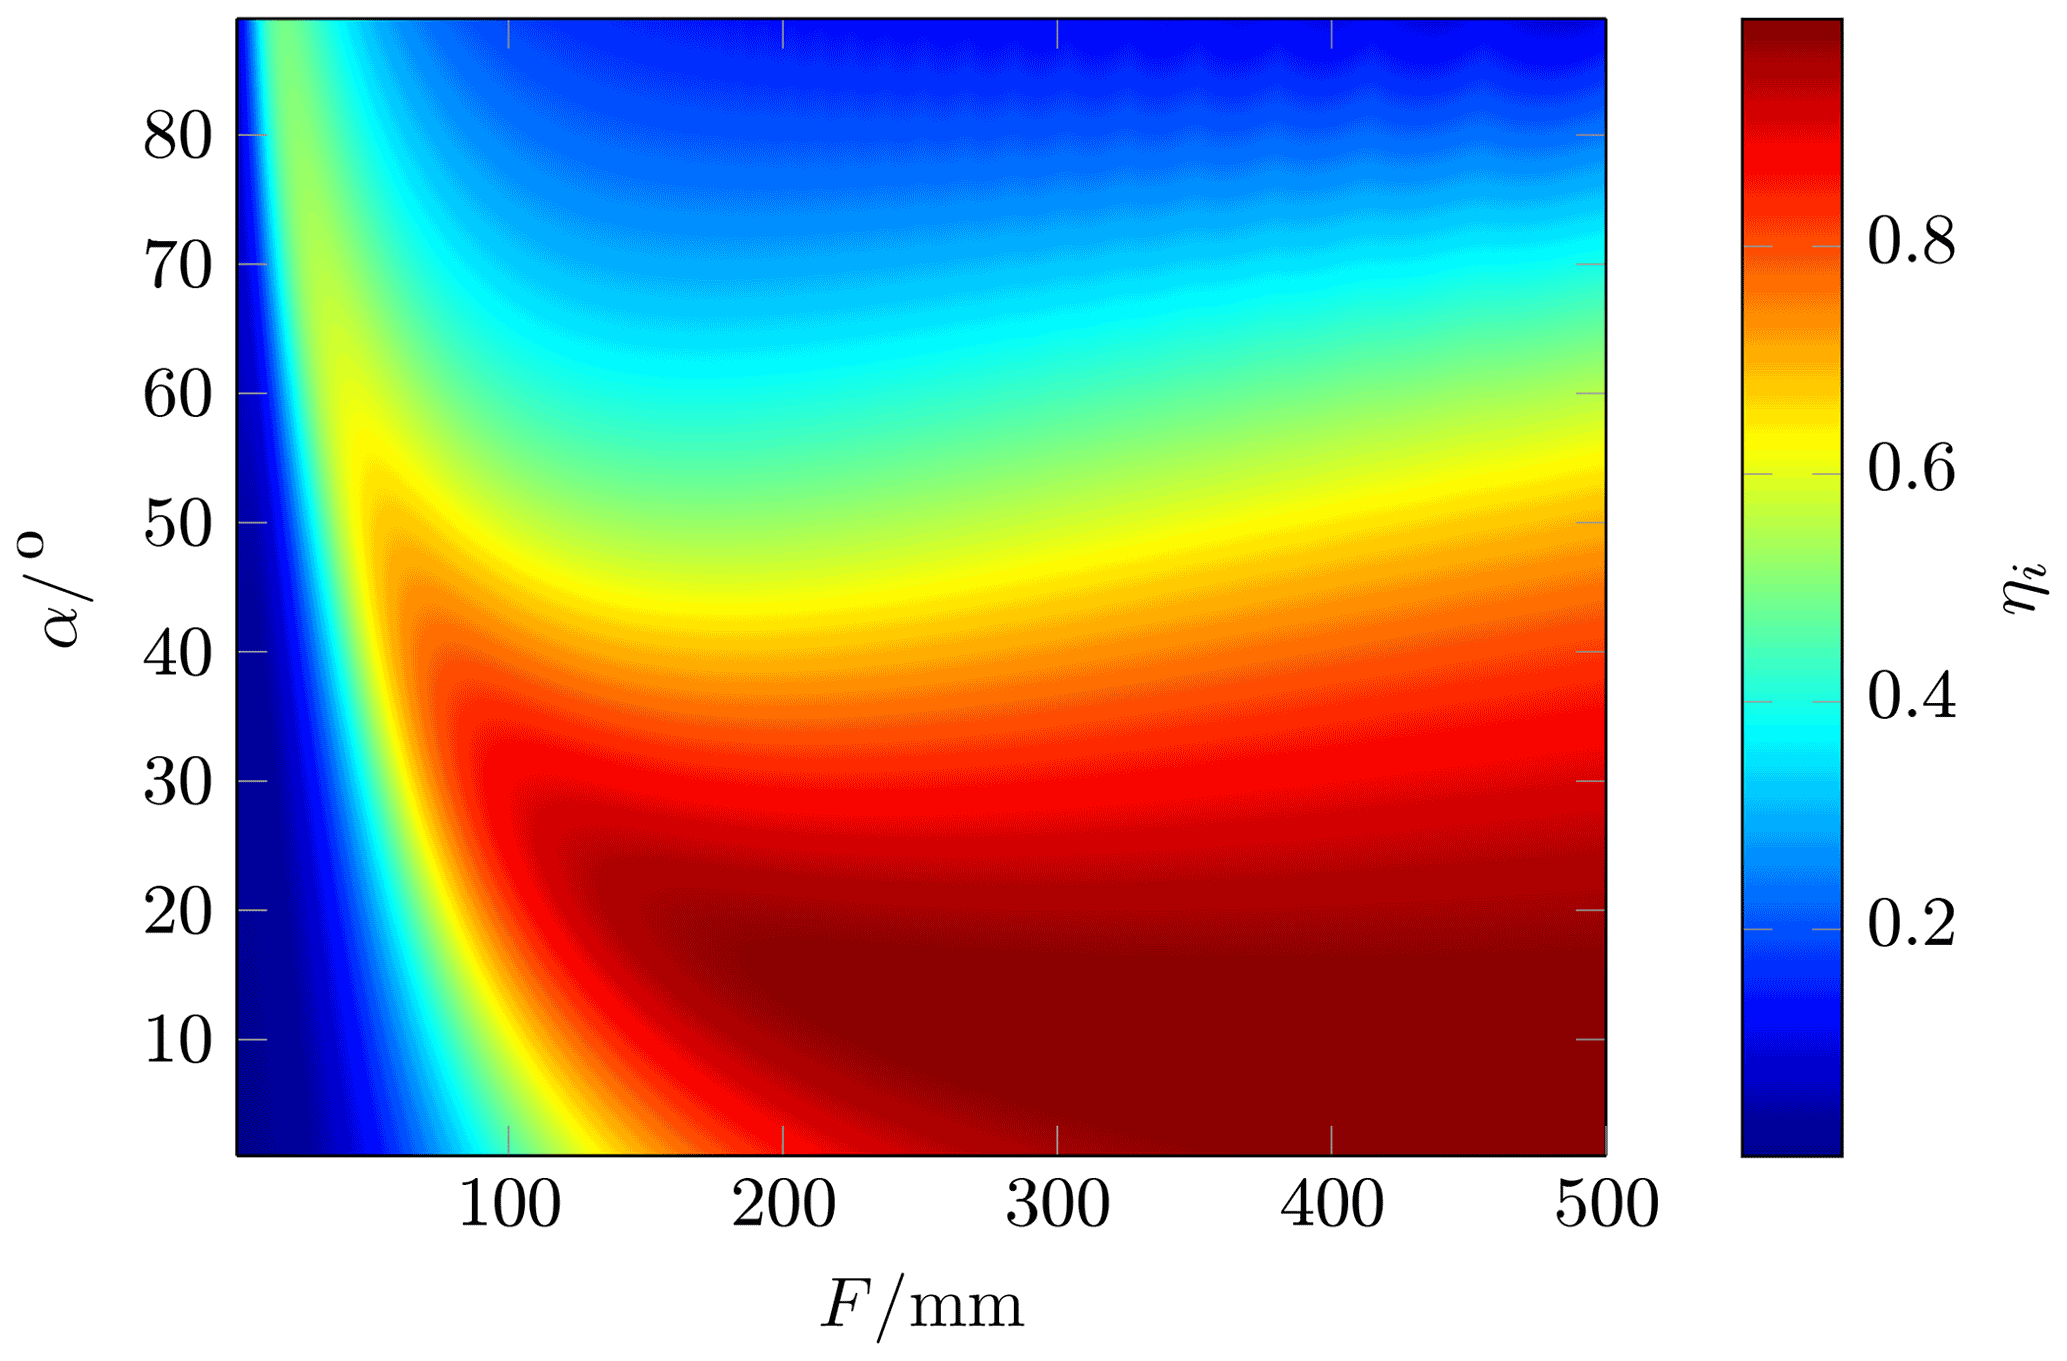
The illumination efficiency is given by:
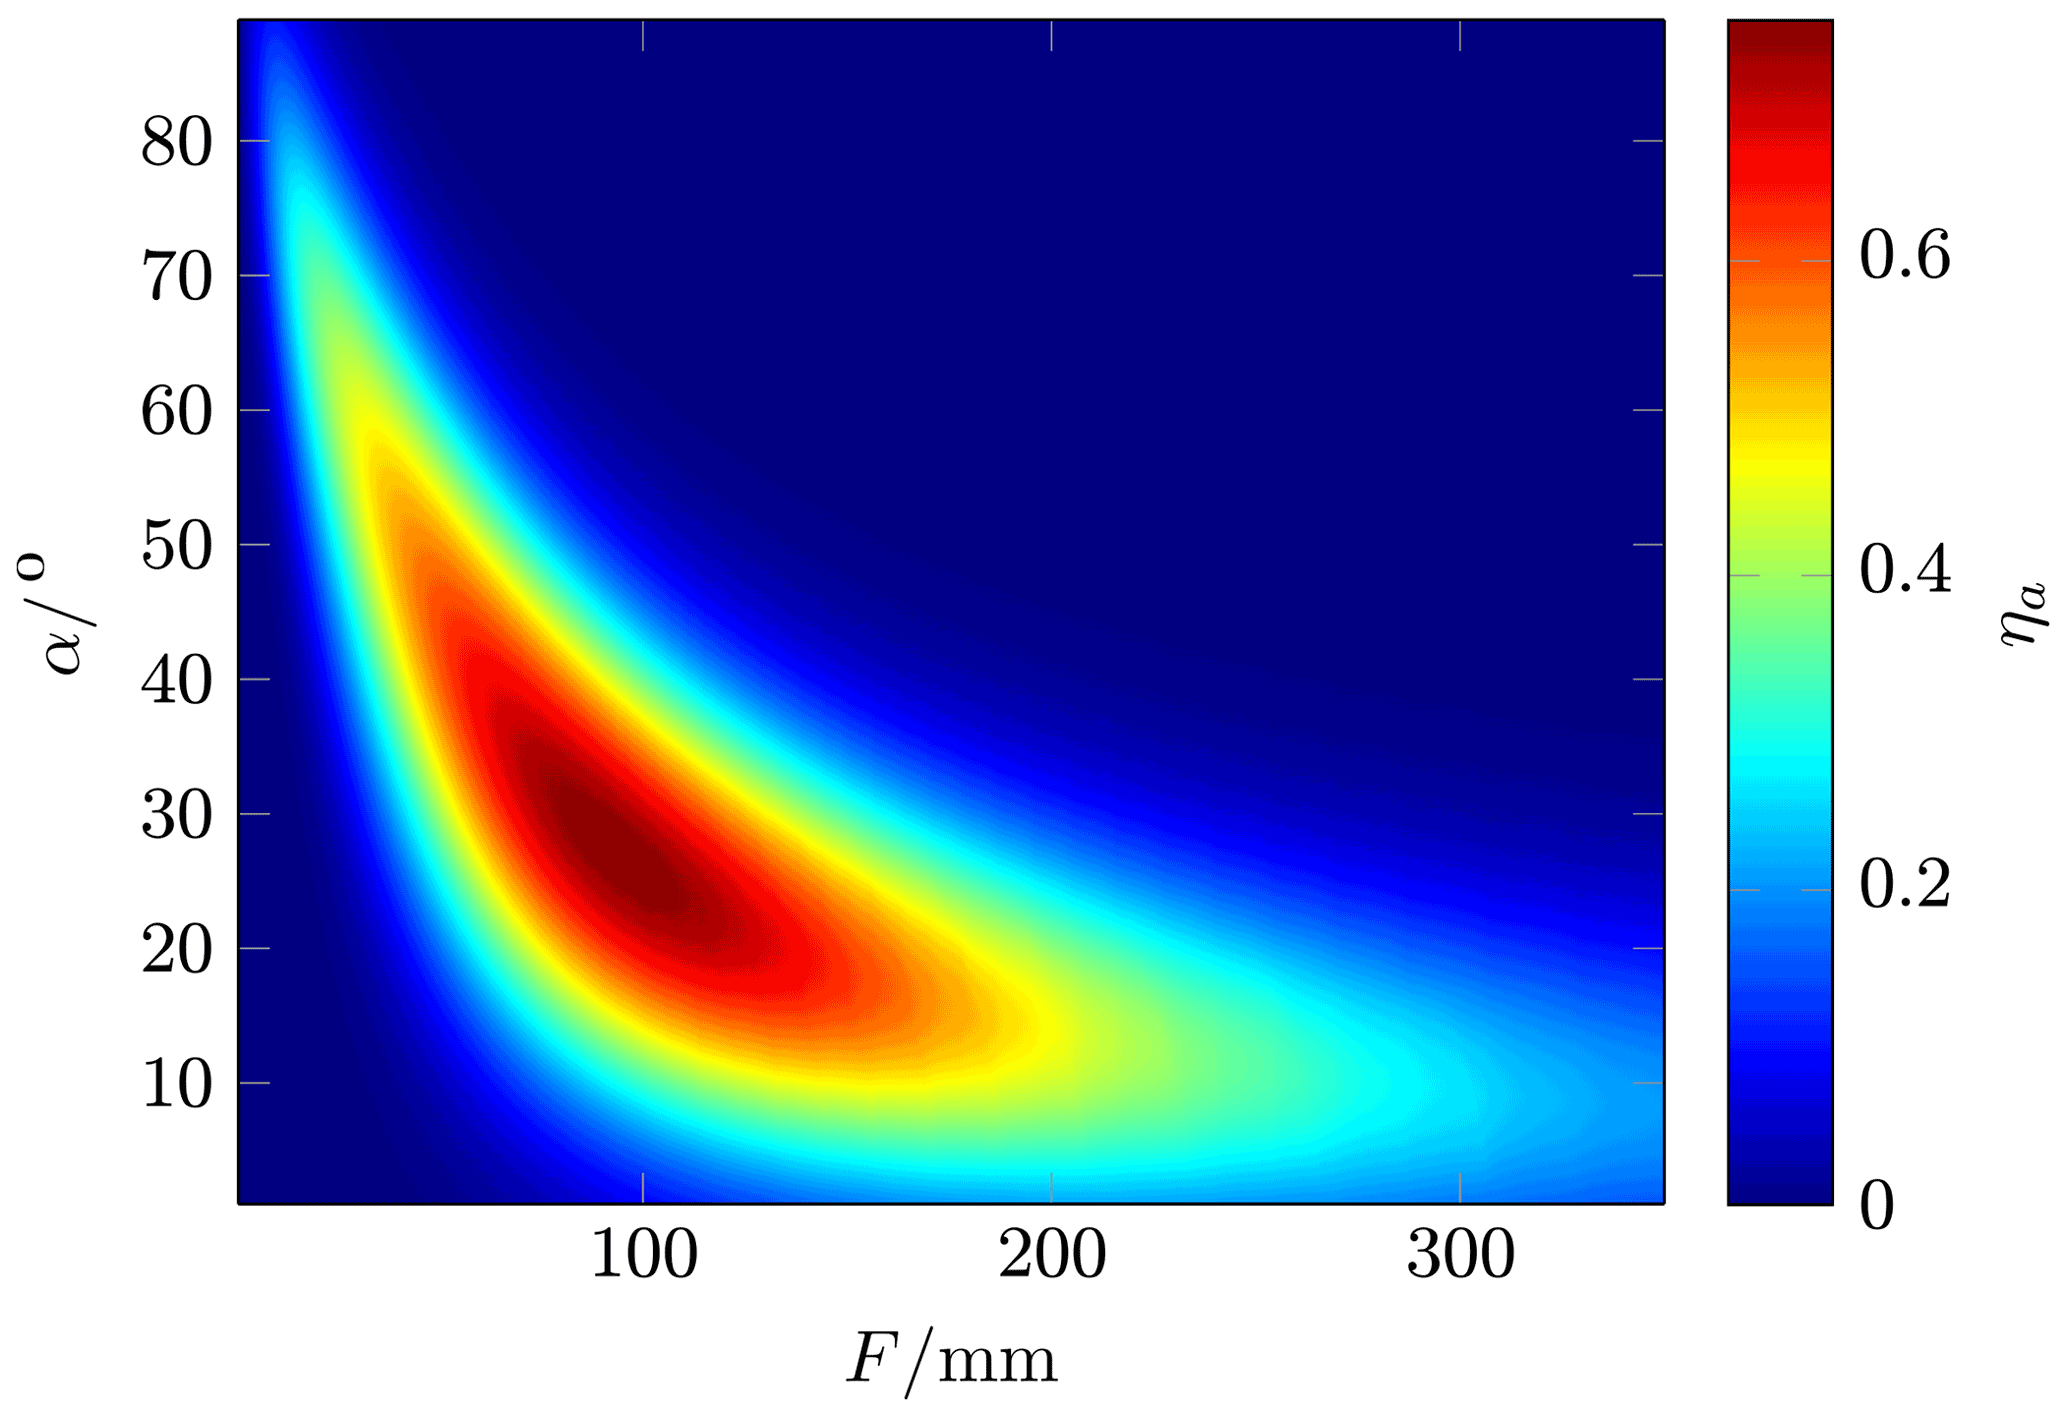
It describes how homogeneously the surface A in Fig. 7 is illuminated (Ang et al., 2010). The amplitude distribution I(x,y) depends on both the pattern of the feed antenna and the antenna element. The illumination efficiency increases with focal length f since the surface is radiated more homogeneously (Fig. 9). Therefore, the maximum illumination efficiency is 99.9 % at the maximum calculated distance. The computed efficiency ηa is shown in Fig. 10. The minimum distance where the efficiency is higher than 75 % depends on the illumination efficiency, and the maximum distance is limited by the spillover efficiency. The maximum efficiency ηa=75.3 % was calculated at f=96 mm and α=27∘.
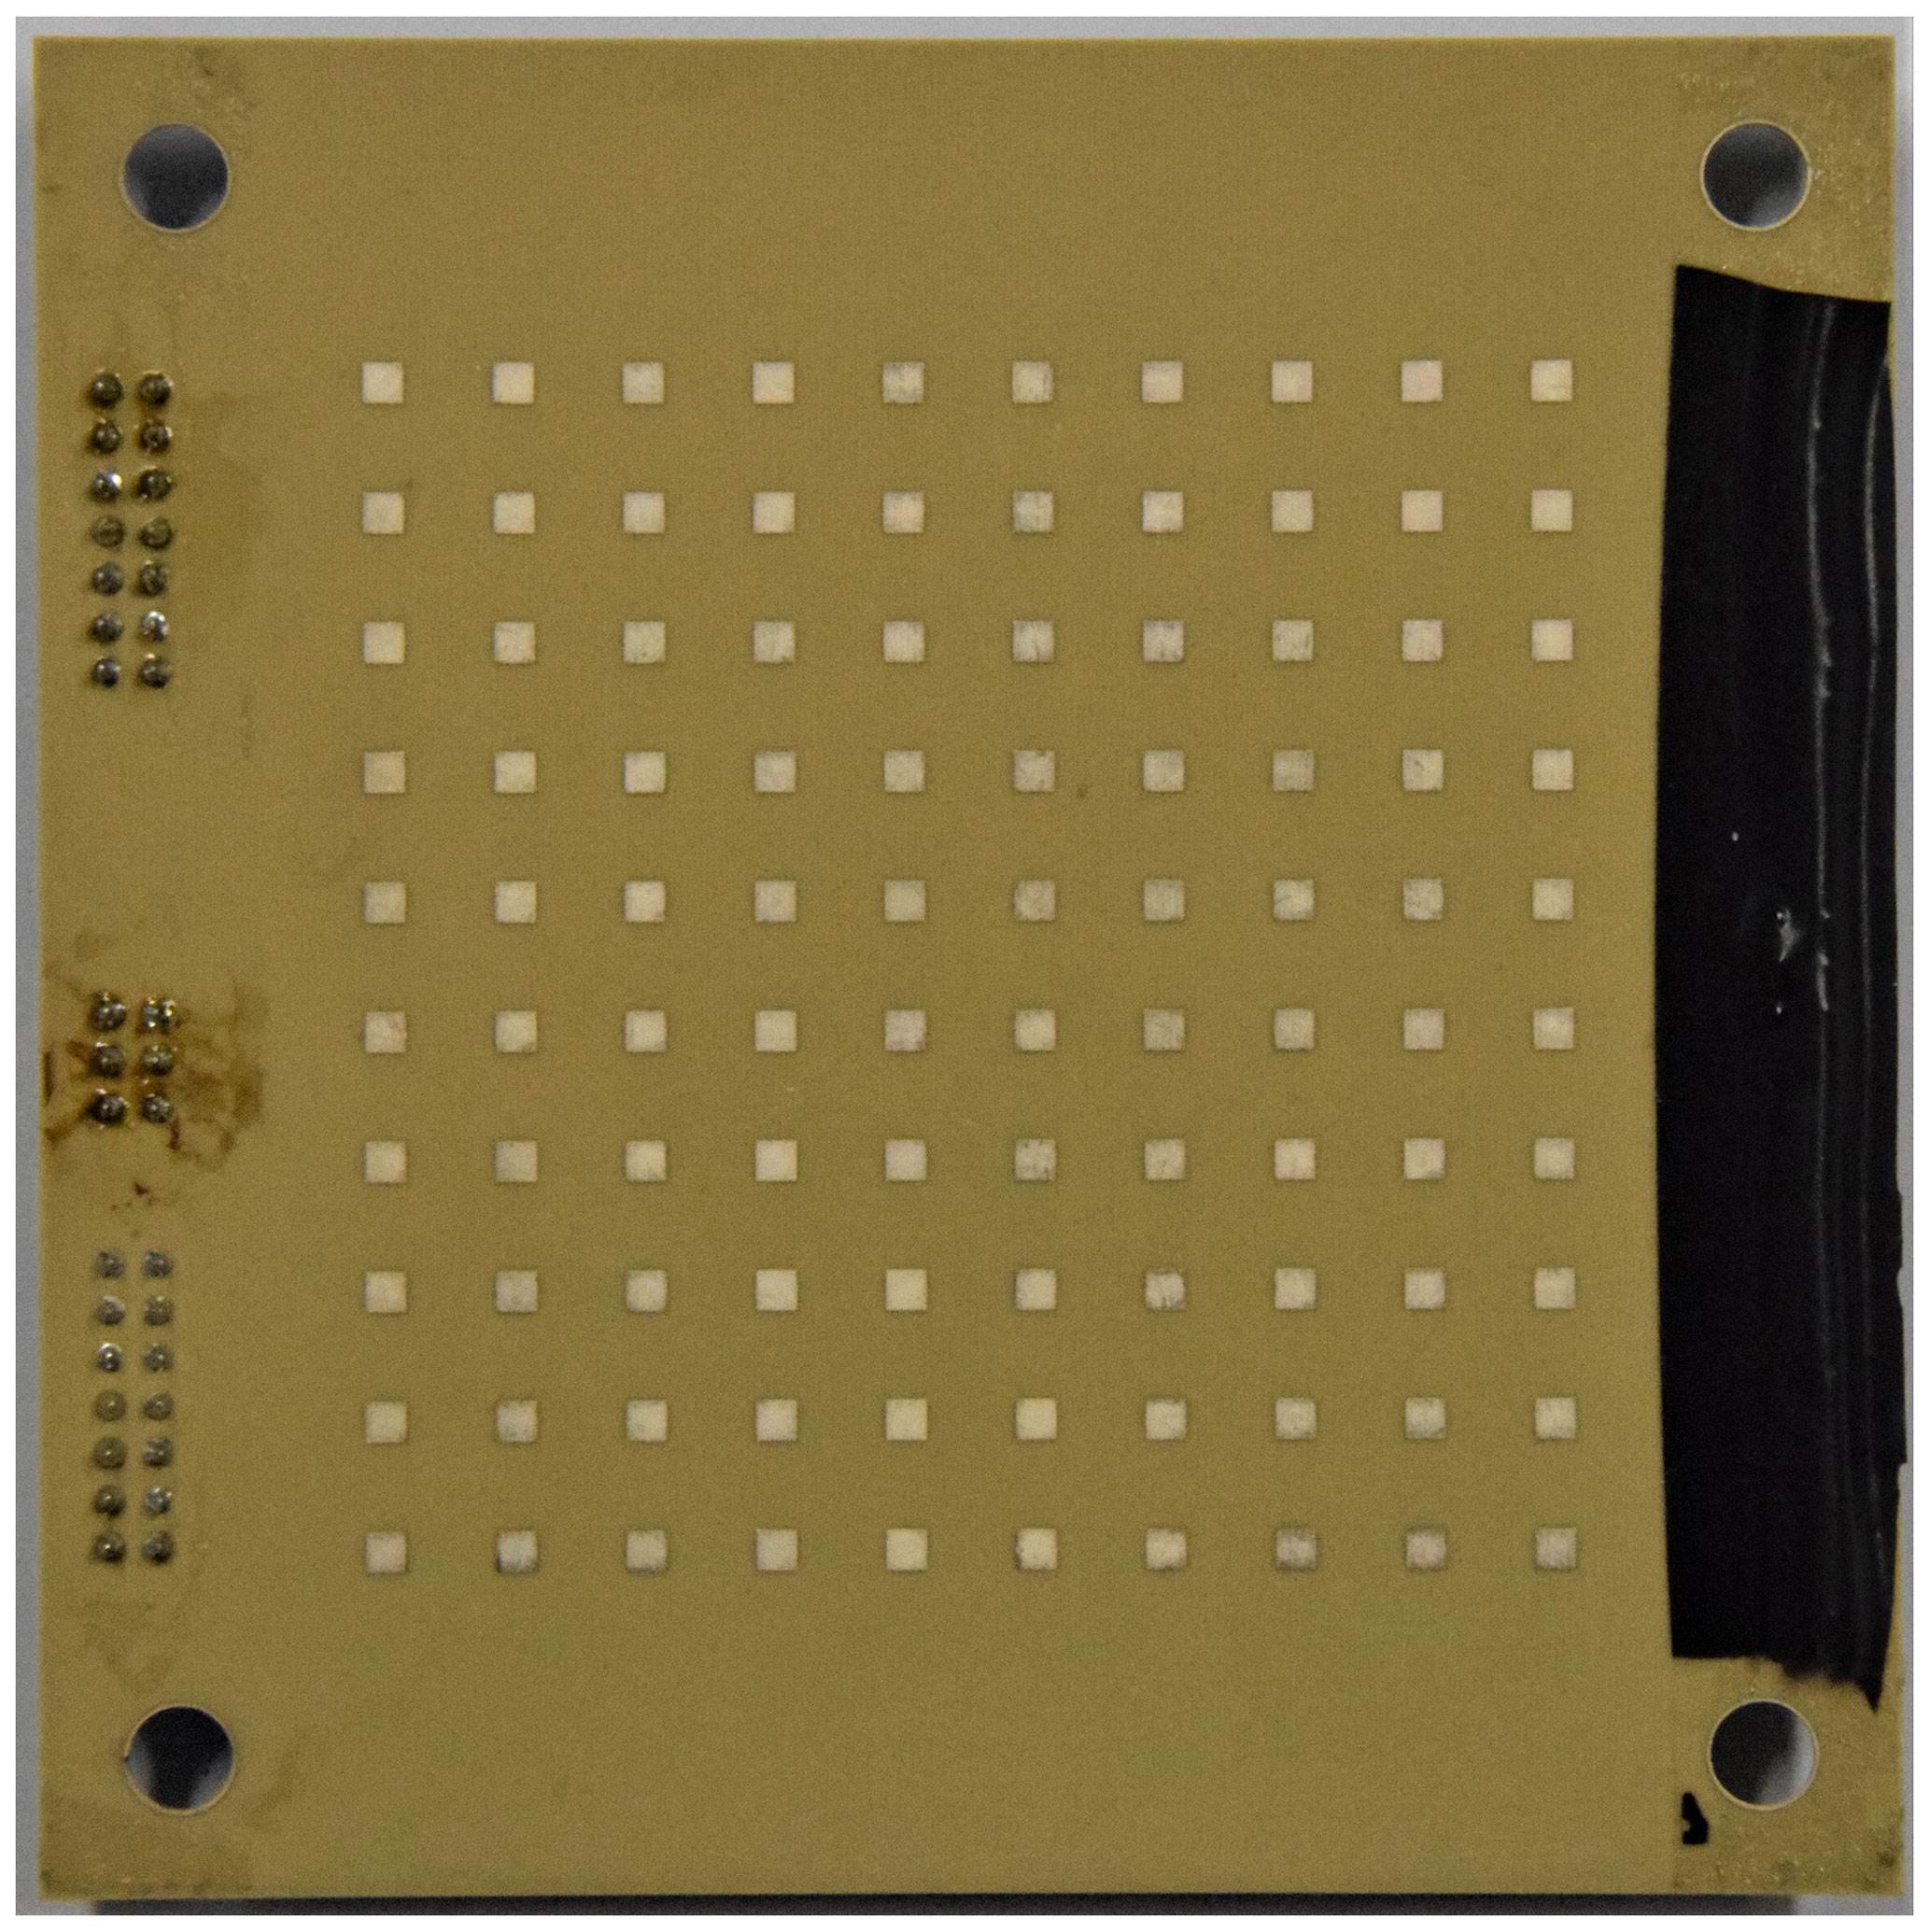
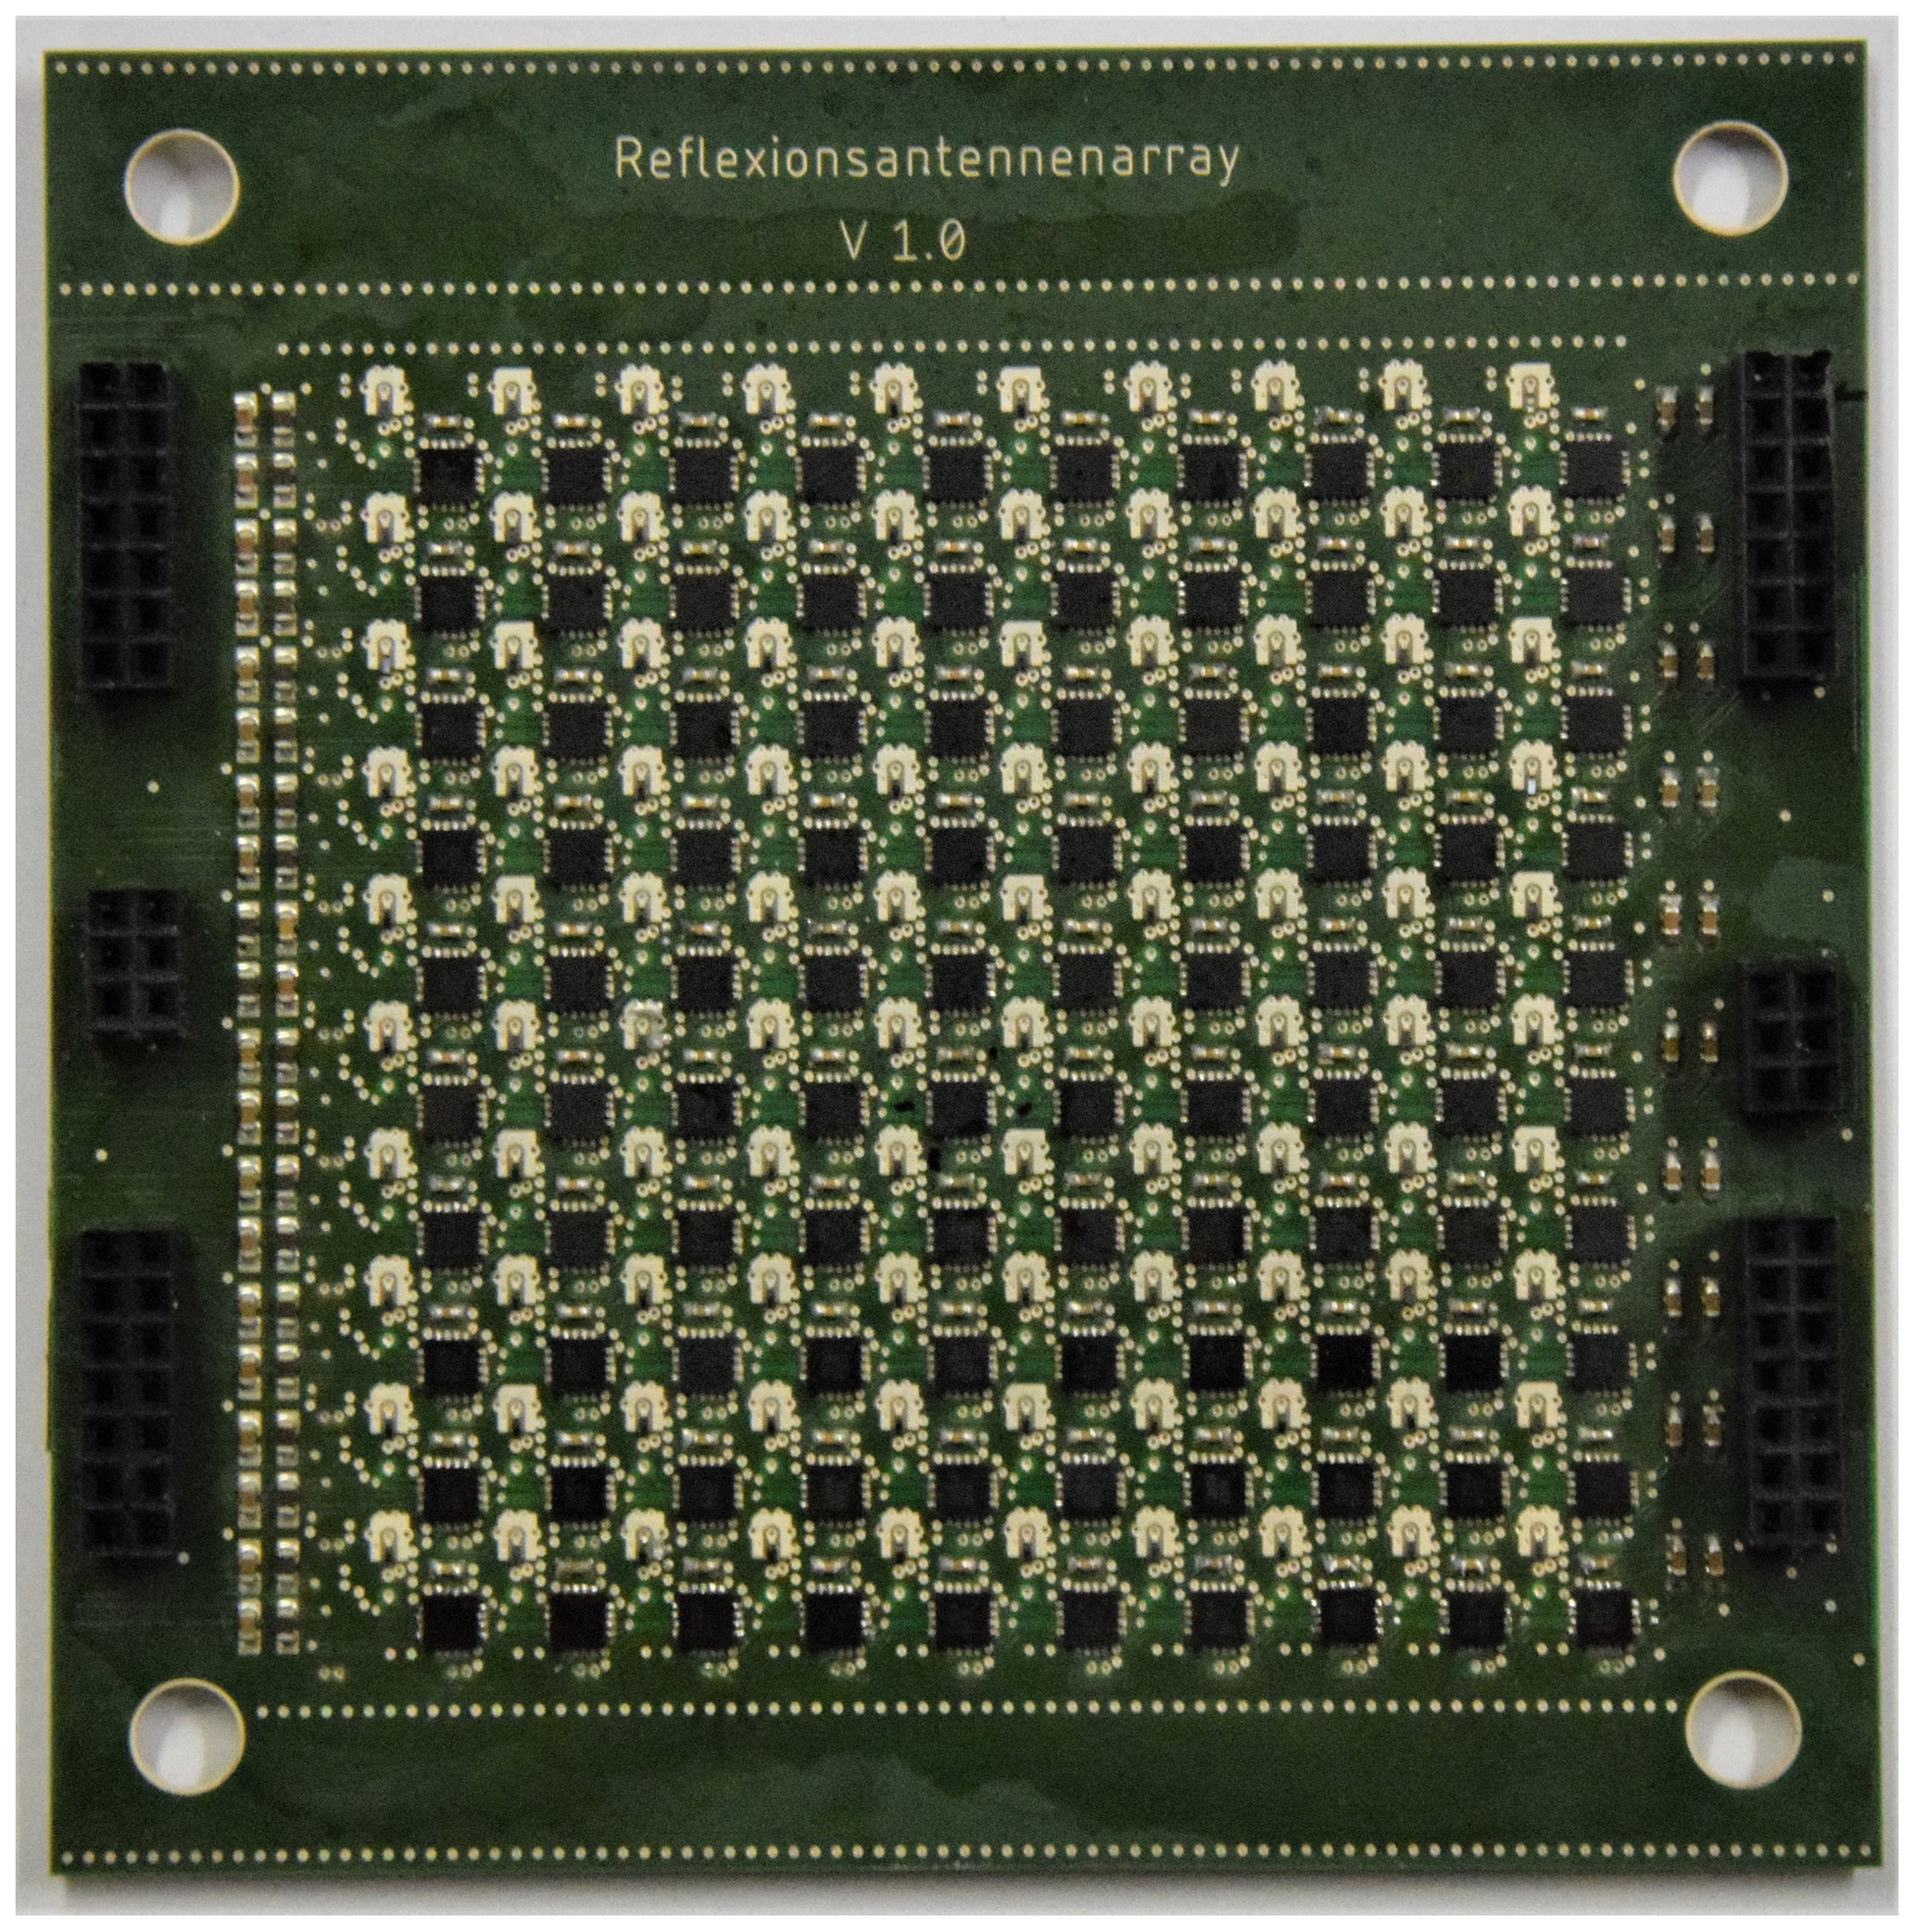
A reflectarray antenna was fabricated. Two circuit boards were developed (Figs. 11, 12), one of which contains the 10×10 reflectarray with the varactor diodes and the digital-to-analog-converters (DACs). The other PCB controls and supplies the DACs with the appropriate voltage. Each antenna element has one varactor diode and a DAC for voltage control. The deployed DAC AD5761BCPZ-RL7TM has 16 bit resolution to supply the varactor diode. These two parts, varactor diode, and DAC fit in the area of the antenna element so that the reflectarray antenna can be scaled up. The 100 DACs are divided into ten rows. In one row are 10 DACs where the Serial Peripheral Interface (SPI) for programming is connected via a daisy chain, and every row is programmed separately with a microcontroller. A bus buffer is inserted for each row to isolate the input capacitance of the DACs from the microcontroller output. The microcontroller receives information about the required voltage for every varactor diode from the personal computer via Universal Serial Bus (USB). The personal computer calculates the phase for each antenna element according to:
Here, k is the wavenumber and bi is the distance between the antenna element and the feed antenna. The coordinates of the antenna element are xiyi and ϕ,θ are the steering angles of main beam.
The phase-voltage relationship of the wave reflected from the reflectarray antenna was determined to verify the results of the waveguide simulator. The reflectarray antenna was illuminated by a horn antenna, and the reflection coefficient of the horn antenna was measured at different voltages at the varactor diodes. The calibration for this measurement setup was done in two stages: First, a one-port waveguide calibration was performed on the flange where the horn antenna was mounted. Second, normalization was done with a metal plate positioned at the location of the reflectarray. Figure 5 shows the phase voltage curve of the reflectarray antenna at 25.8 GHz and of the antenna elements (waveguide simulator) at 26.1 GHz (the center frequency has shifted). The differences between the two measurements are expected to be due to the tolerances in production.
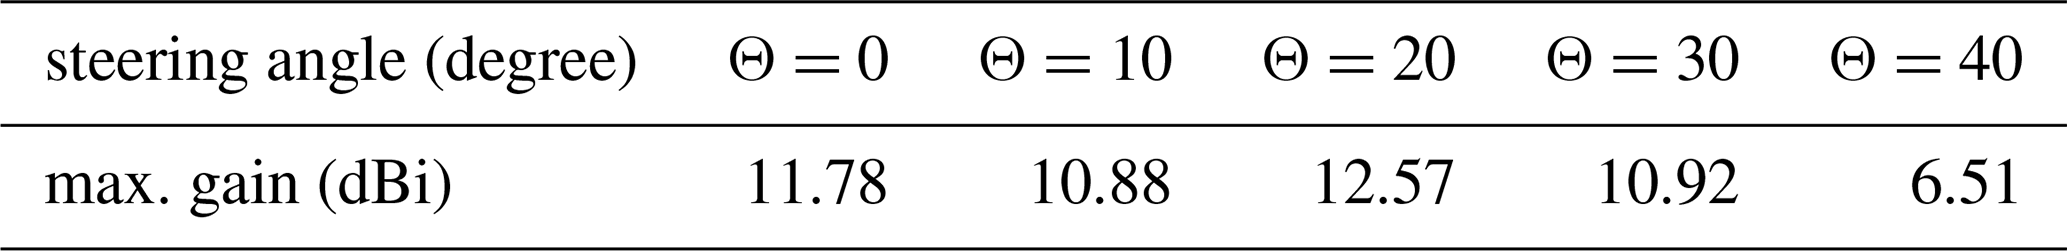
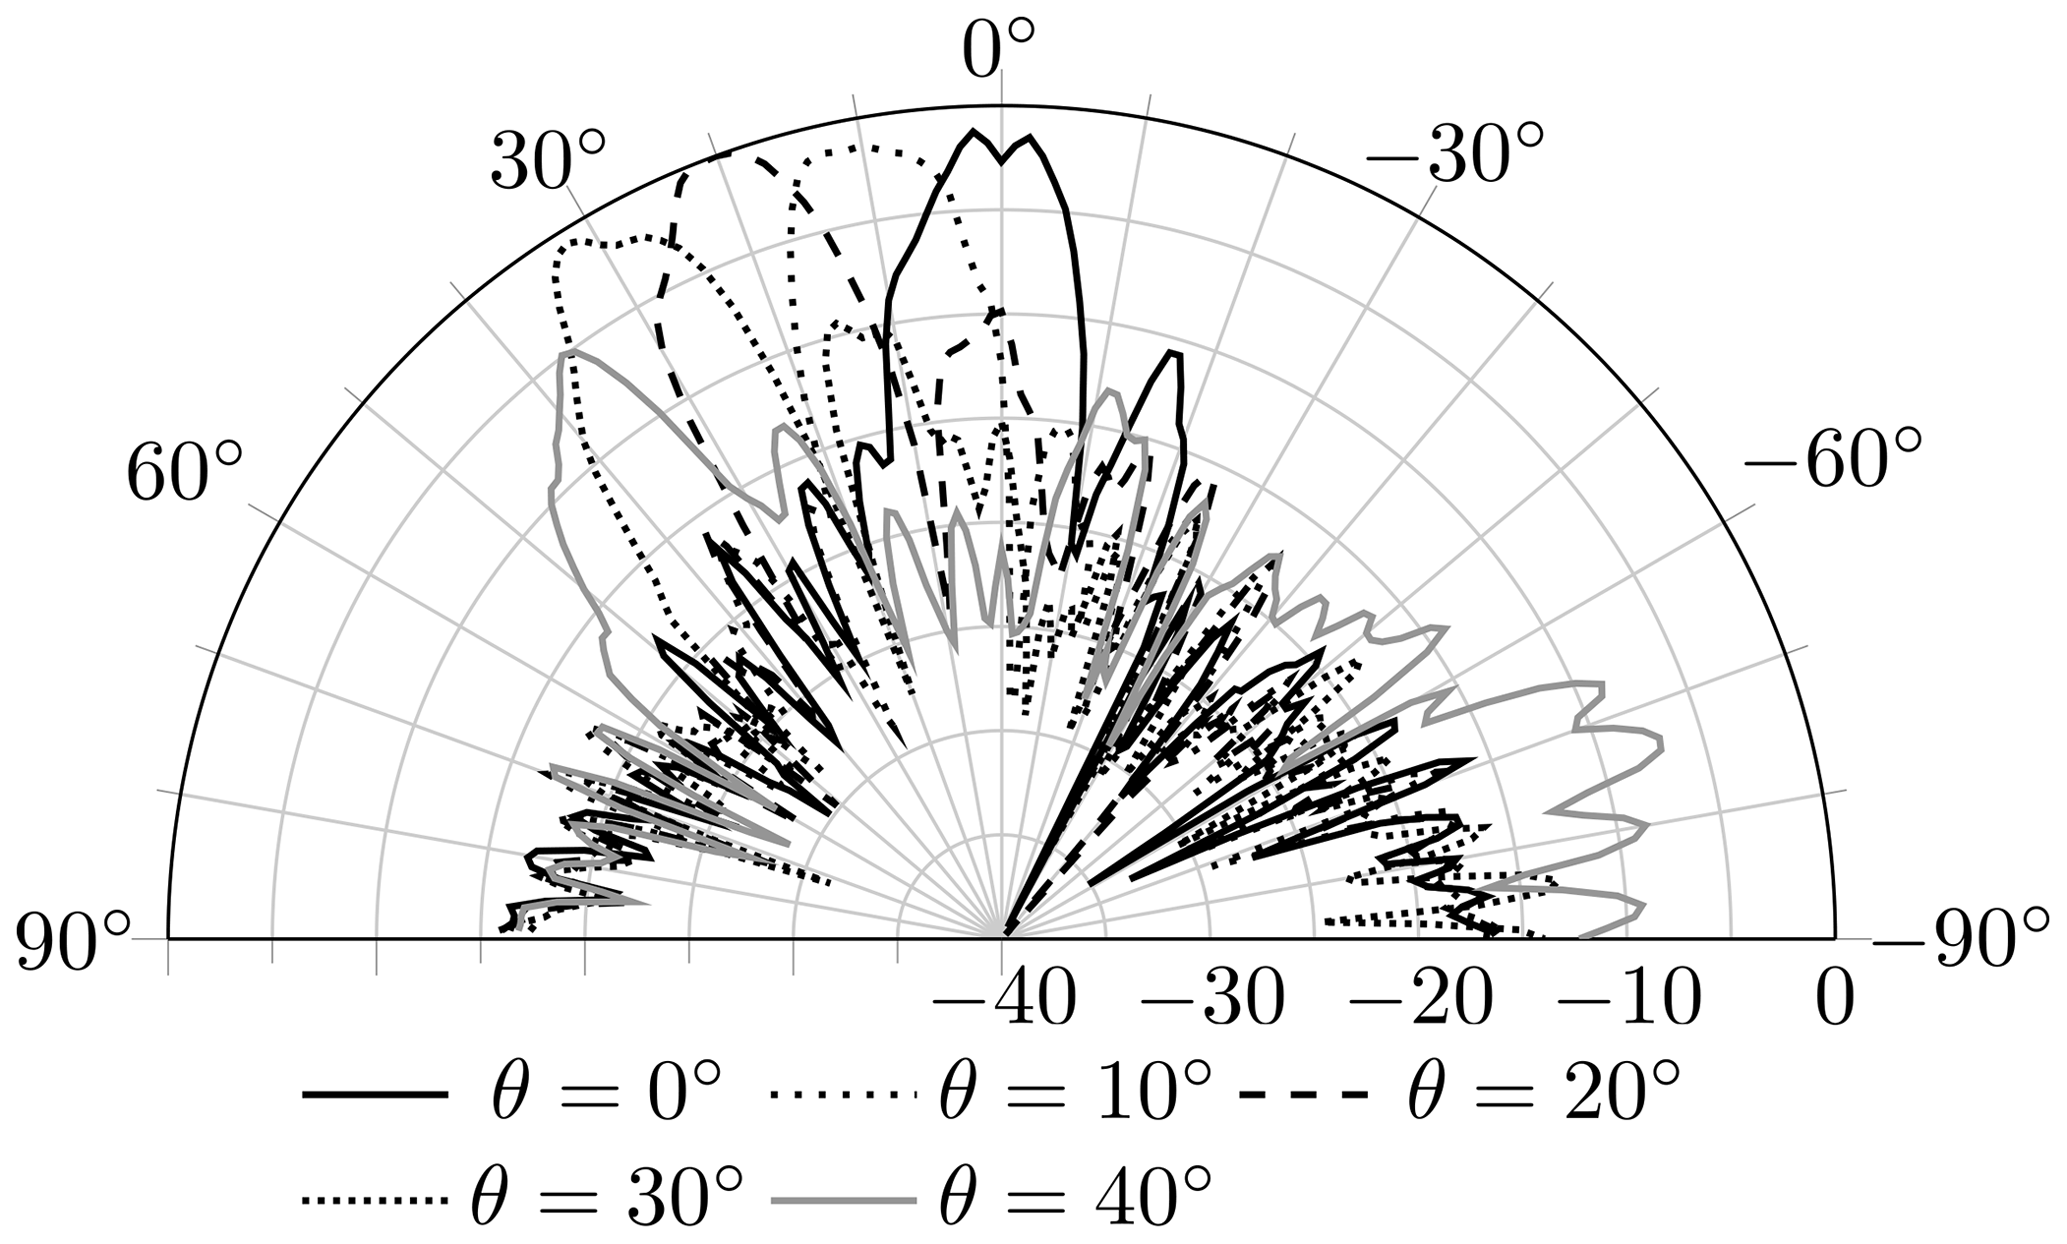
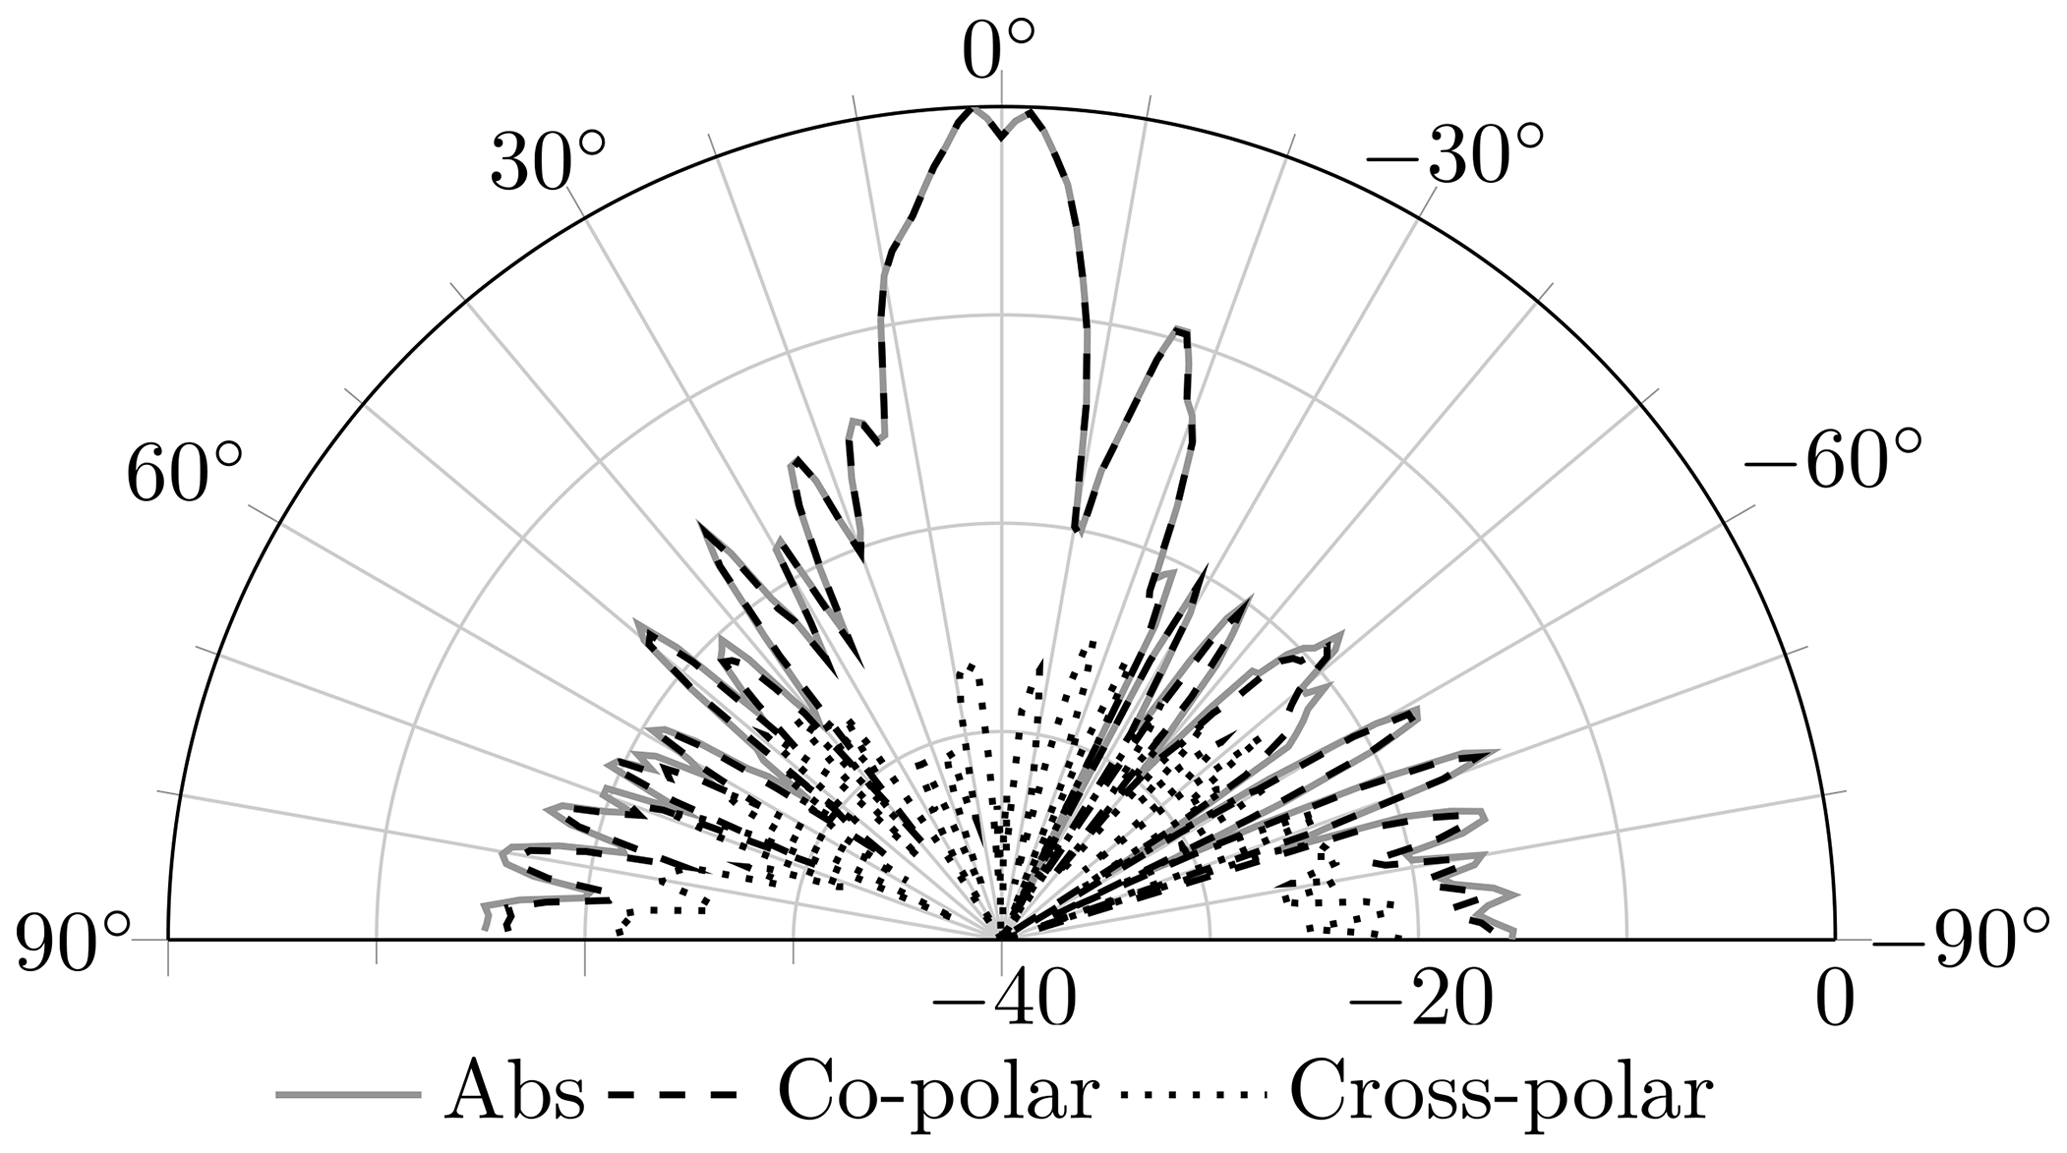
The beam steering of the reflectarray antenna was verified in an anechoic chamber. The direction of the beam was changed from Θ=0∘ to Θ=40∘ in the H-plane (xz-plane in Fig. 6). At a steering angle of Θ=40∘, the gain decreases by 4 dB, and the grating lobes increase so that the difference between the main beam and the grating lobe is 2 dB (Fig. 13). As described by Targonski and Pozar (1994), the phase-voltage relationship depends on the angle of the incident and reflected wave. Therefore, above a certain difference, the desired antenna pattern cannot be generated. Figure 14 shows that the cross-polarization ratio is better than 25 dB. The gain of the measured beams are listed in Table 2.
A scalable and functional reflectarray antenna was presented for the K-band. It was built with commercial off-the-shelf components. The concept of Venneri et al. (2013) was applied and further developed for the millimeter-frequency band. For verification, an antenna element was produced and measured in a waveguide simulator. The position of the feed for the reflectarray antenna was optimized. The control of the phase of the reflected wave was explained, and the antenna patterns for different steering angles were analyzed.
The code and data are available from the authors upon request.
TKO devised the main conceptual ideas. TH planned and carried out the simulations and measurements. All authors provided critical feedback and helped to write the manuscript.
The contact author has declared that neither they nor their co-author has any competing interests.
Publisher’s note: Copernicus Publications remains neutral with regard to jurisdictional claims in published maps and institutional affiliations.
This article is part of the special issue “Kleinheubacher Berichte 2020”.
This open-access publication was funded by the Physikalisch-Technische Bundesanstalt.
This paper was edited by Thorsten Schrader and reviewed by two anonymous referees.
Ang, Y., Yang, F., Elsherbeni, A., Huang, J., and Rahmat-Samii, Y.: Aperture efficiency analysis of reflectarray antennas, Microw. Opt. Techn. Let., 52, 364–372, https://doi.org/10.1002/mop.24949, 2010.
Berry, D., Malech, R., and Kennedy, W.: The reflectarray antenna, IEEE T. Antenn. Propag., 13, 645–651, https://doi.org/10.1109/TAP.1963.1138112, 1963.
Dahri, M. H., Jamaluddin, M. H., Abbasi, M. I., and Kamarudin, M. R.: A Review of Wideband Reflectarray Antennas for 5G Communication Systems, IEEE Access, 5, 17803–17815, https://doi.org/10.1109/ACCESS.2017.2747844, 2017.
Hannan, P. and Balfour, M.: Simulation of a phased-array antenna in waveguide, IEEE T. Antenn. Propag., 13, 1558–2221, https://doi.org/10.1109/TAP.1965.1138428, 1965.
Huang, J. and Encinar, J. A.: Reflectarray Antennas, edited by: El-Hawary, M. E., New York, Wiley-IEEE Press, https://doi.org/10.1002/9780470178775, 2008.
Lee, W., Yi, M., So, J., and Yoon, Y. J.: Non-resonant conductor reflectarray element for linear reflection phase, Electron. Lett., 51, 669–671, https://doi.org/10.1049/el.2015.0194, 2015.
Nayeri, P., Liang, M., Sabory-García, R. A., Tuo, M., Yang, F., Gehm, M., Xin, H., and Elsherbeni, A. Z.: 3D Printed Dielectric Reflectarrays: Low-Cost High-Gain Antennas at Sub-Millimeter Waves, IEEE T. Antenn. Propag., 62, 2000–2008, https://doi.org/10.1109/TAP.2014.2303195, 2014.
Nayeri, P., Yang, F., and Elsherbeni, A. Z.: Reflectarray Antennas: Theory, Designs, and Applications, Wiley, Singapore, https://doi.org/10.1002/9781118846728, 2018.
Targonski, S. D. and Pozar, D. M.: Analysis and design of a microstrip reflectarray using patches of variable size, Proceedings of IEEE Antennas and Propagation Society International Symposium and URSI National Radio Science Meeting, 20–24 June 1994, Seattle, WA, USA, 3, 1820–1823, https://doi.org/10.1109/APS.1994.408184, 1994.
Venneri, F., Costanzo, S., Di Massa, G., Borgia, A., Corsonello, P., and Salzano, M.: Design of a reconfigurable reflectarray based on a varactor tuned element, 6th European Conference on Antennas and Propagation (EUCAP), 26–30 March 2012, Prague, Czech Republic, 2628–2631, https://doi.org/10.1109/EuCAP.2012.6206624, 2012.
Venneri, F., Costanzo, S., and Di Massa, G.: Design and Validation of a Reconfigurable Single Varactor-Tuned Reflectarray, IEEE T. Antenn. Propag., 61, 635–645, https://doi.org/10.1109/TAP.2012.2226229, 2013.
- Abstract
- Introduction
- Reflectarray element
- Waveguide simulator
- Position of the feed antenna
- Prototype of the reflectarray antenna
- Phase measurement of the reflectarray antenna
- Antenna pattern measurement
- Conclusion
- Code and data availability
- Author contributions
- Competing interests
- Disclaimer
- Special issue statement
- Financial support
- Review statement
- References