 | 21 Mar 2023
Processing of weather radar raw IQ-data towards the identification and correction of wind turbine interference – Project RIWER: Removing the Influence of Wind Park Echoes in Weather Radar Measurements
Bhavinkumar Vishnubhai Patel
Emre Colak
Aastha Vyas
Madhu Chandra
Ralf Zichner
In recent years, the fast construction, expansion and repowering of wind parks have been a major source of concern for the weather radar community and meteorological services. Among others because wind turbines are extremely tall, reflective, and moving objects, which make them a source of interference that is hard to distinguish from meteorological echoes and therefore difficult to filter and even more difficult to correct. Polarimetric C-Band Doppler weather radar measurements enable us to analyse and understand the impact of wind turbine interference on meteorological weather radar echoes and to build up knowledge. The main idea is to analyse the raw IQ-data in order to quantify the behaviour of wind turbine interference with meteorological scattering. As a first step in this direction, this paper will focus on the derivation and analysis of radar moments such as Reflectivity (Z), Differential Reflectivity (ZDR), Differential Propagation Phase (PHIDP), Mean Doppler Velocity (V), and Correlation Coefficient (RHOHV). We will consider two cases: (i) events with precipitation, and (ii) events without precipitation, in order to understand and model the impact of wind turbine interference (WTI). For this purpose, weather radar measurements from Deutscher Wetterdienst (DWD), recorded under the aegis of the project RIWER (Removing the Influence of Wind Park Echoes in Weather Radar Measurements), are presented, analysed and discussed in detail.
- Article
(7286 KB) - Full-text XML
- BibTeX
- EndNote


As a result of the rising demand for renewable energy, the number of wind turbines (WTs) is fast expanding in many countries. The total capacity of WTs has increased nearly 10-fold in the last decade, and many more WTs are projected to be installed in the coming years. Older WTs will almost certainly be replaced by larger blades and possibly taller turbines as next-generation turbines.
Modern WTs are massive structures, with several reaching heights up to 250 m. Densely spaced clusters of WTs, called wind parks (WPs), are being built both on land and off-shore (Norin and Hasse, 2012). WPs, which are made up of turbines set on tall towers, have the ability to intercept radar beams and cause spurious scattering in all directions, including backscattering and forward scattering. For any radar system, a spurious scattered signal caused by WTs is more severe than one caused by masts or towers. The main reason for this situation is the rotating blades of WTs. Backscattered signals from WPs can be directly superimposed on information-bearing weather echoes resulting from weather spreading over the WPs, thereby cluttering the backscattered weather echoes. Forward scattering from such objects, on the other hand, can cause several radar-related physical effects in measured weather radar data and images, such as, severely attenuating or completely blocking the radar beam, multi-scattering (or multi-path) echoes, and Doppler contamination due to the rotating blades of WTs (Chandra and Gekat, 2018).
Clutter refers to all unwanted non-meteorological radar echoes on a weather radar. Echoes from terrain, human-made structures, and clear-air targets are common instances of clutter (e.g. insects, birds, airplanes, drones, etc.). Clutter is further classified into two categories: static and dynamic. Dynamic clutter is caused by moving targets such as clear-air returns from the rotating blades of the WTs, whereas static clutter is caused stationary targets such as poles and nacelles of the WTs. Static clutter has a predominantly radial (Doppler) velocity of zero or near-zero and is removed by a built-in clutter filter, whereas dynamic clutter comes from targets with radial velocities greater than the clutter filter limitations. Thus, the unwanted radar returns from WT can be considered to be a mixture of the dynamic and static clutter. The tall and high reflective structure of WT can be detected by radar's main-beam as well as its side-lobes. In our research, WT detections inside the radar's main-beam line of sight were considered as a wind turbine clutter (WTC), whereas detection of the multi-path effect over the WT's region and so-called “shadowing” effect behind the WT due to radar main-beam and its side-lobes, and WT detection due to side-lobes were considered as a wind turbine interference (WTI). Because of varying WT orientations and operations, as well as atmospheric conditions, these WTC and WTI are highly variable in time and space (Seltmann and Böhme, 2017). As a result, traditional clutter filters will not be able to suppress WTC and WTI adequately (Norin and Hasse, 2012).
As a result, assessing and cancelling such WTC and WTI has become a requirement for sustaining gap-free coverage and reliable weather radar operation. The main purpose of this paper is to analyse the raw IQ-data in order to determine the behaviour of WT and its interference with and without meteorological scattering. In this context, weather radar measurements from German Meteorological Service (Deutscher Wetterdienst (DWD)), recorded under the aegis of the project RIWER (Removing the Influence of Wind Park Echoes in Weather Radar Measurements), are presented, analysed and discussed in detail.
This section describes how radar raw IQ-data (also known as radar time series data) is processed in order to obtain meteorologically significant radar “moments”, which are key results used to measure, predict, and forecast various weather scenarios in weather radar operations. Most dual-polarization Doppler weather radars, including DWD's ground-based polarimetric Doppler C-band (4–8 Ghz) weather radar system (STAR-Mode: simultaneous transmit and receive), produce radar moments of reflectivity (Z), mean Doppler velocity (V), spectrum width (SW), differential reflectivity (ZDR), correlation coefficient (RHOHV), and differential propagation phase (PHIDP). Each dual-polarization moment has distinctive properties in relation to various weather or non-weather radar echoes, and when combined with Z, they reveal the microphysical properties of clouds and precipitation (Zhang et al., 2019).
2.1 “Raw” IQ-Data Processing
The term “raw” IQ-data refers to IQ-data that has not been filtered using a clutter filter or a Doppler clutter filter. The IQ-data processing can be divided into two basic categories: time domain processing and frequency domain processing. In time domain, the complex IQ-signals samples are used to calculate autocorrelations and then the autocorrelations are used to compute the moments, whereas in frequency domain, the complex IQ-signals are first calculated to reveal Doppler power spectrum and then corresponding autocorrelations, which are then used to compute the moments. Time domain algorithms are very efficient, requiring minimal storage and computational power, but they are not as adaptive or flexible as frequency domain algorithms (SIGMET, 2006).
We should now consider the description of the original complex signal (Spq), which can be calculated by combining two simultaneous samples of I and Q from a given range-bin into a single complex value, and represented as:
where , q represents transmit polarisation state, and p represents receive polarisation state. From this complex signal (Spq), the average back scattered power (Ppq) for time series at a given range-bin can be calculated as:
where M is total number of pulses in the time average, Spq represents the original time series, and ∗ represents a complex conjugate. For meteorological radar, Ppq is proportional to the sum of the meteorological signal power (Ps), clutter power (C), and noise power (N).
2.2 Reflectivity (Z)
The amount of transmitted power received back by the radar receiver is proportional to radar reflectivity (Z), and it is affected by the following physical parameters of the object: its size (target cross-section), shape (round, flat, oblate, etc.), material composition (liquid, solid, frozen, dry, wet, mixed, etc.), and particle concentration in a sample volume (Skow, 2013).
To calculate radar reflectivity from received power, we must first consider the monostatic radar equation for a single point target, which is as follows:
where PRX [W] and PTX [W] are the received and transmitted powers, G [dBi] is the directional antenna gain, λ [m] is the wavelength, σ [m2] is the single point target radar scattering cross section, and r [m] is the target range. In the derivation of the radar equation for meteorological targets, one major assumption is that the pulse volume illuminated by the radar beam is uniformly filled with scattering targets (Melvin and Scheer, 2014), and the received power is simply the sum of the power scattered by all of the individual scattering centres in the pulse volume given as:
The backscattering cross section per unit volume, η [m2 m−3], is defined as: in the pulse volume given as:
where Vp [m3] is an illuminated pulse volume (see Fig. 1). By solving above Eq. (5) for , and substituting back into Eq. (4) gives
The η can be further approximated for the raindrops using the Rayleigh approximation, and their individual scattering cross section per unit volume can be express as follows:
where K is the dielectric factor related to the complex index of refraction, and Di [mm] is the raindrop diameter. The Vp can be approximated as:
where c [m s−1] is speed of light, τP [s] is pulse duration, θH [rad] and θV [rad] are horizontal and vertical beam widths.

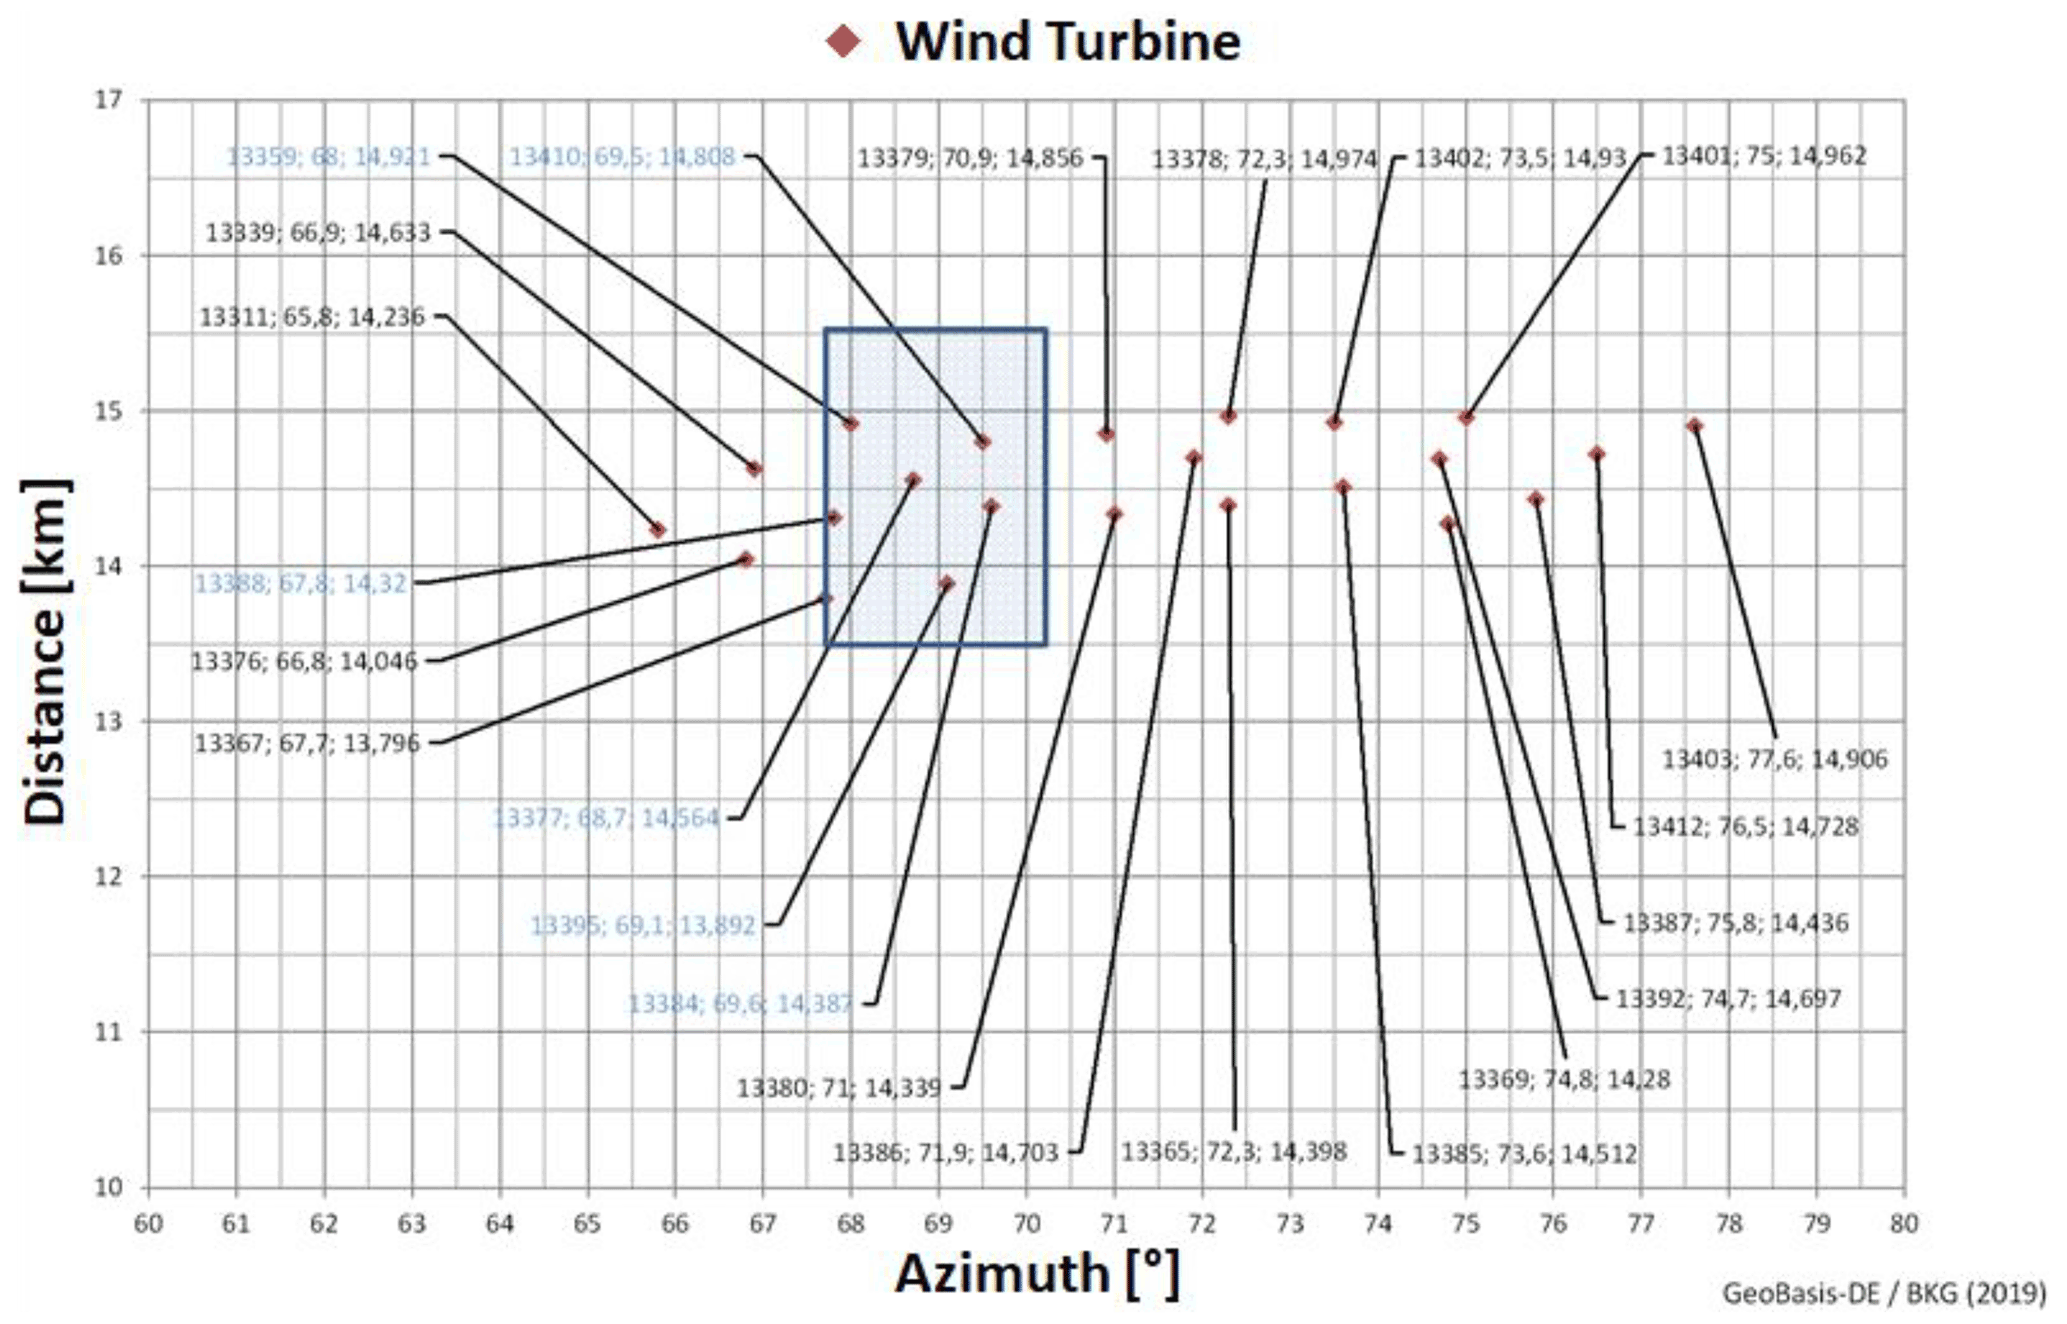
Figure 2Wind turbines in the vicinity of the DWD's radar system located at the Prötzel-site near Berlin, Germany.
By combining Eqs. (6), (7), (8), and a correction factor of 1/ (2. ln 2) was introduced by Probert-Jones to account for the actual distribution of power within the beam generated by a parabolic antenna (Probert-Jones, 1962), we can rewrite receive power equation for weather radar as follows:
In Eq. (9), can be described as equivalent radar reflectivity factor (Z) in [mm6 m−3] In this context, we can be rewrite Eq. (9) as follows:
The Z is a physical quantity, which makes weather radar measurement independent to platform. In this context, Z can be given as:
where C is a radar constant. Z should be normalized with Z0. Z0 is called the calibration reflectivity factor. It is the equivalent radar reflectivity factor at the reference range when the return signal power is equal to the noise power (i.e. SNR = 0 dB). It is sometimes called the minimum detectable dBZ or dBZ0 (decibels of Z) at references range (r0) 1 km, though it is more correct to call it the 0 dB SNR detection level. Z0 is given as mathematically as follows:
where N is the average noise power. Reflectivity is measured in dBZ (decibels of Z), where Z represents the radar reflectivity-factor. Finally, the Z in dB at a given range-bin can be calculated as:
where PRX is received average back scattered power, 20log 10(r) is range normalization expressed in dB-form, α [dB km−1] is a two-way atmospheric path attenuation (the default value for a C-band system is 0.016 dB km−1), and r [km] is target distance from the radar.
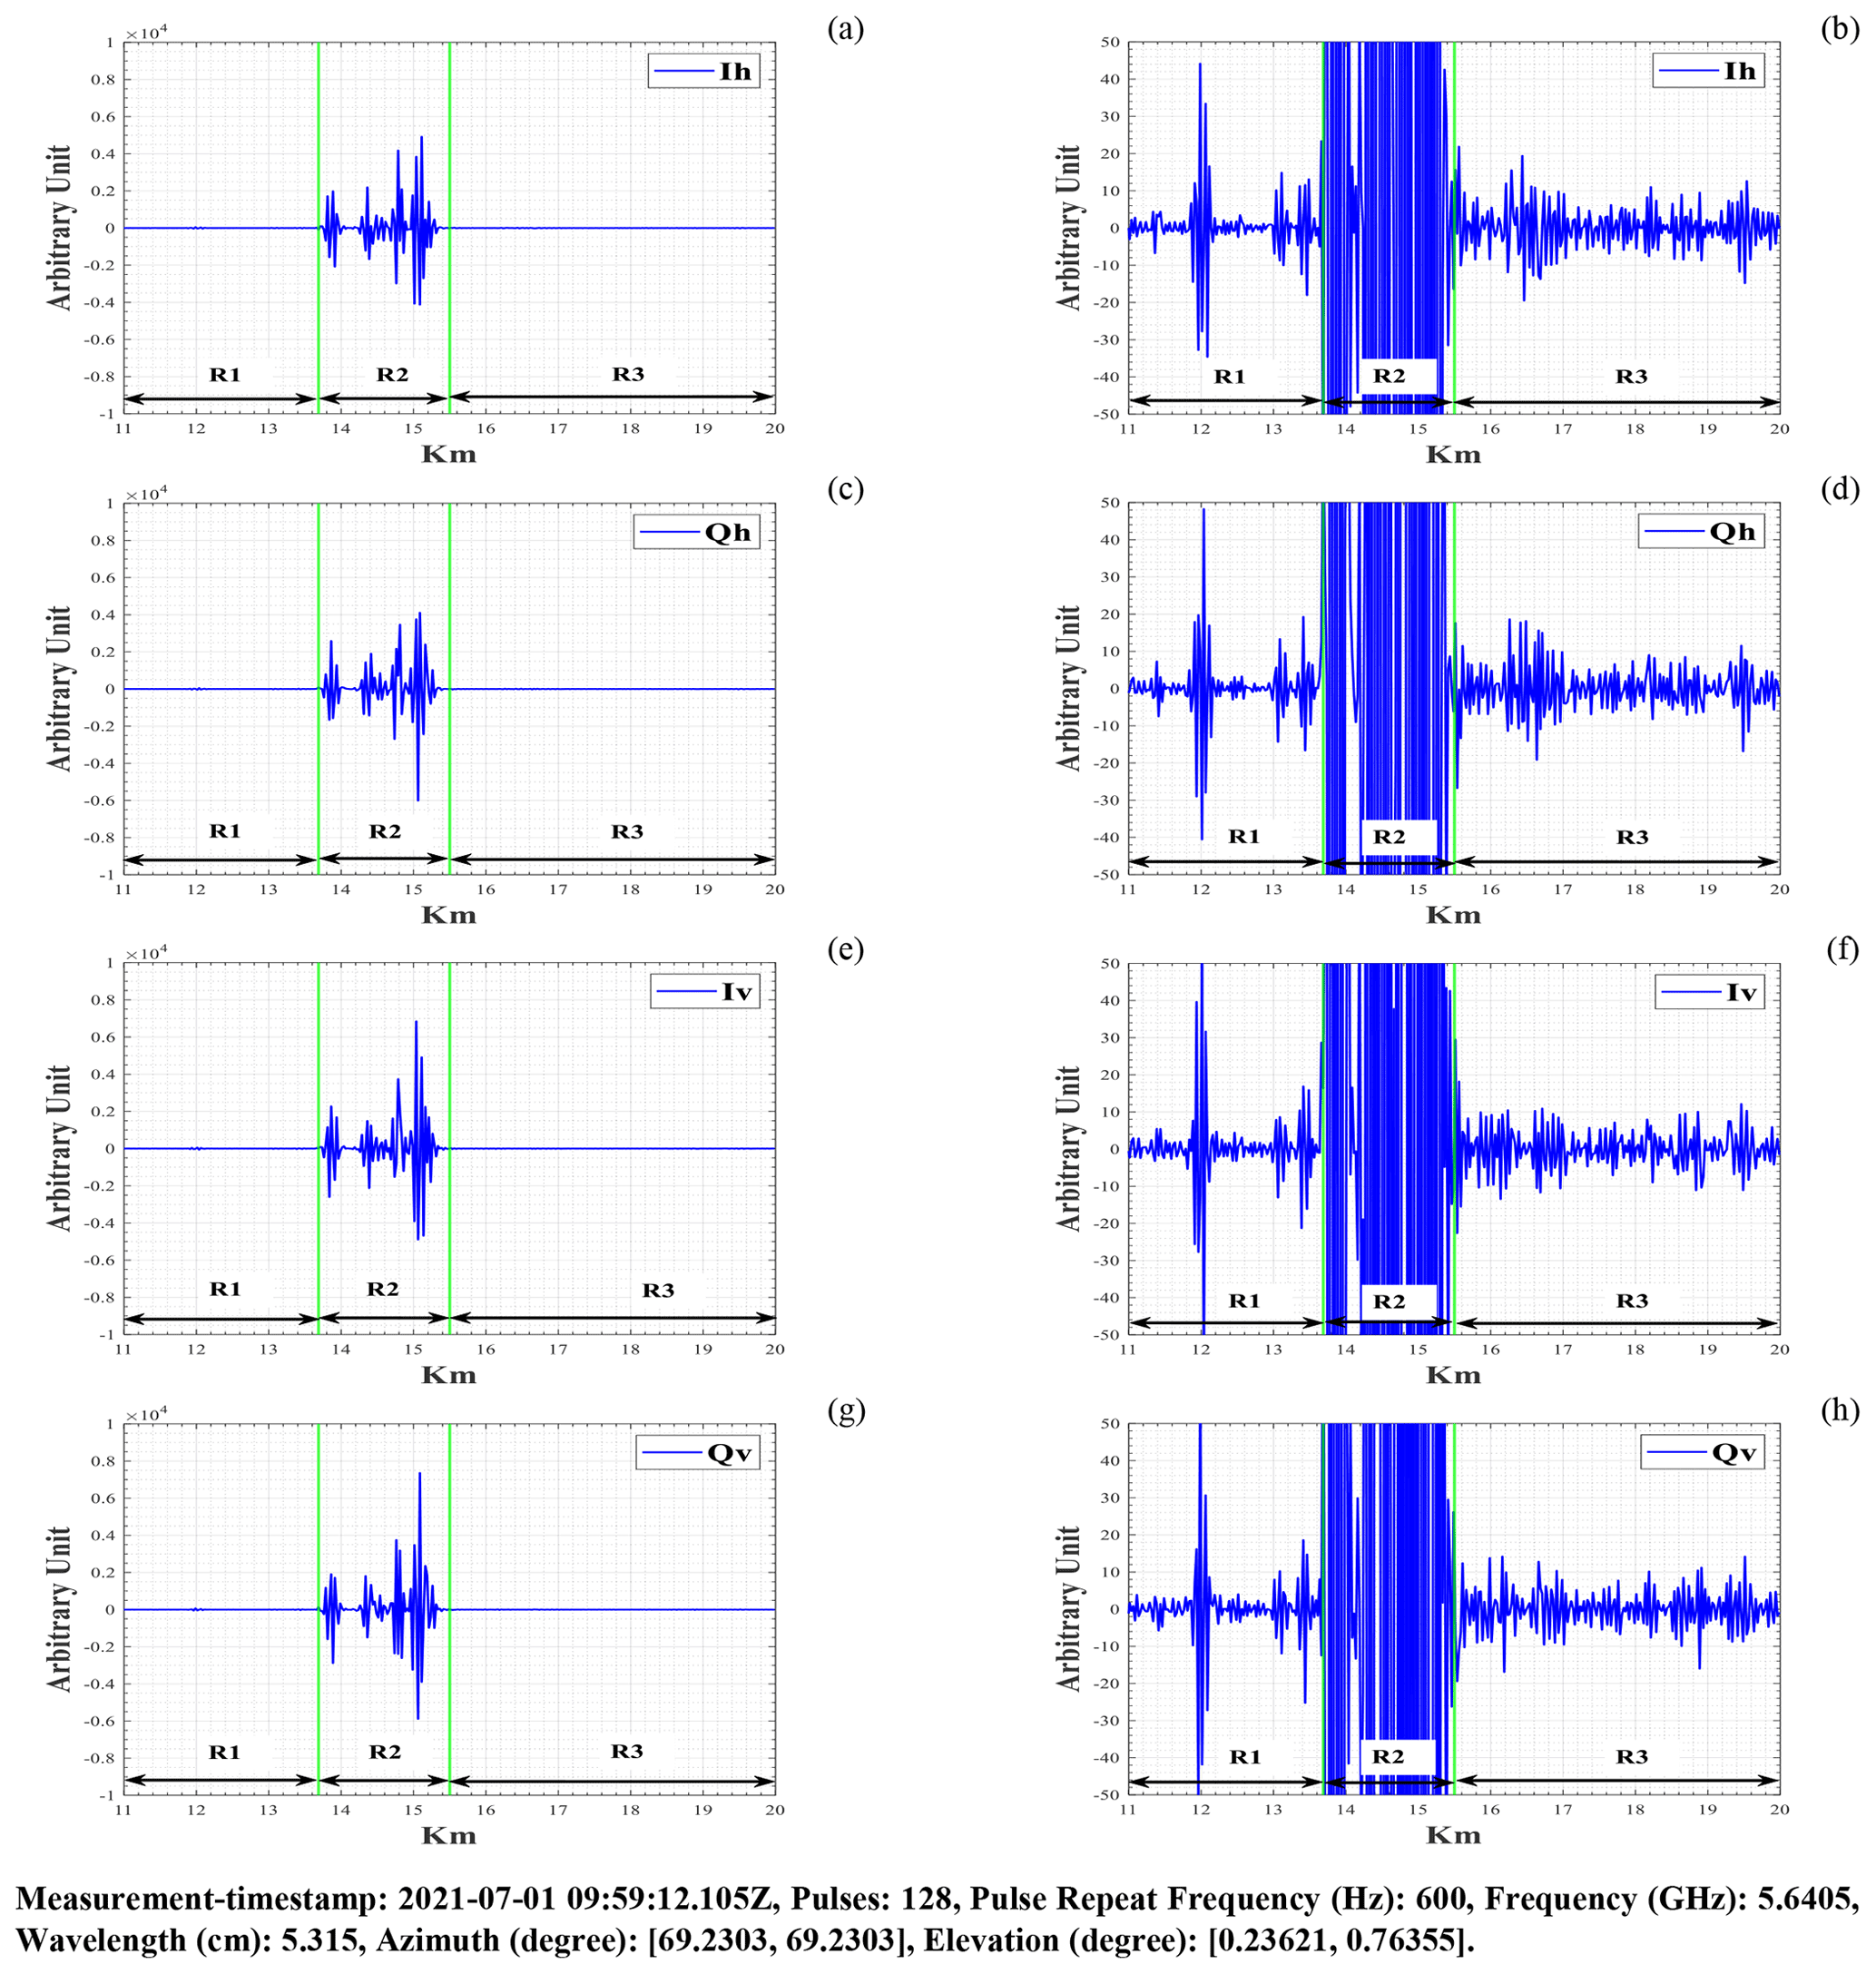
Figure 3RHI scan in the direction of the windpark area (between green bars) during the pricipitation events (rain): (a) H-pol. mean I-signal (Ih); (b) H-pol. mean I-signal (Ih) in the range of [−50, 50] arbitrary unit; (c) H-pol. mean Q-signal (Qh); (d) H-pol. mean Q-signal (Qh) in the range of [−50, 50] arbitrary unit; (e) V-pol. mean I-signal (Iv); (f) V-pol. mean I-signal (Iv) in the range of [−50, 50] arbitrary unit; (g) V-pol. mean Q-signal (Qv); (h) V-pol. mean Q-signal (Qv) in the range of [−50, 50] arbitrary unit.
2.3 Differential Reflectivity (ZDR)
Differential reflectivity (ZDR) is an important factor in determining the size of the target. It is a reflectivity weighted shape of the scatterers that tends to increase with more oblate targets (rain-drops) within the Rayleigh scattering regime. ZDR in dB is a measure of the difference between the horizontal and vertical reflectivities-factors, and can be calculated at a given range-bin as:
Typically, small ZDR values represent particles such as drizzle and small hailstones that are uniformly shaped. ZDR values greater than zero are characteristic of rain and melting hail. ZDR values less than zero are not always seen but can be seen sometimes in areas of vertically oriented ice crystals inside thunderstorms.
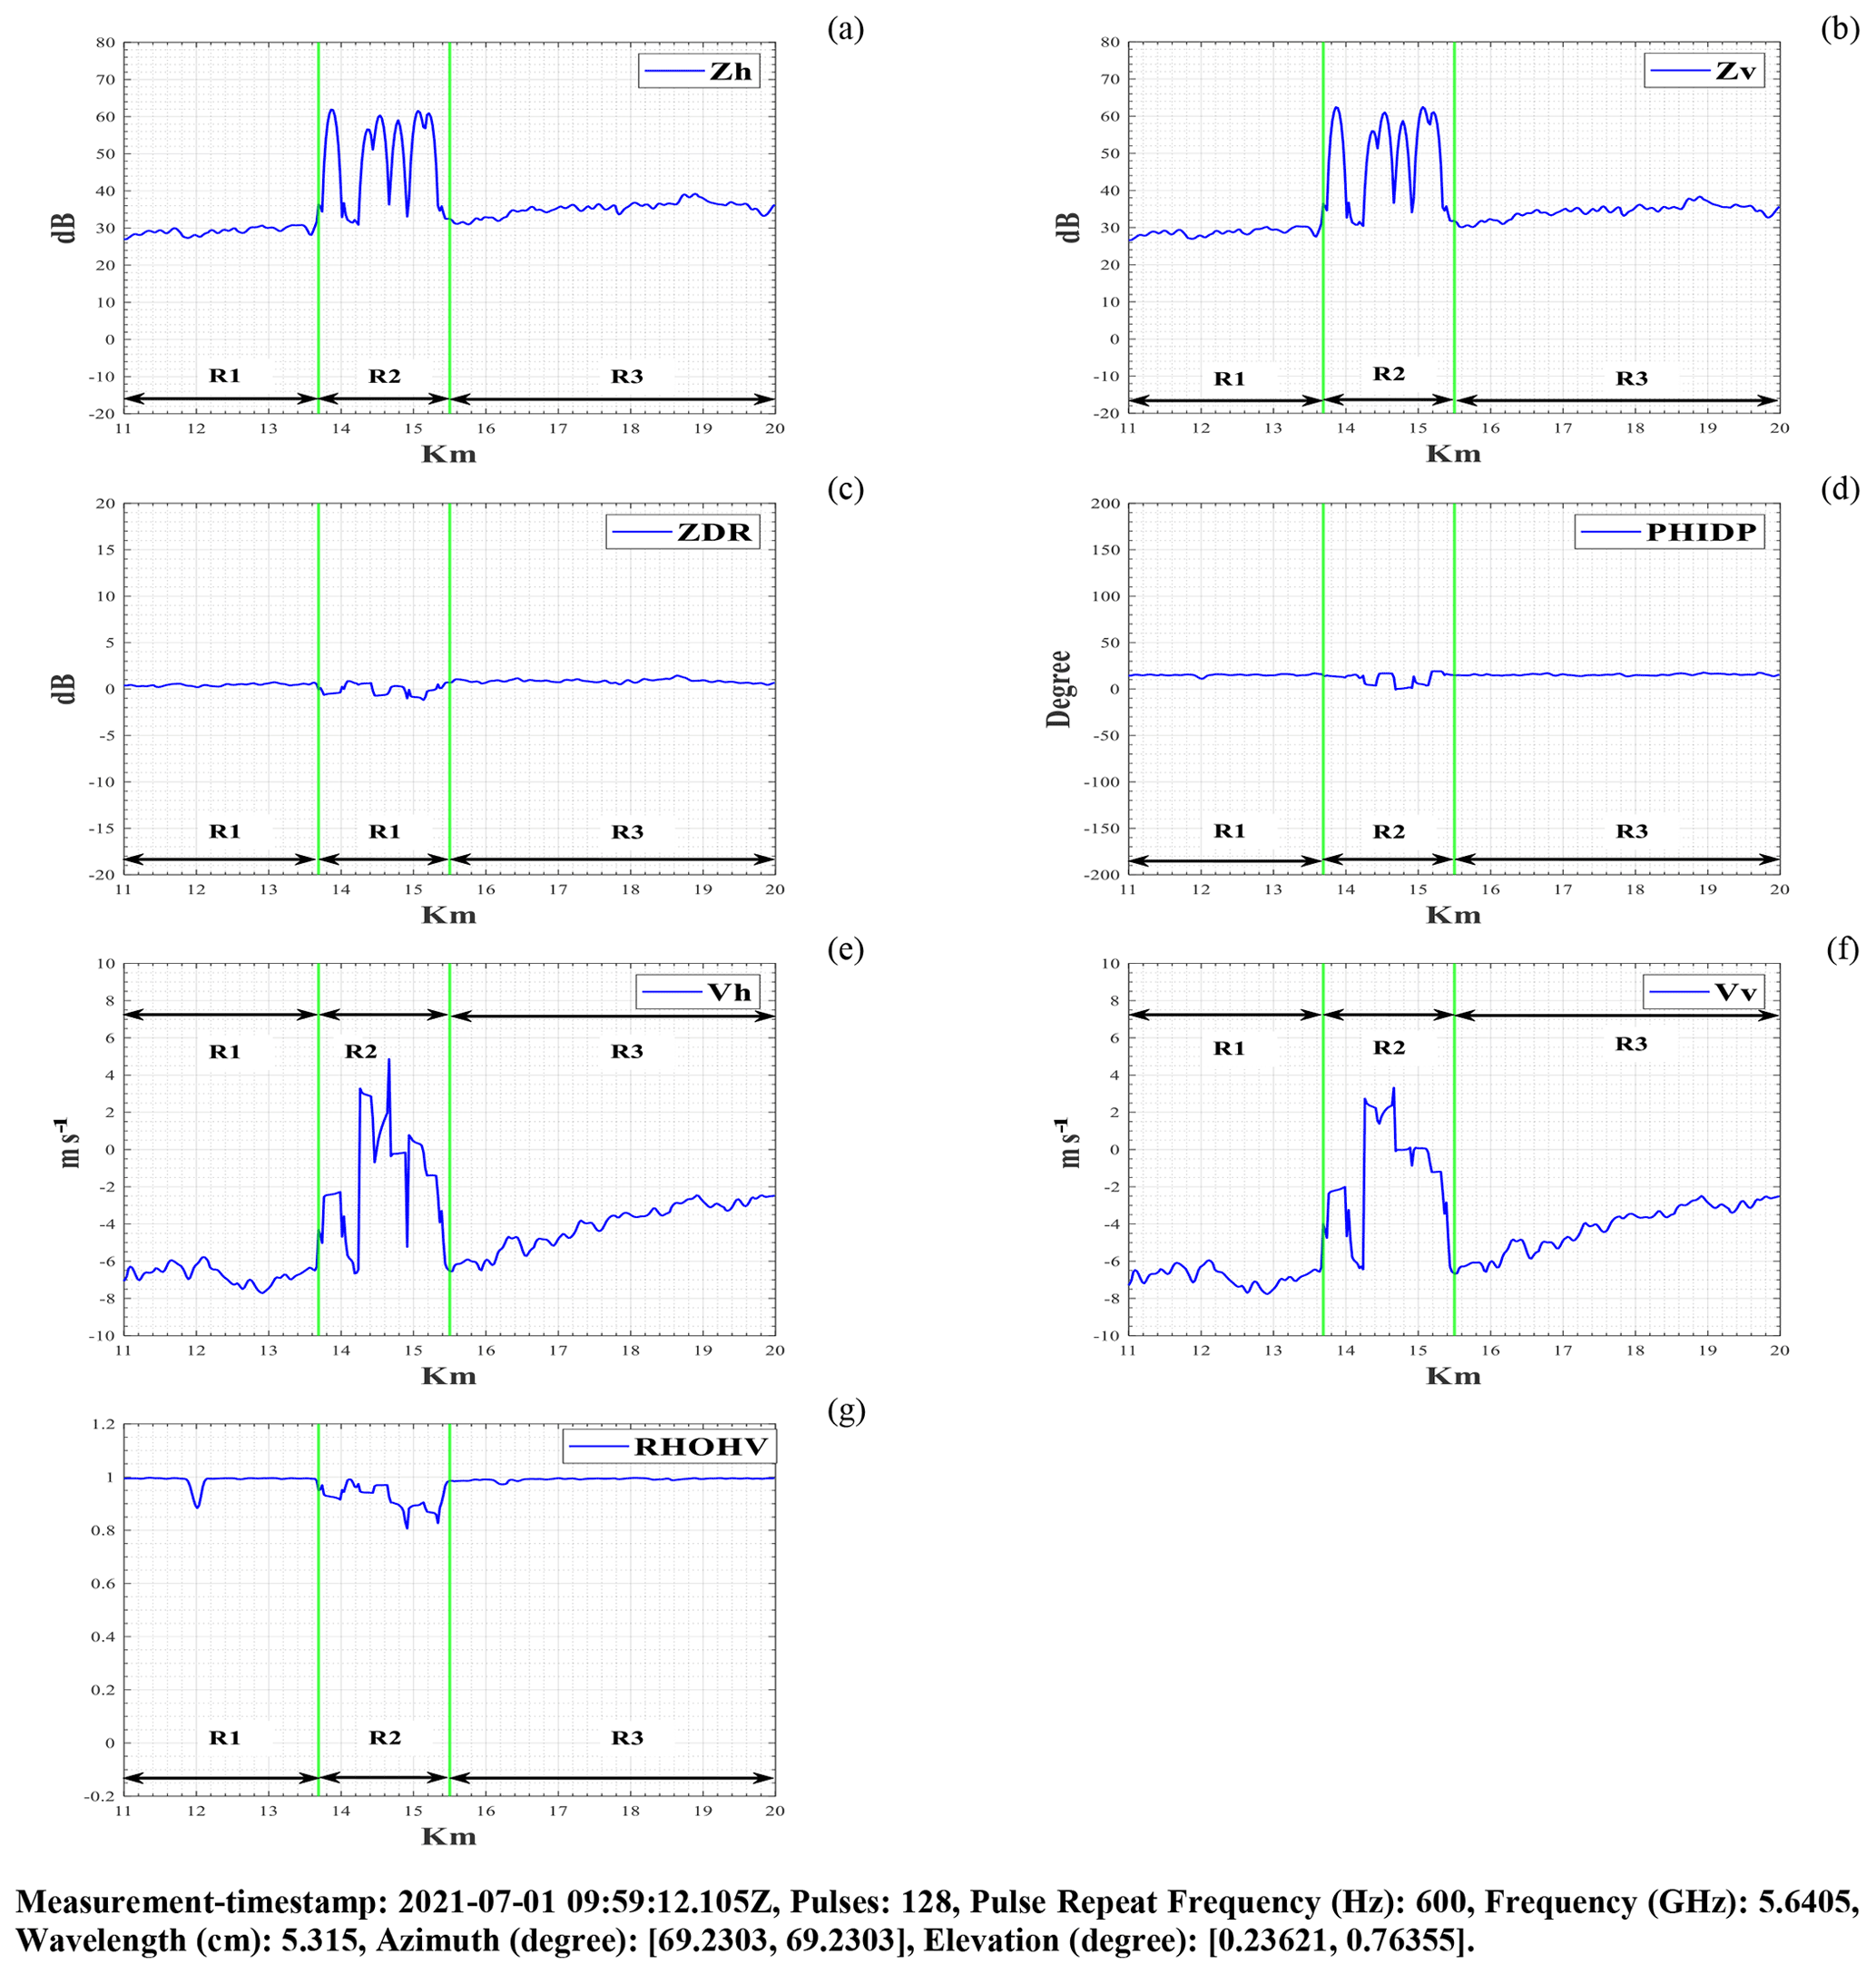
Figure 4RHI scan in the direction of the windpark area (between green bars) during the pricipitation events (rain): (a) H-pol. mean reflectivity signal (Zh); (b) V-pol. mean reflectivity signal (Zv); (c) Mean differential reflectivity signal (ZDR); (d) Mean differential propagation phase signal (PHIDP); (e) H-pol. mean Doppler velocity signal (Vh); (f) V-pol. mean Doppler velocity signal (Vv); (g) Mean correlation coefficient signal (RHOHV).
2.4 Differential Propagation Phase (PHIDP)
Differential propagation phase (PHIDP) is a measure of the phase difference between horizontally and vertically polarized pulses at a given range-bin, and can be calculated in “degrees” as:
PHIDP increases rapidly for heavy rain because horizontally polarized pulses propagate slower than vertically polarized pulses, the horizontal phase appears to lag behind the vertical phase at least in C-band, resulting in positive PHIDP. Horizontally oriented particles contribute positive PHIDP values, whereas vertically oriented particles result in negative values. Non-meteorological targets tend to have complex and noisy PHIDP values.
2.5 Mean Doppler Velocity (V)
Pulse pair processing (PPP) is common Doppler processing in meteorological radar. The mean Doppler velocity (V) is obtained directly from the autocorrelation argument at the first lag at a given range bin, and can be calculated in [m s−1] as:
where λ is the radar wavelength [m], TS is the sampling time [s] (1/pulse repeat frequency(PRF)). The argument of the autocorrelation at a first-lag is restricted to the interval [−π, π]. If the absolute value of the measured true velocity of the scatterers is greater than , then the measured true velocity is aliased into the interval [, ], which is known as the Nyquist interval.
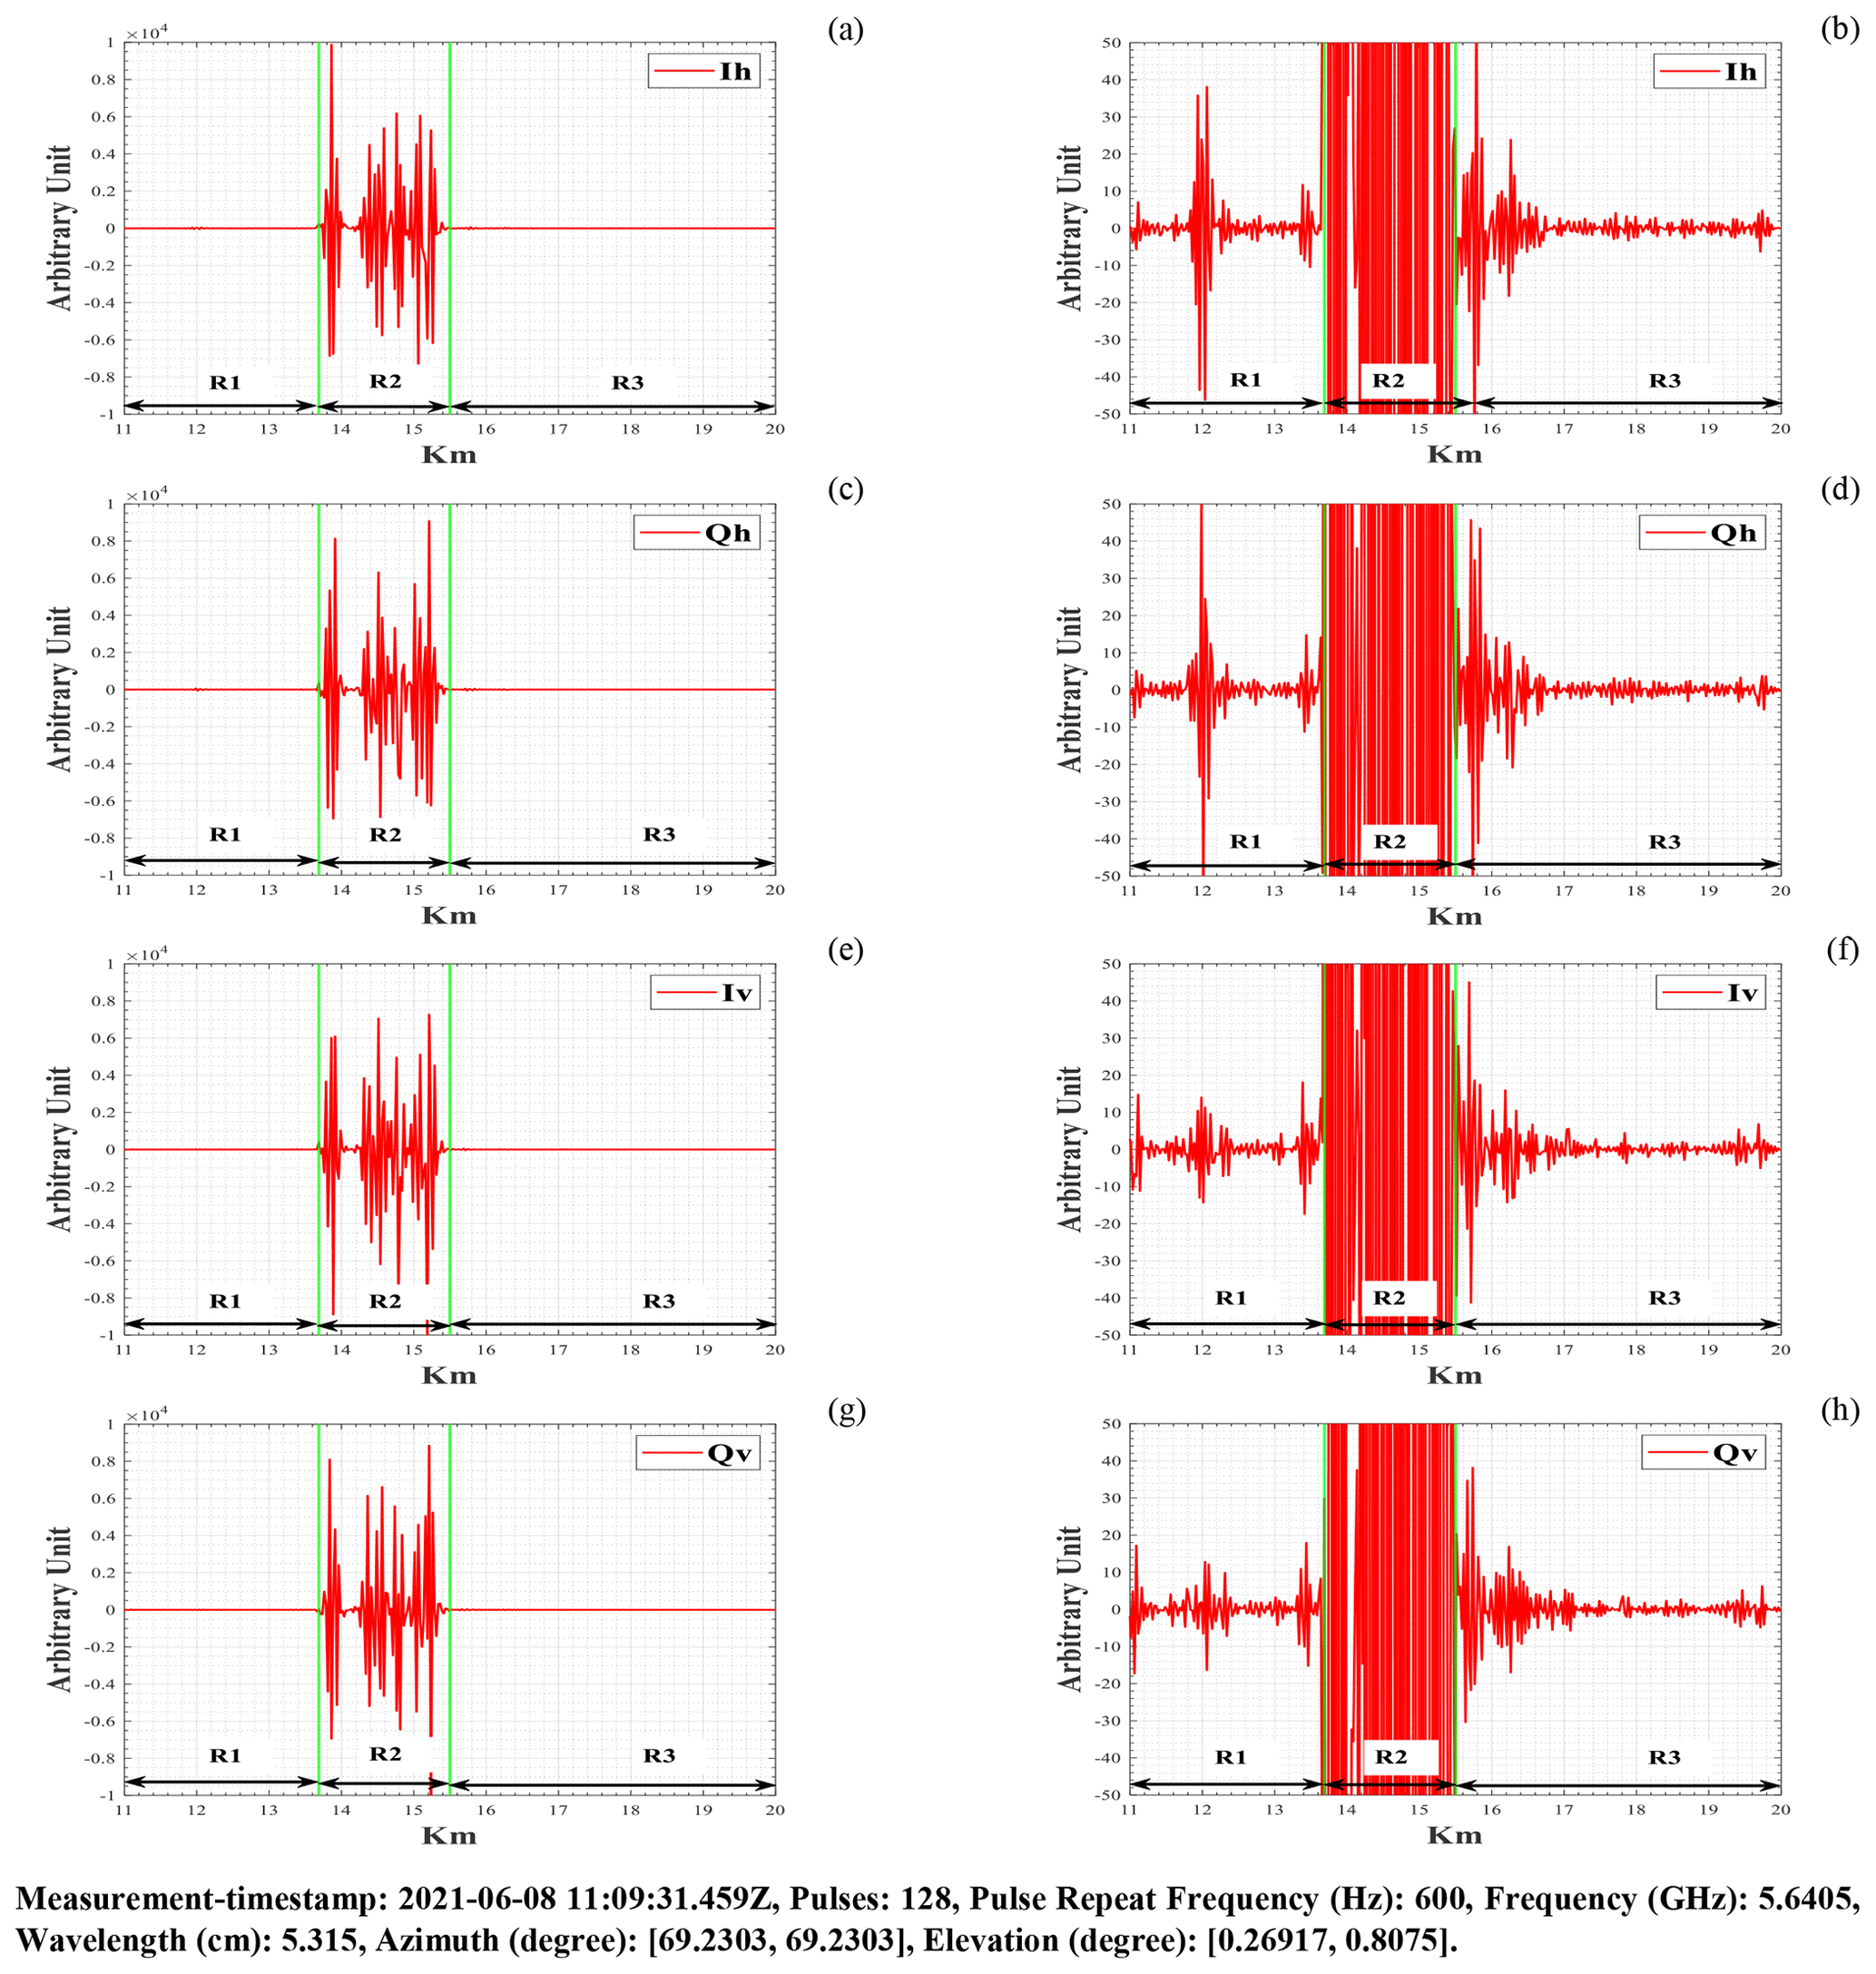
Figure 5RHI scan in the direction of the windpark area (between green bars) during without the pricipitation events (clear-air): (a) H-pol. mean I-signal (Ih); (b) H-pol. mean I-signal (Ih) in the range of [−50, 50] arbitrary unit; (c) H-pol. mean Q-signal (Qh); (d) H-pol. mean Q-signal (Qh) in the range of [−50, 50] arbitrary unit; (e) V-pol. mean I-signal (Iv); (f) V-pol. mean I-signal (Iv) in the range of [−50, 50] arbitrary unit; (g) V-pol. mean Q-signal (Qv); (h) V-pol. mean Q-signal (Qv) in the range of [−50, 50] arbitrary unit.
2.6 Correlation Coefficient (RHOHV)
Correlation coefficient (RHOHV) is a measure of the similarity between horizontally and vertically polarized backscattered pulses, and can be calculated as:
RHOHV is a dimensionless quantity that ranges between 0 to 1, and extremely beneficial for distinguishing or identifying meteorological and non-meteorological targets. High-RHOHV (more than 0.97) denotes areas of consistent rain or snow. A low-RHOHV (less than 0.8) is often caused by scattering from non-meteorological targets such as birds, insects, and man-made structures. A moderate-RHOHV (between 0.8 and 0.97) might reflect a variety of precipitation types, sizes, or states (Melvin and Scheer, 2014).
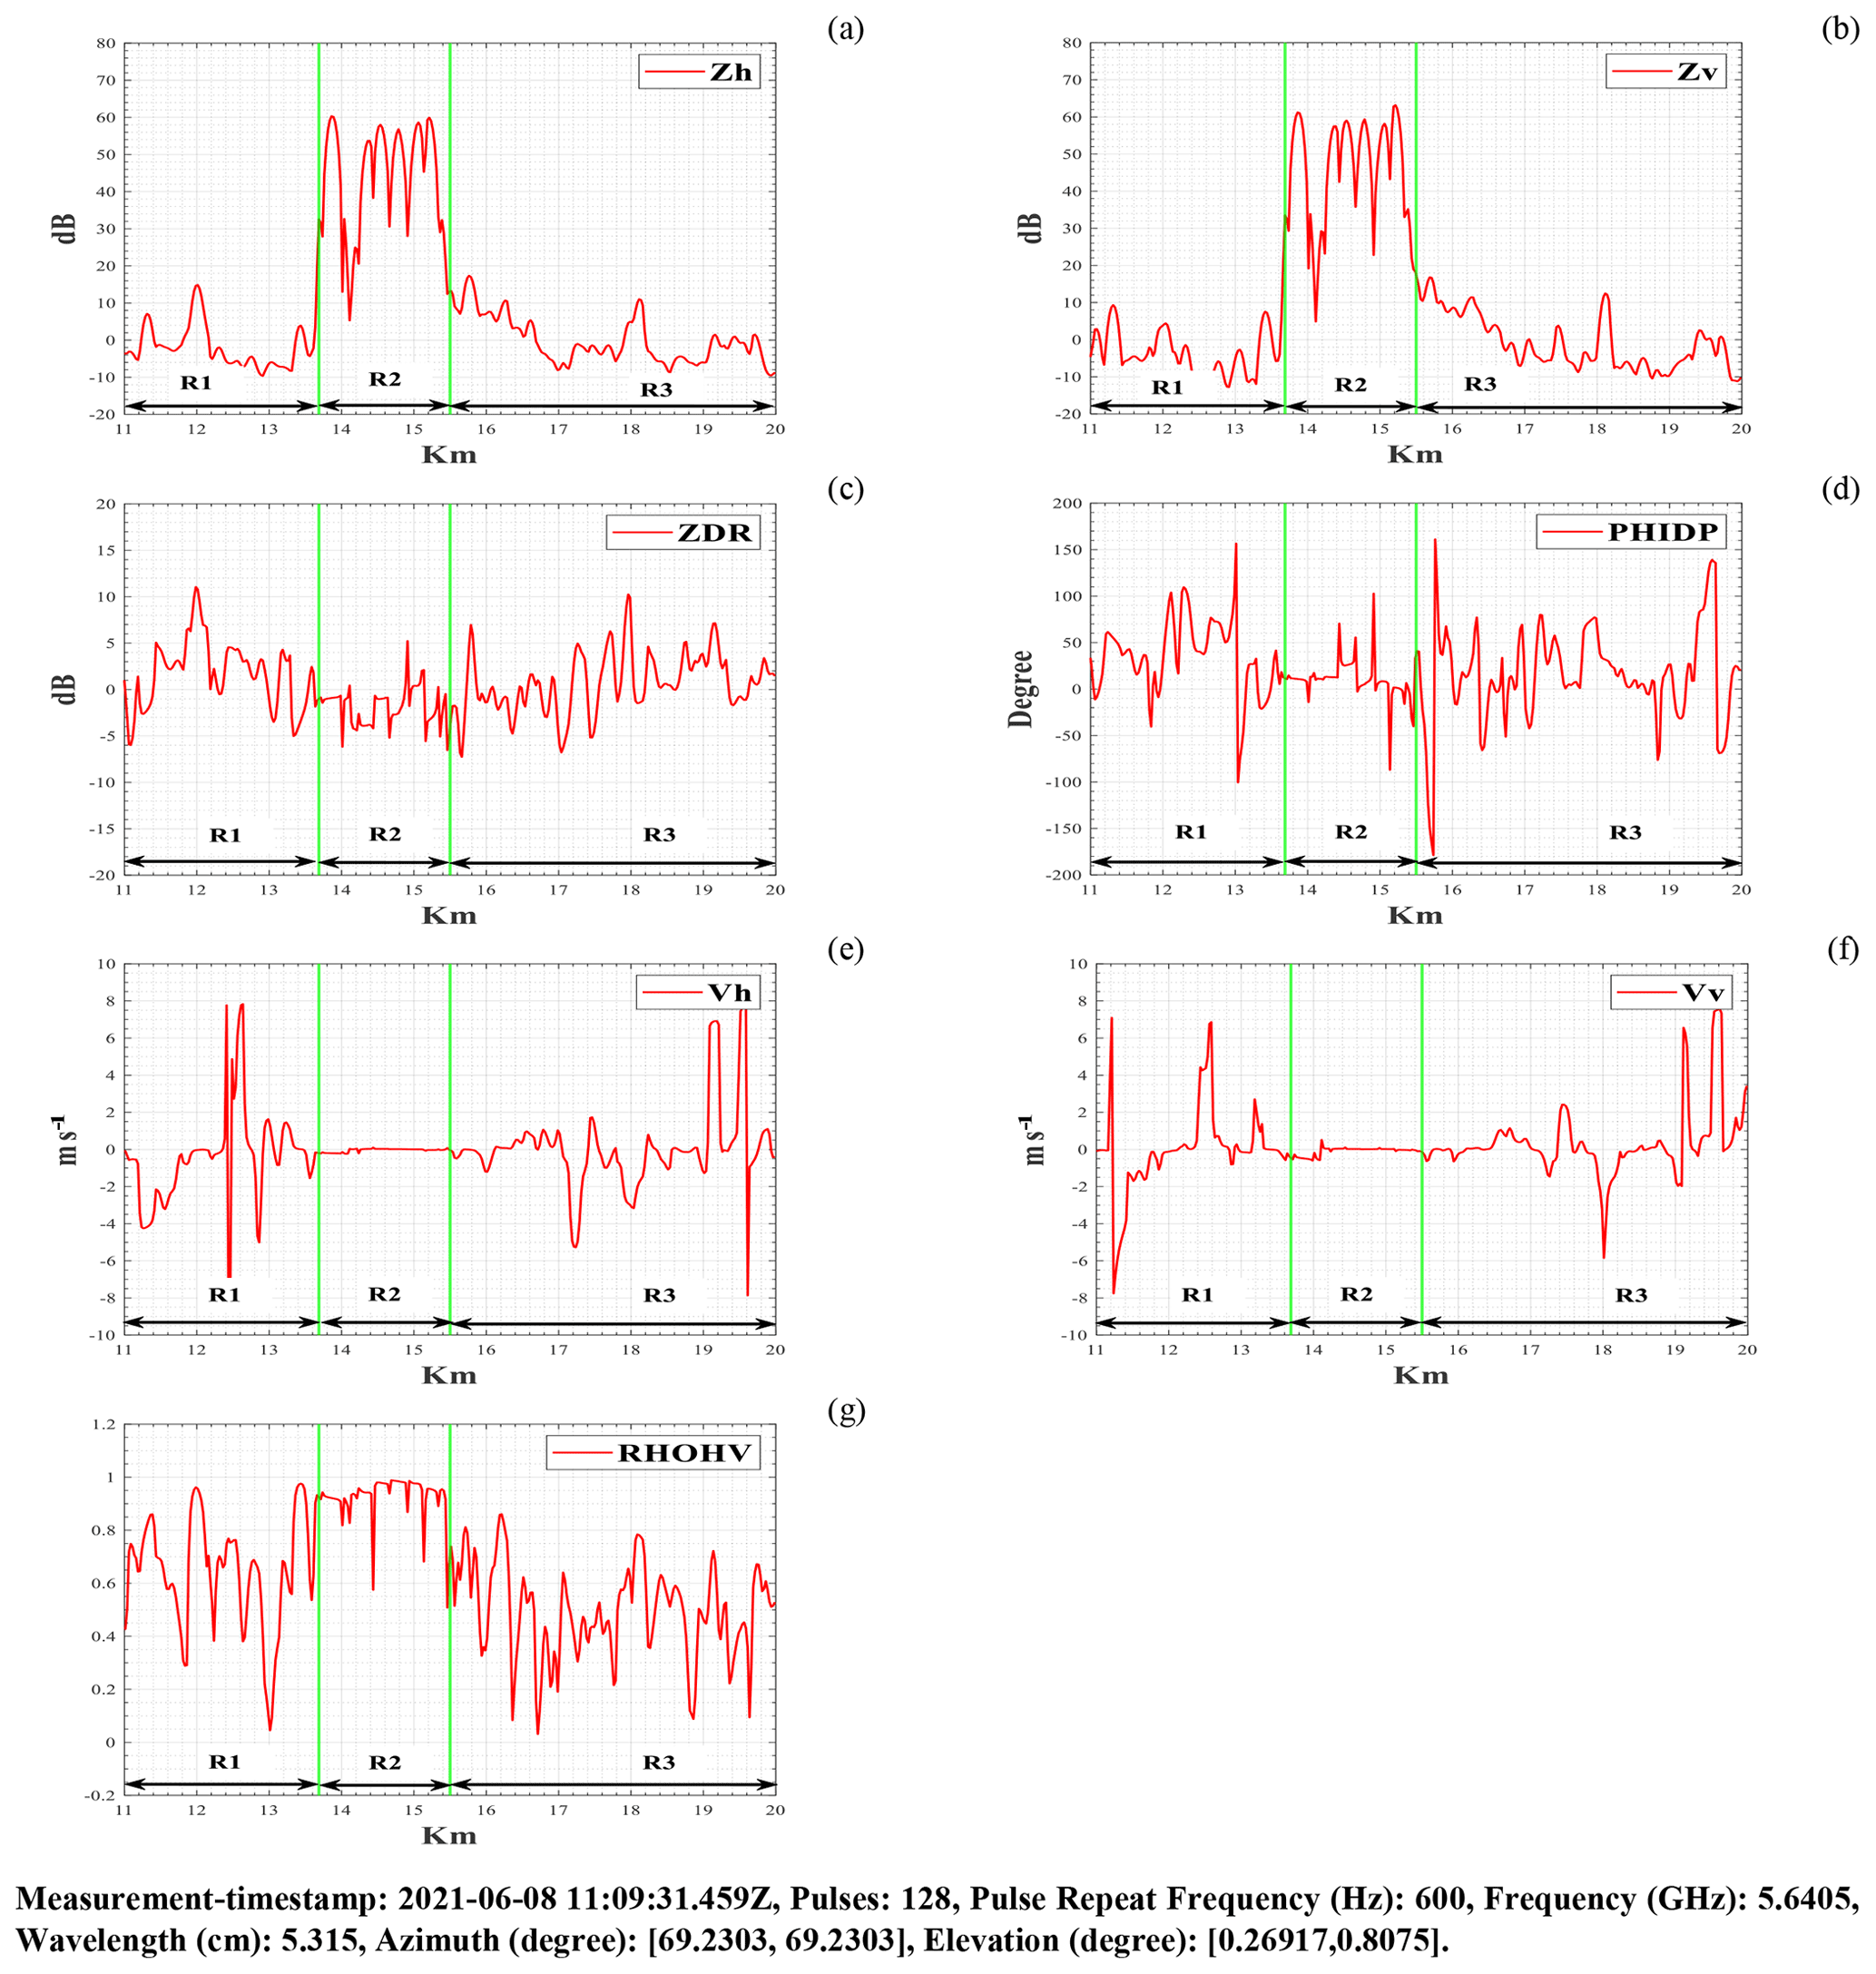
Figure 6RHI scan in the direction of the windpark area (between green bars) during without the pricipitation events (clear-air): (a) H-pol. mean reflectivity signal (Zh); (b) V-pol. mean reflectivity signal (Zv); (c) Mean differential reflectivity signal (ZDR); (d) Mean differential propagation phase signal (PHIDP); (e) H-pol. mean Doppler velocity signal (Vh); (f) V-pol. mean Doppler velocity signal (Vv); (g) Mean correlation coefficient signal (RHOHV).
The raw IQ-data was recorded with DWD's ground base polarimetric Doppler C-band (5.64 GHz) radar system (STAR-Mode) located at the Prötzel-site near Berlin, Germany. RHI (Range Height Indicator) scans were recorded at a fixed azimuth angle of 69.23∘, with lower elevation angles almost to ground level, in order to understand and model the impact of WTC and WTI for both the cases: (i) events with precipitation, and (ii) events without precipitation. The presence of WTC and WTI in the amplitude and phase of raw IQ-data results in inaccurate or contaminated weather scenario interpretation and, in some cases, unusable for prediction and forecast at all.
Figure 2 shows a distance vs. azimuth plot of WTs in the vicinity of the radar system, where the x axis represents the azimuth angle at which the radar beam is pointing and the y axis represents the WT's distance from the radar system. Each WT is represented as a point on the plot with three coordinates: the first is the WT identification number, the second is the azimuth in degrees, and the third is the distance in kilometers. WTs captured in radar measurements between 13.68 and 15.5 km at an azimuth angle of 69.23∘ are indicated by the blue-coloured rectangle box, and the interference effects caused by them are dominant in the recorded measurements using C-band radar system. As WTs are extremely tall, reflective, and moving objects, which make them a source of interference in weather radar measurement, and this interference observed mainly due to the multi-path and multi-trip echoes from the WTs. For detailed analysis of WTC and WTI in weather radar measurement, we have divided radar range measurement into three regions of interest: (i) before-WP (from 13 to 13.68 km) is represented as region-1 (R1); (ii) within-WP (from 13.68 to 15.5 km) is represented as region-2 (R2); and (iii) after-WP (beyond 15.5 km) is represented as region-3 (R3), also known as the shadowing region. Here, WTs were detected as ground clutter in region R2, indicating that region R2 was influenced by both WTC and WTI, whereas we only noticed WTI in regions R1 and R3.
3.1 Events with precipitation
Figures 3 and 4 show the resulting plots of raw IQ-signals and radar moments for both horizontal (h) and vertical (v) polarization channels, recorded during events with precipitation (rain) in the direction of the WP (between green bars), with an RHI scan at a fixed azimuth angle of 69.23∘ and lower elevation angles ranging from 0.23 to 0.76∘.
Figure 3 shows backscattering from the WTs (left) and WTI (right) using raw I and Q-signals plots. Backscattering from the WTs (between green bars) was significantly higher than backscattering from meteorological objects (here, rain-drops), as seen in Fig. 3 (left). Except for ground clutter at 12 km, the intensity levels of the I and Q signals between 11 and 13 km were observed to be low in comparison to the WTI regions beyond 13 km in Fig. 3 (right).
Figure 4 shows radar moments plot during events with precipitation (rain). WTs and WTI had a direct impact on all of the moments in region R2 (between green bars). The main finding was that WTI caused a slow upward trend in moments Zh, Zv, ZDR, Vh, and Vv in regions R1 and R2. At DWD, the reflectivity threshold values for thunderstorm and hail are 46 and 55 dBZ, respectively (Seltmann and Böhme, 2017). Zh and Zv values in region R2 were observed higher than 55 dBZ, resulting in a false hail detection on the weather radar display. WTs are massive tall structure with relatively higher vertically polarized reflectivity (Zv) than horizontally polarized reflectivity (Zh), resulting in negative ZDR values where the WTs were located in region R2. Due to the rotating blades of the WTs, the radial velocities Vh and Vv were measured higher for both channels in region R2 than the actual wind velocity of −8 to −6 m s−1. During precipitation events, WTI had almost no impact on PHIDP measurement except for region R2. A RHOHV was observed between 0.8 to 0.99 in region R2. WTI had almost no impact on the RHOHV in region R1, but in the shadowing region RHOHV was noticeable impacted up to 17 km and thereafter minor vibration observed throughout the 20 km range.
3.2 Events without precipitation
Figures 5 and 6 show the resulting plots of raw IQ-signals and radar moments for both horizontal (h) and vertical (v) polarization channels, recorded during events without precipitation (clear-air) in the direction of the WP (between green bars), with an RHI scan at a fixed azimuth angle of 69.23∘ and lower elevation angles ranging from 0.26 to 0.80∘. As no meteorological targets were present during the measurement, the recorded raw IQ-data only contains ground clutters and their interferences.
Figure 5 shows backscattering from the WTs (left) and WTI (right) using raw I and Q-signals plots. Backscattering from the WTs in Fig. 5 (left) was observed to be notably higher in comparison to the events with precipitation in Fig. 3 (left). Figure 5 (right) shows a similar WTI regions as stated in Sect. 3 with the exception of ground clutters around ranges of 11 and 12 km. The intensity levels of the I and Q signals were observed to be considerably reduced within the close shadowing range of 15.5 to 17 km.
Figure 6 shows radar moments plot during events without precipitation (clear-air). WTs and WTI had a direct impact on all of the moments in the region R2 (between green bars). Very similar reflectivities values greater than 55 dBZ were measured for both channels in comparison to those measured with precipitation events (Fig. 4), exceeding threshold values for thunderstorm and hail, despite the fact that there were no precipitation events during the measurement. Here, Positive reflectivity values were observed in regions R1 and R3 due to WTI, resulting in light rain on the radar display. Both ZDR and PHIDP between 13 and 17 km oscillated between a wide range of positive and negative values due to WTs and WTI, resulting in noisy measurements and no weather scenario prediction in weather radar operations. The real wind speed during the measurement was near 0 m s−1, and the observed same wind speed in region R2 was due to the fact that there were no rotating blades. In the regions R1 and R2, the observed velocities trend from negative to positive with a centered around 0 m s−1 for both channels, indicating a non-realistic detection of a tornado or mesocyclone on the radar display. A RHOHV was observed between 0.57 to 0.98 in region R2 and was noticeably impacted in region R1 and up to 17 km in shadowing region R3 due to WTI.
We investigated the impact of WTs and WTI on operational weather radar raw IQ-data and subsequent radar moments, such as Reflectivity (Z), Differential Reflectivity (ZDR), Differential Propagation Phase (PHIDP), Mean Doppler Velocity (V) and Correlation Coefficient (RHOHV), for both events with and without precipitation in this contribution under the scope of the RIWER project. WTC and WTI received in raw IQ-data amplitude have an impact on radar moments such as Reflectivity (Z), Differential Reflectivity (ZDR), whereas WTC and WTI received in raw IQ-data phase have an impact on Differential Propagation Phase (PHIDP), Mean Doppler Velocity (V). We hypothesized that WTI regions are predominantly influenced by WTs height and orientation within the WP, namely whether they are aligned in the direction of the radar beam or transverse to it. In our experiments, we found severe WTI regions about 0.7 km before and 2.5 km after the windpark, as well as a wide spread shadowing region during the precipitation events.
Further research studies towards the identification and correction of WTI are desirable and important, as many questions remain unanswered: What is the minimum and maximum degree of WTI recorded in each radar moment or product for all possible weather scenarios? What is the maximum range and cross-range affected by WTI in weather radar operation? Further discussion on these questions are highly encouraged or welcomed.
The research data or measurements used in this research study were recorded by Deutscher Wetterdienst (DWD), and it is the sole property of the DWD, which cannot be made available to anyone outside the project RIWER.
This research study was supervised jointly by MC and RZ. All authors contributed equally to the methodology, formal analysis, and data visualization for this study. BVP and EC wrote and collaborated on Sects. 1 and 2. BVP wrote Sects. 3, and 4, and generated the results (Figs. 3, 4, 5, and 6). BVP prepared the manuscript.
At least one of the (co-)authors is a member of the editorial board of Advances in Radio Science. The peer-review process was guided by an independent editor, and the authors also have no other competing interests to declare.
Publisher's note: Copernicus Publications remains neutral with regard to jurisdictional claims in published maps and institutional affiliations.
This article is part of the special issue “Kleinheubacher Berichte 2021”.
All partners and members of the project RIWER are gratefully acknowledged for their efforts and the pleasant collaboration.
This research has been supported by the BMWK (Bundesministerium für Wirtschaft und Klimaschutz) (grant no. 03EE3004B).
This paper was edited by Romanus Dyczij-Edlinger and reviewed by Heyno Garbe and one anonymous referee.
Chandra, M. and Gekat, F.: Interference in weather radars caused by windparks: Scattering model for weather radar signal processing, in: 12th European Conference on Antennas and Propagation (EuCAP 2018) (1–4), IET, https://doi.org/10.1049/cp.2018.0909, 2018.
Melvin, W. L. and Scheer, J. (Eds.): Principles of modern radar: radar applications, SciTech Publishing, USA, 2014.
Norin, L. and Haase, G.: Doppler weather radars and wind turbines, 1–23, INTECH Open Access Publisher, https://doi.org/10.5772/39029, 2012.
Probert-Jones, J. R.: The radar equation in meteorology, Q. J. Roy. Meteorol. Soc., 88, 485–495, https://doi.org/10.1002/qj.49708837810, 1962.
Seltmann, J. E. E. and Böhme, T.: Wind turbine issues in Germany, in: 38th AMS Radar Conf., 2017.
SIGMET: RVP8 User's Manual 2006, Ch-5 Processing Algorithms, http://www.aoml.noaa.gov/ftp/pub/hrd/dodge/radar_manuals.d/RVP8_User_Manual/5algor.pdf (last access: 14 January 2022), 2006.
Skow, K.: NWS WSR-88D Radar Fundamentals Meteorology 432 Instrumentation and Measurements, https://meteor.geol.iastate.edu/classes/mt432/lectures/ISURadarTalk_NWS_2013.pdf (last access: 18 January 2022), 2013.
Zhang, G., Mahale, V. N., Putnam, B. J., Qi, Y., Cao, Q., Byrd, A. D., and Jung, Y.: Current status and future challenges of weather radar polarimetry: Bridging the gap between radar meteorology/hydrology/engineering and numerical weather prediction, Adv. Atmos. Sci., 36, 571–588, https://doi.org/10.1007/s00376-019-8172-4, 2019.