 | 21 Mar 2023
Case study of radio emission beam associated to very low frequency signal recorded onboard CSES satellite
Mohammed Y. Boudjada
Hans U. Eichelberger
Emad Al-Haddad
Werner Magnes
Patrick H. M. Galopeau
Xuemin Zhang
Andreas Pollinger
Helmut Lammer
We report on the variation of electric power density linked to very low frequency (VLF) signal observed during the minimum of solar cycle 25. The detected VLF signal is emitted by the NWC radio station localized in the southern hemisphere, at 21.5∘ S and 114.2∘ E. We attempt in this work to quantify the beam as detected by the Electric Field Detector (EFD) instrument onboard CSES satellite. Geometrical key parameters have been considered to analysis the variation of the power density taking into consideration the distance between the satellite trajectory and the NWC station and its conjugate region. The beam behavior is found to be subject to significant disturbances in the conjugate region with the presence of signal modulations. Above the NWC transmitter station, the beam can be considered as a hollow cone but with irregularity dependence on the electric power density.
- Article
(1868 KB) - Full-text XML
- BibTeX
- EndNote


The ionosphere and ground create an outstanding waveguide for the signal propagation with low attenuation in the interval 3–30 kHz. Hence, radio waves emitted in this frequency range can be detected very far from the emission sources over long-distance 5000–20 000 km (Davies, 1965). Hence, the naval communication organizations keep an amount of powerful transmitters with the aim to converse with their submarines. Whistlers produced by lightning and man-made VLF transmitters are considered as the main sources of signals at these frequencies. The lightning whistler emissions are generated by strokes that create brief pulse of electromagnetic waves where a substantial part is in the VLF range. The second emission source is signal emitted by ground-based station in VLF frequency range. Such whistler emissions can be separated in two propagation modes, a ducted one that is confined approximately along the Earth's magnetic field (Helliwell, 1965) and unducted mode that is controlled by magnetic field and gradients of electron density (Hayakawa and Tanaka, 1978). It is important to note that both sources are considered as triggered-emission sources, or stimulated emissions, because they are caused by wave-particle interaction process (Davies, 2008). Additionally, whistler mode waves are found to interact with electrons of radiation belts leading to a scattering of these particles (Sauvaud et al., 2008).
The D-region is the layer of the ionosphere in which propagate transmitter signals and that covers almost 60–90 km in altitude (Inan et al., 2010). The main ground-based VLF transmitters operate in the frequency range 18–25 kHz, radiate powers as large as 1 MW and run almost continuously. Studies reported about high-power densities recorded above powerful transmitter stations (Parrot et al., 2009). Such enhancements occurred above the transmitter station and at conjugate point because such VLF radio waves propagate along field lines. Information about D-region can be derived from signals reflect in the daytime and nighttime, respectively, at altitudes of about 60 and 85 km. The VLF reception technique has a unique advantage the remote sensing of the lower ionosphere that is extremely high for balloons and too low for in situ satellite observations. VLF radio waves propagation features lead to one of the helpful investigations available for determining the sharpness and height of the lower part of the D-region. This has allowed to early characterize the ionosphere defined by two parameters the so-called reflection height and the exponential sharpness depending both on seasons and geographical latitudes (Thomson, 2010). In addition, it has been shown that this region is subject to disturbances related to solar X-ray flares (Feng et al., 2021; Kumar et al., 2015; Rozhnoi et al., 2019). Such solar flares increase the ionospheric electron density where propagate the VLF radio signal, and generate phase and amplitude anomalies. The interest to the solar effect on the Earth's ionosphere increases, since few years, by the developing of VLF network towards a better spatial coverage as performed in Europe (Biagi et al., 2019; Schwingenschuh et al., 2011). Other solar indexes were considered, like sunspots and solar radio flux, in investigating VLF radio propagation in periods of high solar activity. Hence, a correlation degree of about 40 % was found between the transmitter amplitude signals and sunspot index (Boudjada et al., 2012).
In this paper, we analyse the variation of NWC transmitter signals above the ground-based station and at its conjugate point. We first describe, in Sect. 2, the electric field instrument used to record the NWC radio signal, then we report on the CSES orbits selected in this study, and we characterize the main features associated to the VLF emission beam. The main results are discussed in Sect. 3, and are summarized in Sect. 4.
We investigate the North West Cape (NWC) transmitter localized in Australia (21.5∘ S, 114.2∘ E) and radiating a power of 1 MW at 19.79 kHz. The VLF radio signal has been observed by the China Seismo-Electromagnetic Satellite (CSES) during September 2019.
2.1 Electric Field Detector (EFD) onboard CSES satellite
The main objective of CSES mission is the geophysical investigation of space electromagnetic environment at an altitude of 507 km in a circular and polar sun-synchronous orbit with two local time nodes, 02:00 LT as ascending node (night-side orbit) and 14:00 LT as descending node (day-side orbit).
The high-precision magnetometer and search coil magnetometer (Schirninger et al., 2021) and Electric Field Detector (Zhang et al., 2020) perform electromagnetic measurements. EFD experiment is part of the eight scientific payloads and is devoted to a continuous survey of the electric field fluctuations at the altitudes of CSES satellite. The instrument covers four bandwidths ULF (DC–16 Hz), ELF (6 Hz–2.2 kHz), VLF (1.8–25 kHz) and HF (18 kHz–3.5 MHz) with, respectively, sampling rates of 125 Hz, 5 kHz, 50 kHz and 10 MHz. The electric signal is detected by four spherical sensors deployed at a distance of about four meters from the body of the satellite. In our paper, we emphasize on VLF electric field measurements derived from the electric potentials of Sensors A and B and the distance between both probes (Huang et al., 2018). In addition, we use the survey mode observations and the power density of the electric field expressed in mV m−1 Hz.
2.2 Selected CSES Orbits above NWC transmitter and its conjugate point
In the investigated period, we have selected orbits with a power density higher than 0.015 mV m−1 Hz. This intensity level leads us to find specific events (date, time, power density and geomagnetic coordinate) which occurred above NWC transmitter station and its conjugate region. The most intense events are recorded when the satellite was above the transmitter station which happened each 5 d. In addition, almost all events are observed when the CSES satellite is on the night side of the Earth and only one case occurs on dayside. Tables 1 and 2 list the main orbital parameters of the most intense events: the observation day, the observation time, the orbit type (i.e. “1” for night-side and “0” for day-side), the power density in mV m−1 Hz, and the geomagnetic coordinates. Figure 1 displays the considered orbits versus the latitude and the longitude coordinate. The green, blue, violet, yellow and red colors correspond, respectively, to the power density intervals [0.0001–0.015], ]0.015–0.020], ]0.020–0.025], ]0.025–0.030] and ]0.030–0.116] expressed in mV m−1 Hz. We note in Fig. 1 that the intense radio emissions appear when the satellite orbits were approaching the transmitter conjugate region in the northern hemisphere. Those emissions occur the first 10 d of September 2019. Later on, the most intense radiations happened when the CSES satellite was above the NWC transmitter station.
Table 1This table lists the main orbital parameters of CSES trajectories above the NWC station: the observation day, the time observation, the night side (1) or dayside (0) orbit, the power density and the latitude and longitude magnetic coordinates.
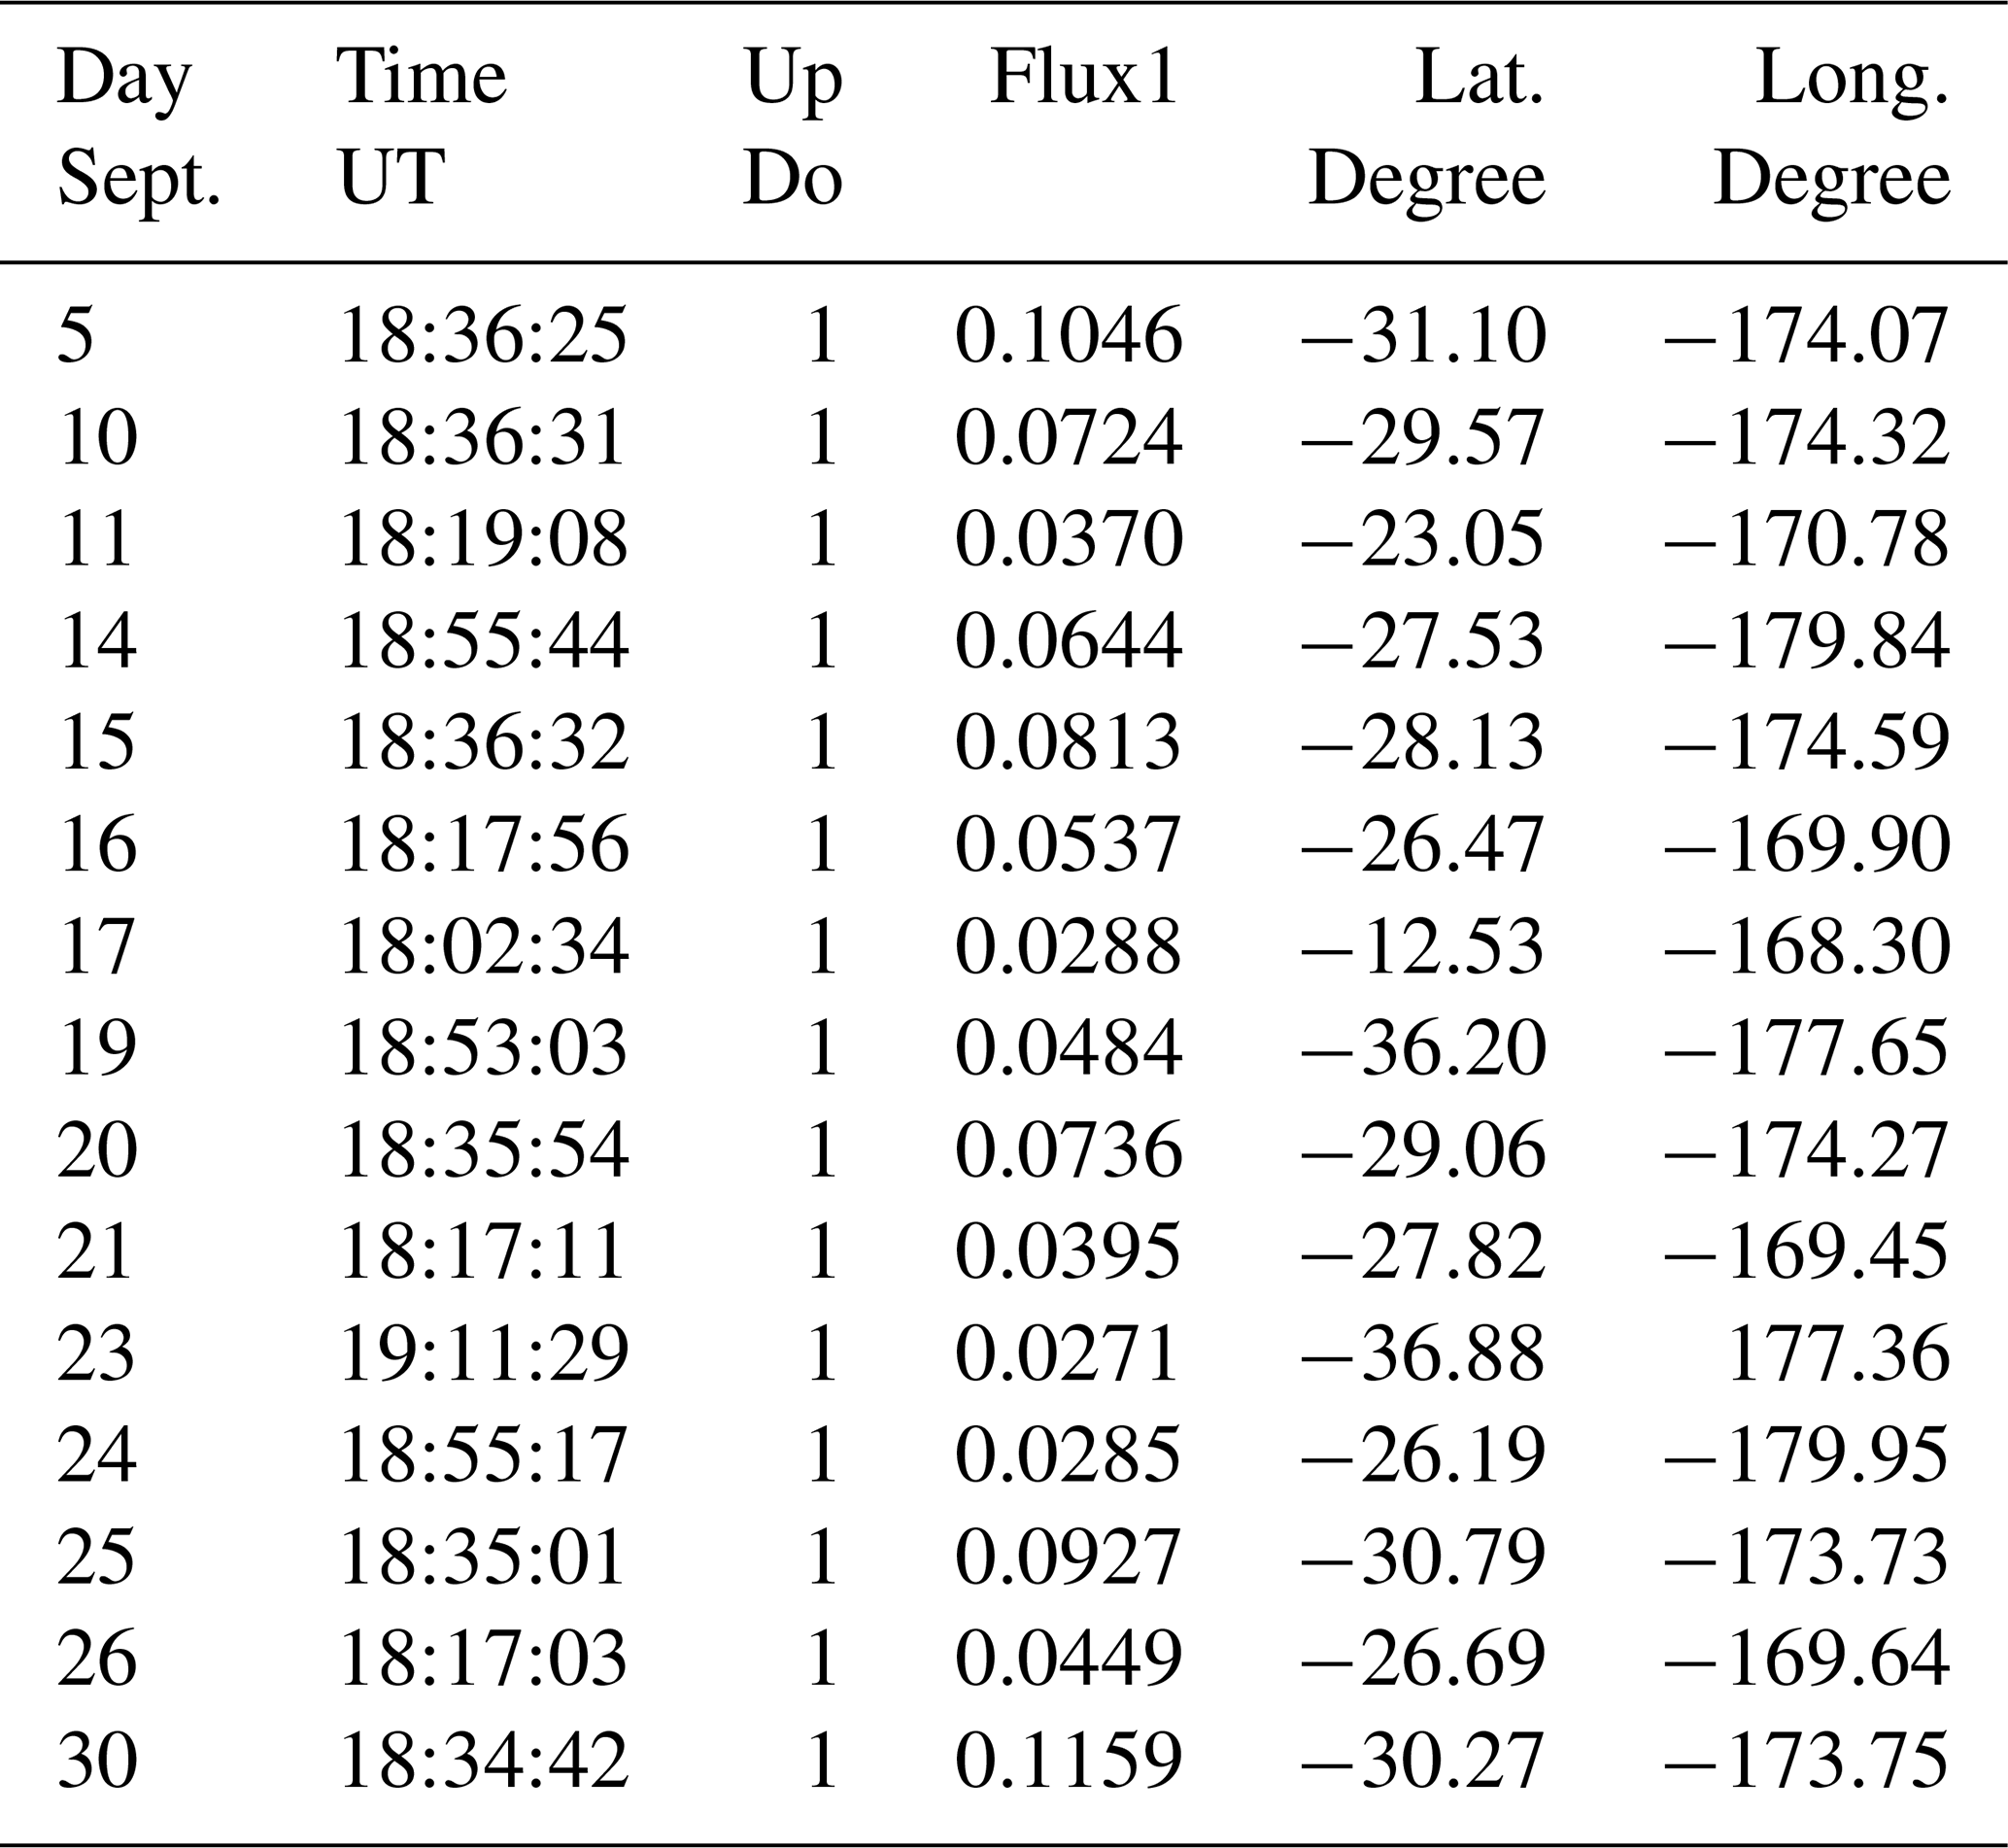
Table 2This table lists the same orbital parameters of CSES trajectories as in Table 1 but at NWC conjugate region.
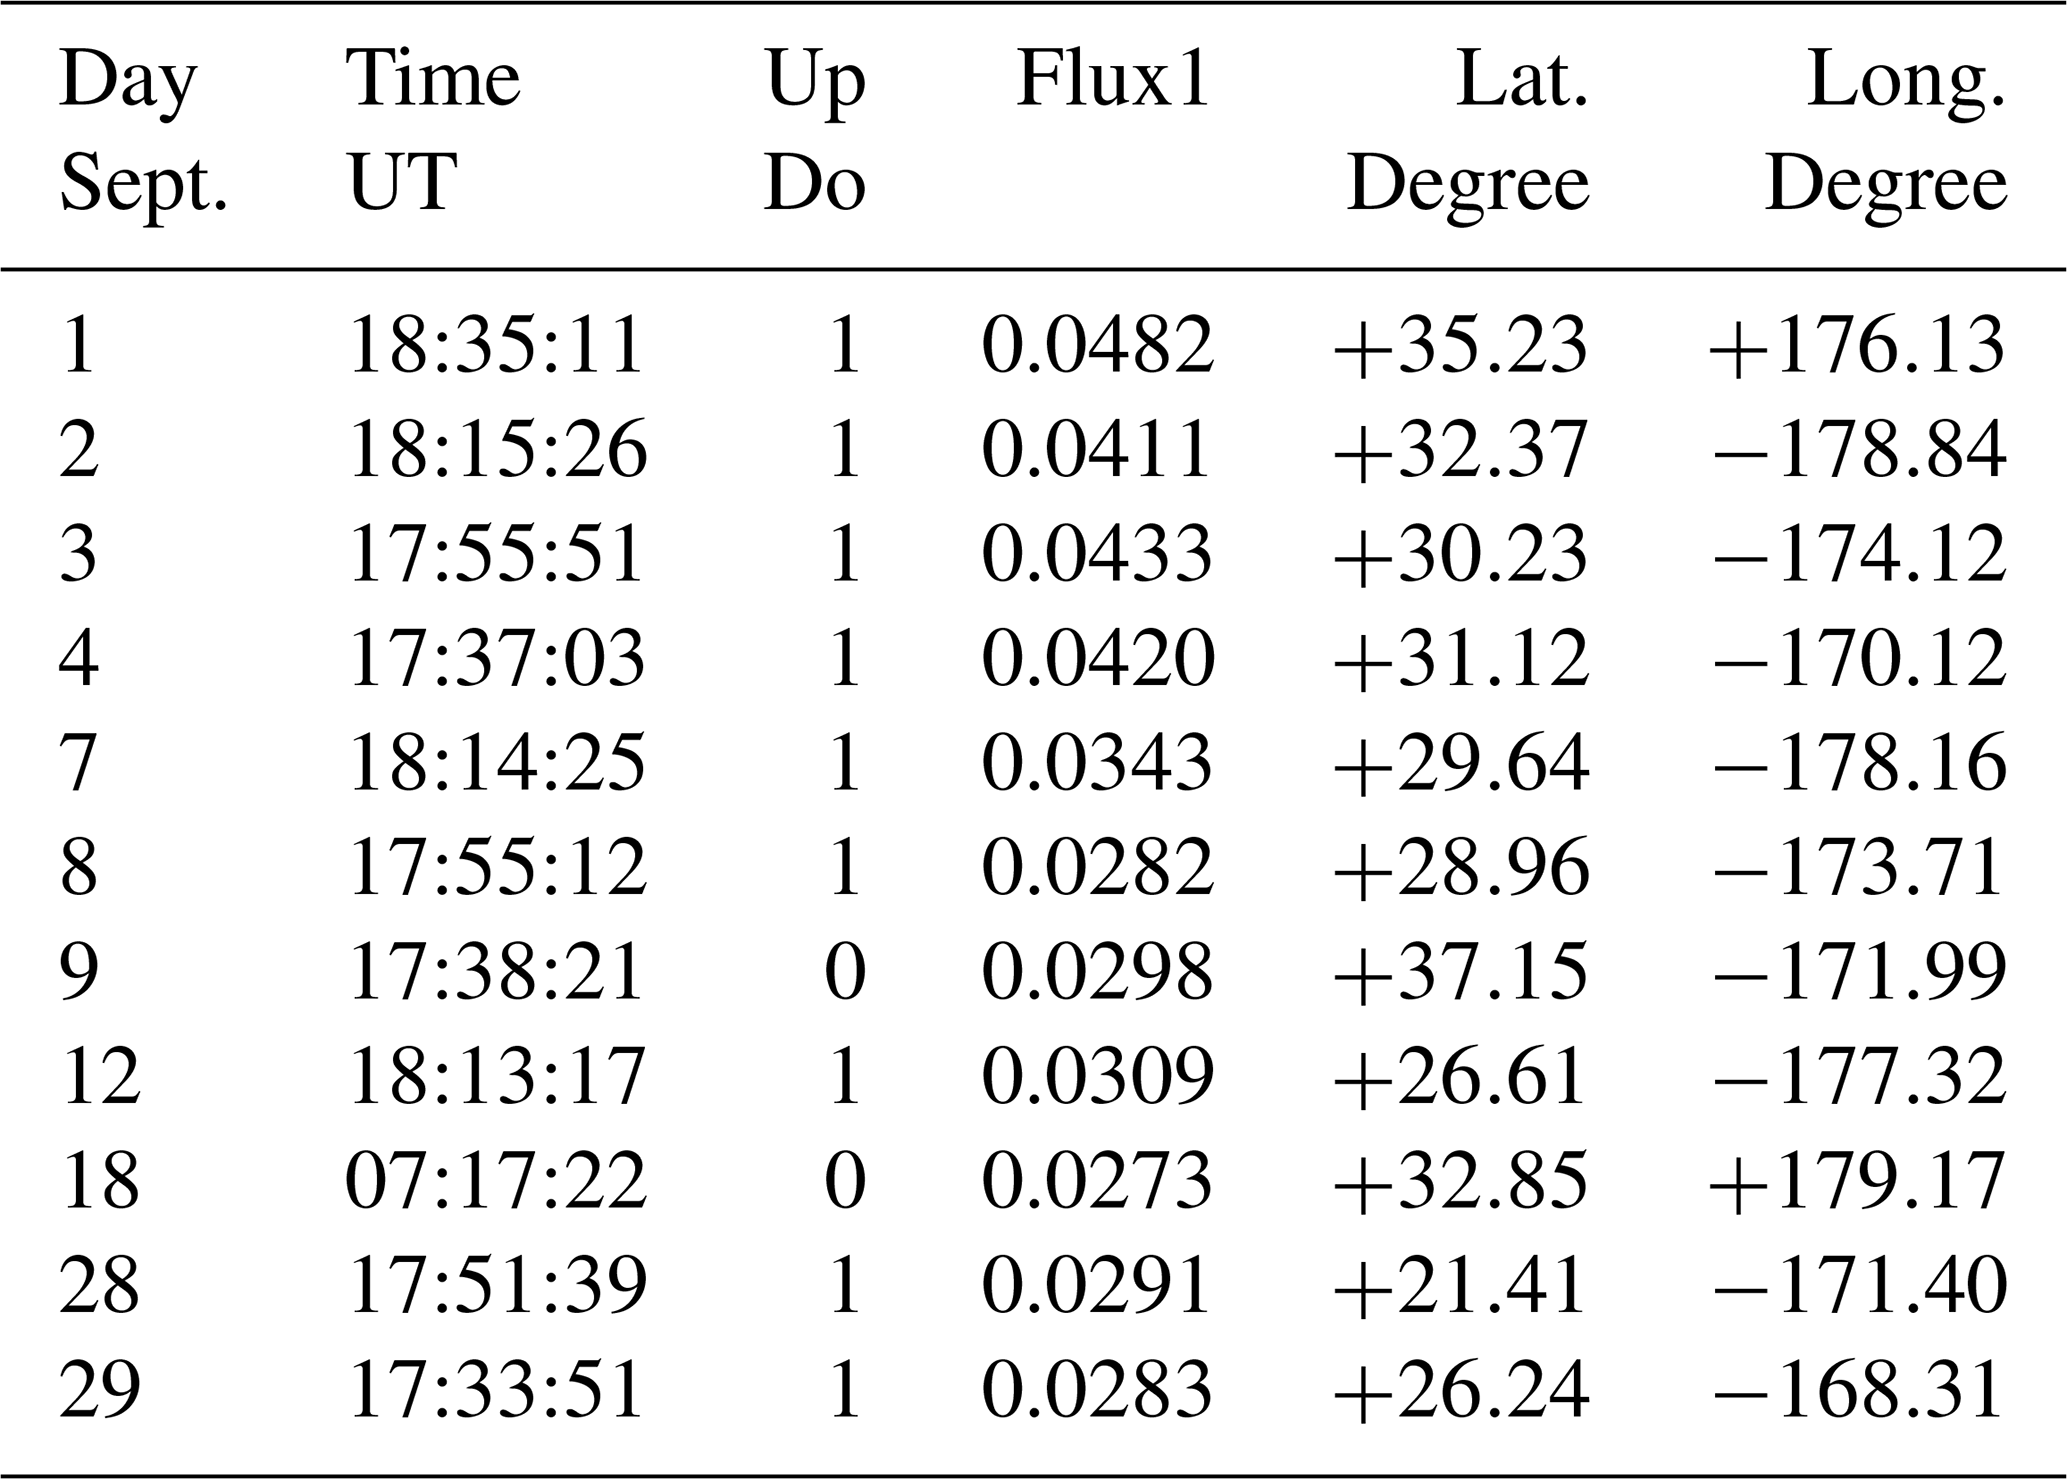
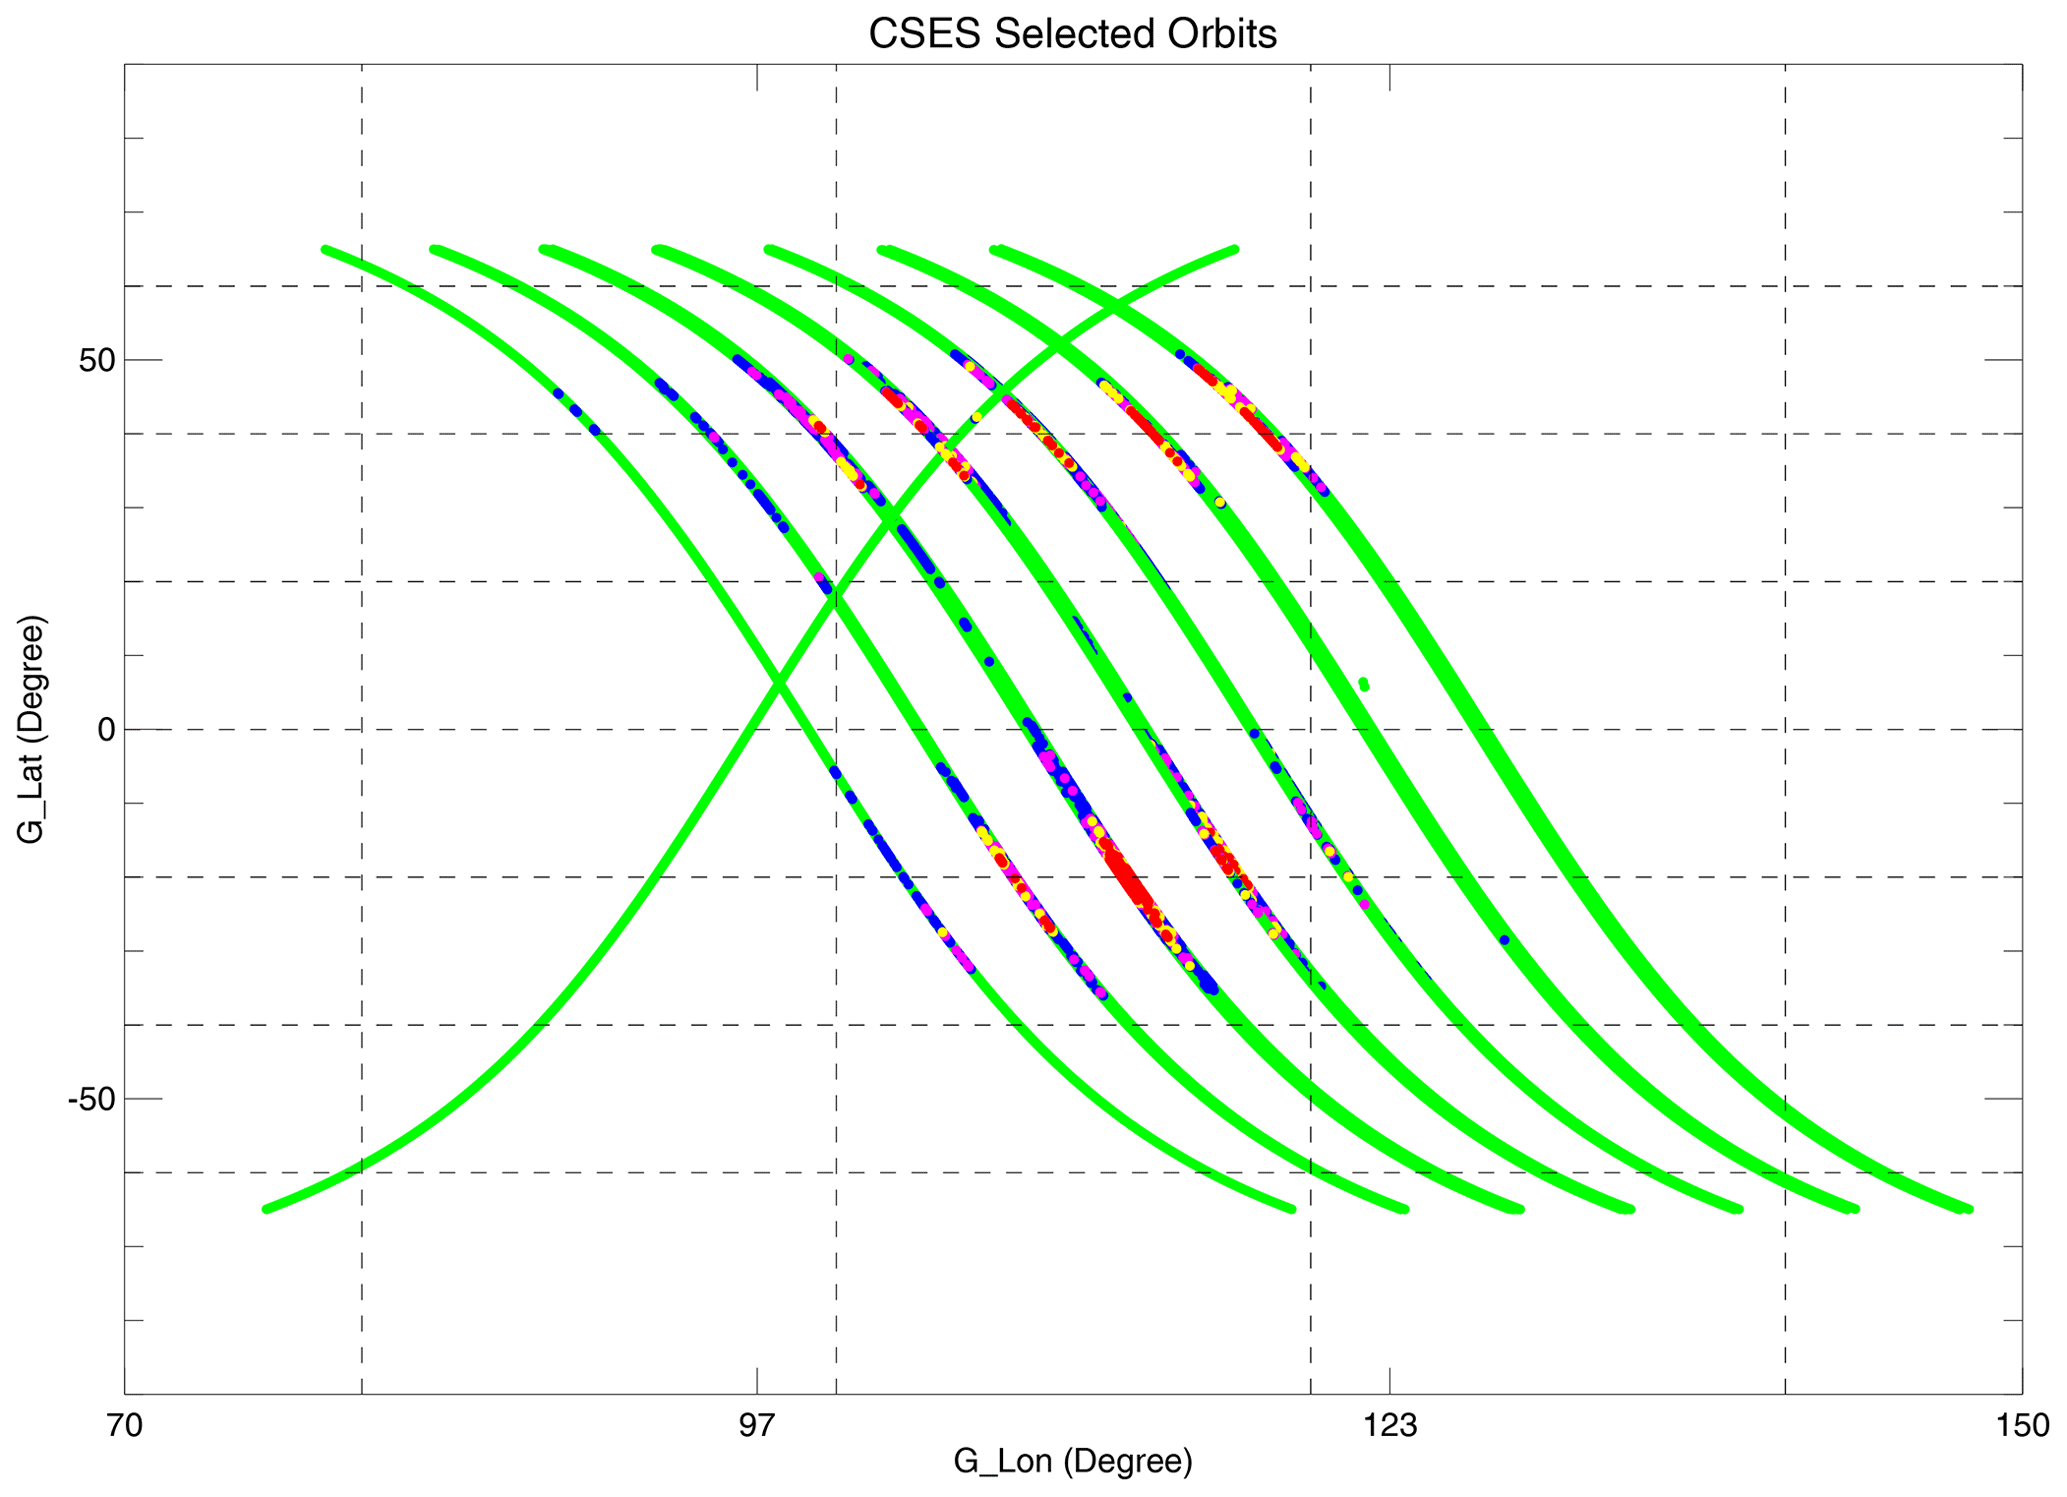
Figure 1Variation of CSES selected trajectories versus the geographical coordinates. Green, blue, violet, yellow and red colors correspond, respectively, to power density intervals: [10−3–], ]–], ]–], ]–] and ]–] expressed in mV m−1 Hz.
2.3 VLF radio transmitter beam
The VLF transmitter signal vary at several occasions depending on the satellite locations above NWC ground-based station. For this, we study the variation of the VLF emission taken into consideration three distances as shown in the sketch of Fig. 2. The first distance “d1” is the altitude of the satellite, the second one is “d2” that indicates the distance between the NWC station and the CSES projected orbit, and the third distance “d3” is equal to . This simple geometrical configuration leads us to study the variation of the electric field power density versus the distance “d3”. This distance describes the motions (e.g. far or close) of the CSES satellite orbits with regard to surrounding regions of NWC transmitter station, and its conjugate region. A second parameter called “Ω” is derived from the relation . The distance “d3” and the angle “Ω” are used hereafter to characterize the emission beam as recorded by CSES satellite. A condition on the distance “d2”, i.e. d2 < 1000 km, has been considered in the selection of CSES orbits. This leads to keep neighboring distances between the CSES projected orbits and the NWC transmitter station and its conjugate point.
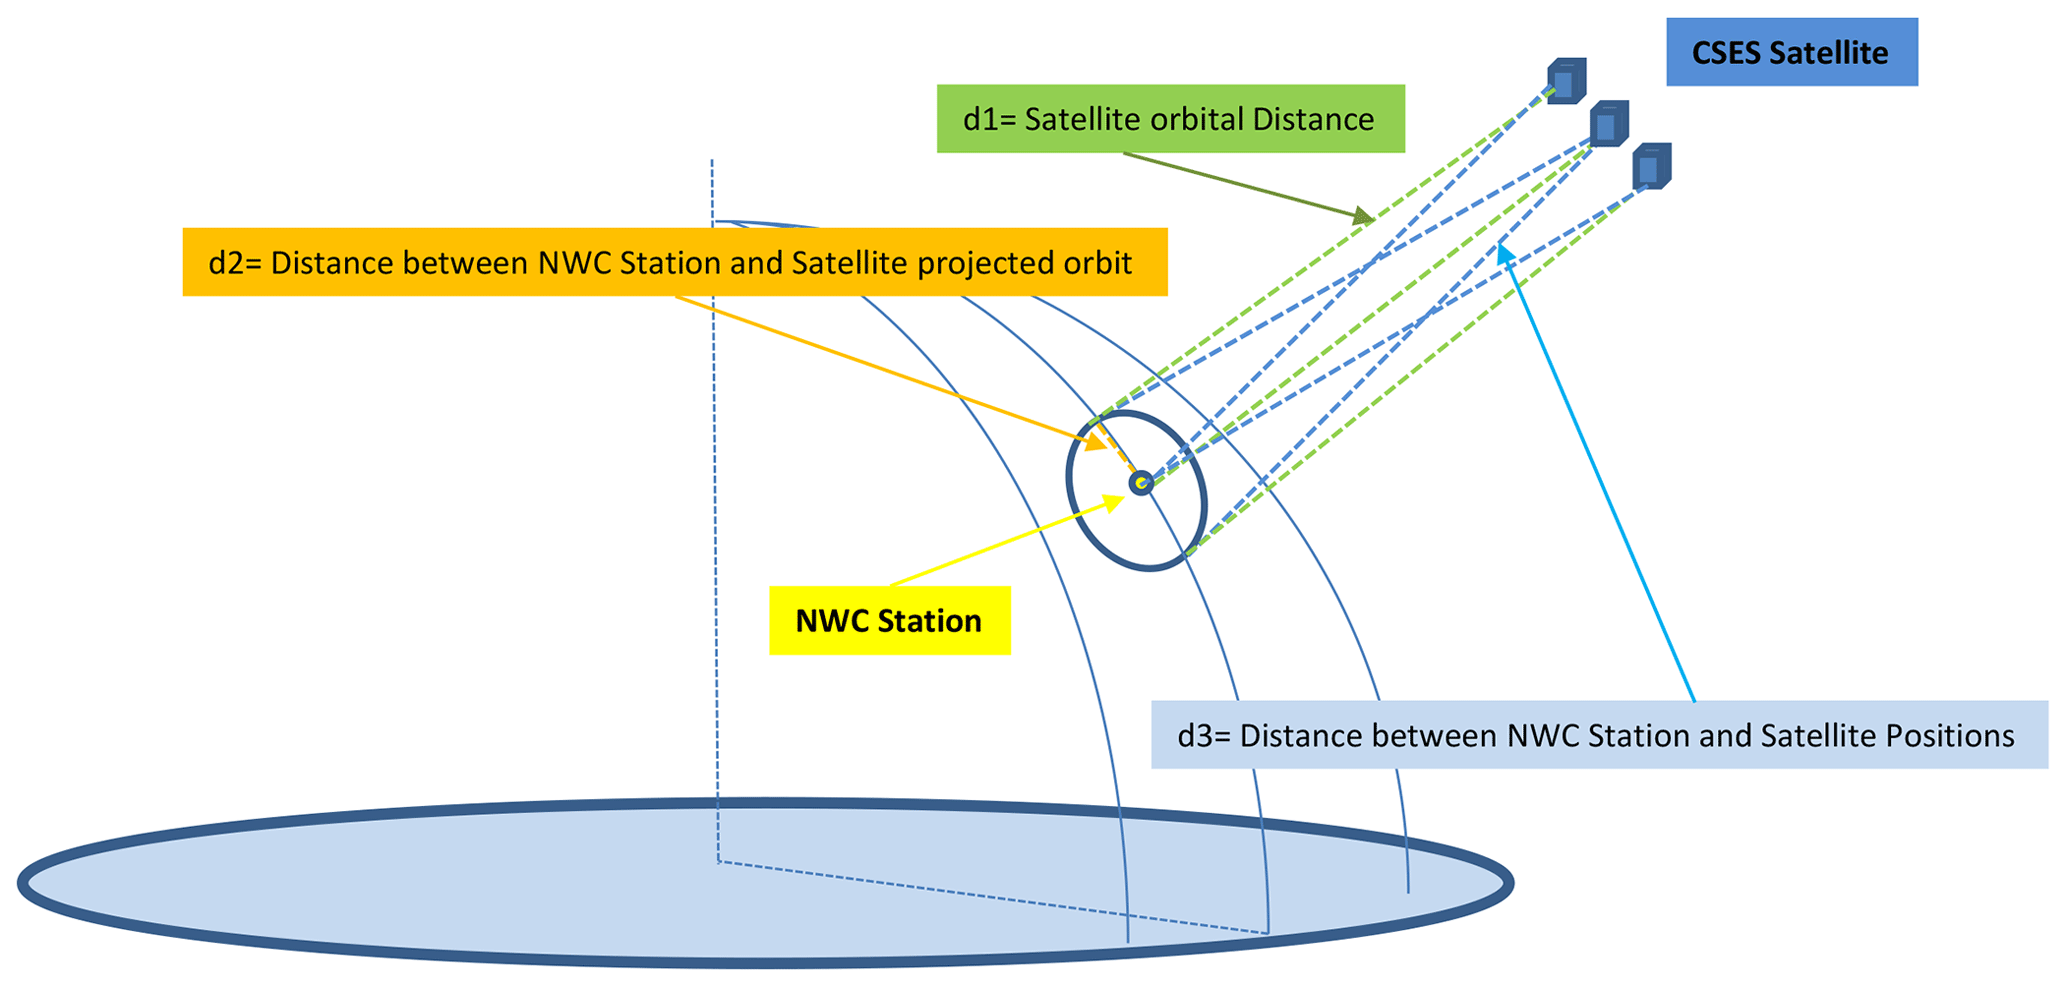
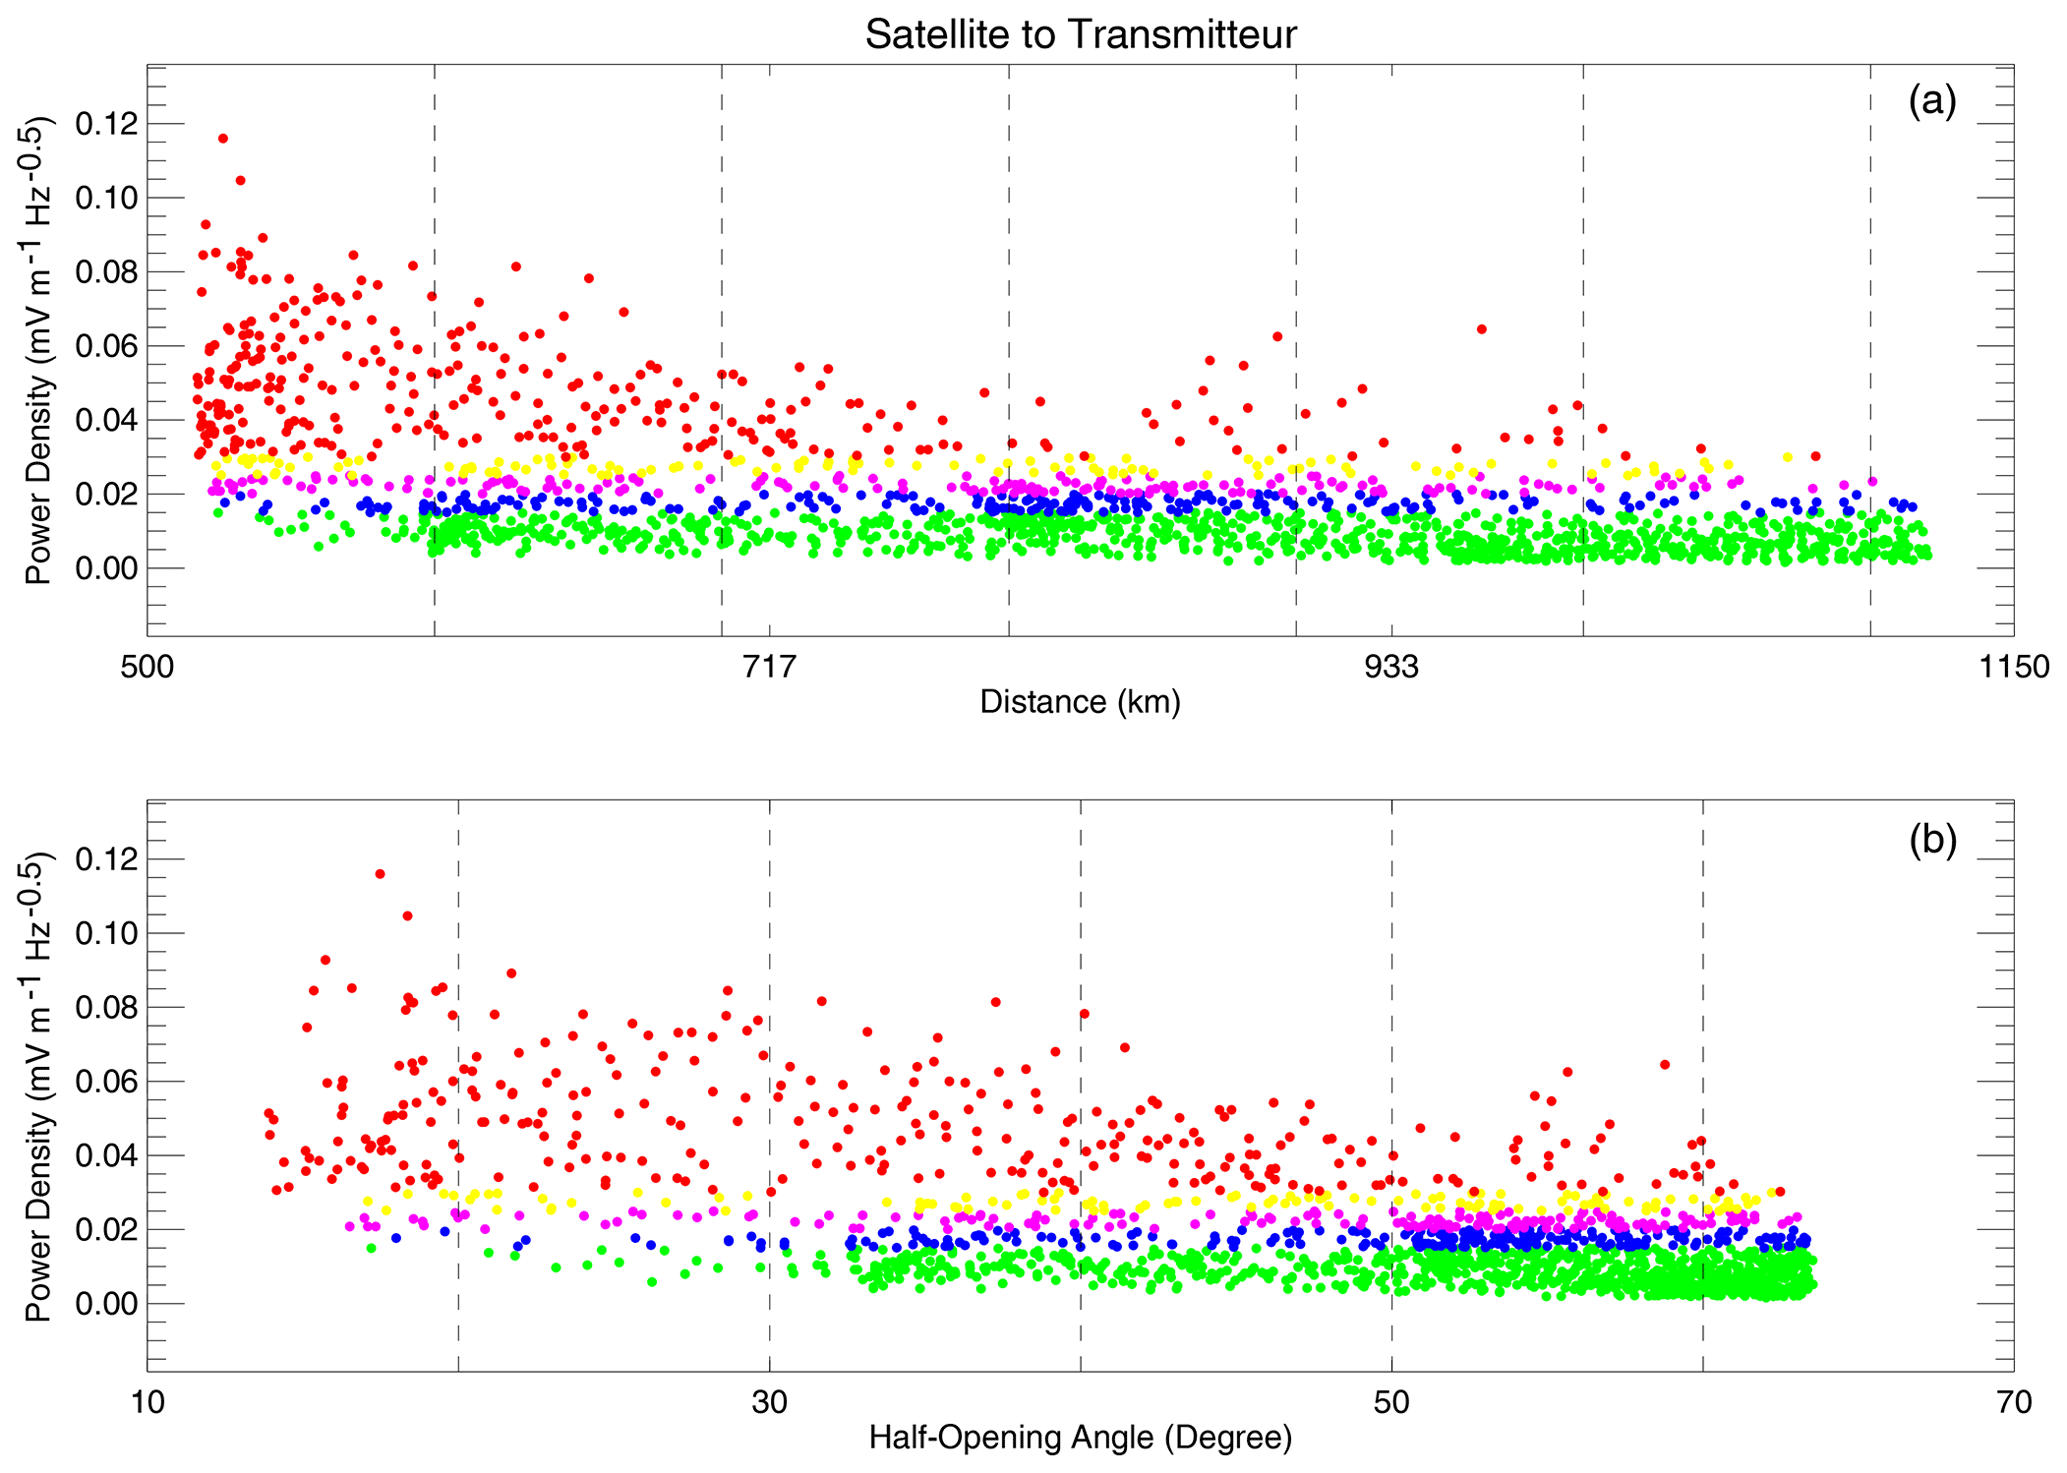
Figure 3Variation of the power density versus the distance (a) and the half-opening angle (b) above the NWC transmitter region. The color codes are similar to those used in Fig. 1.
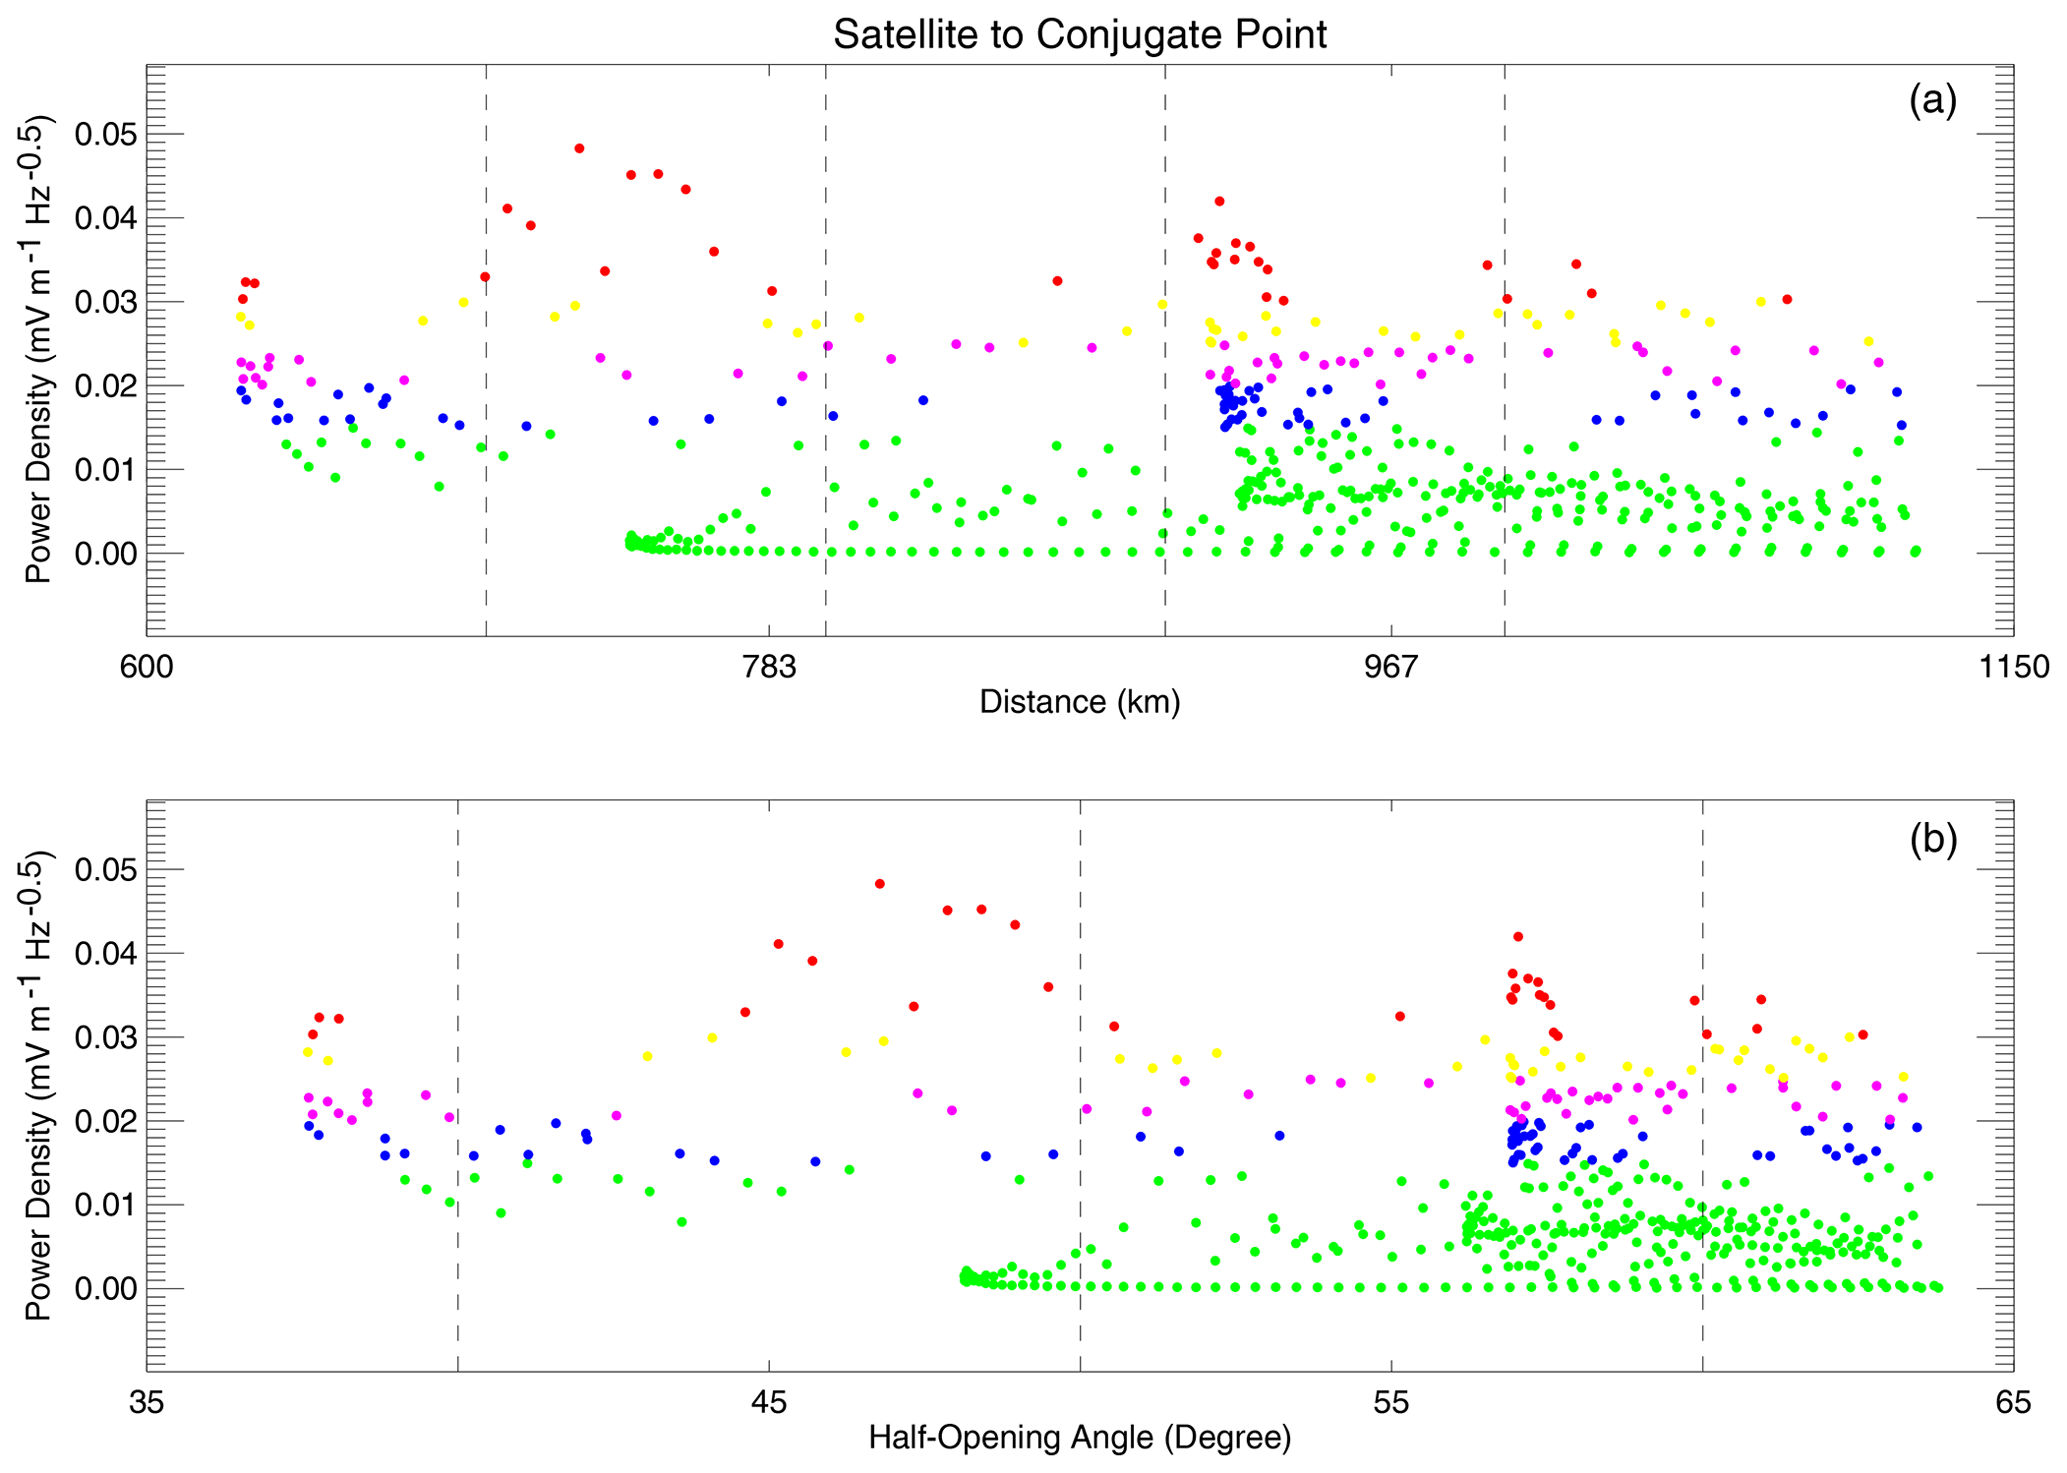
Figure 4Variation of the power density versus the distance (a) and the half-opening angle (b) above the NWC conjugate region. The color codes are similar to those used in Figs. 1 and 3.
Figure 3 shows the variation of the electric field power density (expressed in mV m−1 Hz) versus the distance “d3” (upper panel) and versus the half-opening angle “” (lower panel). Those CSES observations were recorded in the southern hemisphere when the satellite crossed NWC station. First, we find a progressive decrease of the power density when the distance “d3” increases, i.e. 0.12 mV m−1 Hz for 517 km, 0.07 mV m−1 Hz for 600 km, 0.05 mV m−1 Hz for 700 km and 0.04 mV m−1 Hz for 800 km. The power density maximum occurs when the distance “d2” was about 100 km, very close to NWC station. The half-opening angle is found to vary between 14 and 65∘ with a tiny increase followed by a diminution when the distance increases, i.e. 0.05 mV m−1 Hz for 14∘, 0.11 mV m−1 Hz for 18∘, 0.07 mV m−1 Hz for 20∘ and 0.04 mV m−1 Hz for 50∘. Combining both panels, one note that power densities reach maximum values when the half-opening angles are small.
Figure 4 displays the variation of the power density versus the distance “d3” (upper panel) and the half-opening angle “” (lower panel). Those electric field measurements were recorded when CSES satellite orbits were approximately above the NWC conjugate point in the northern hemisphere. Power density exhibits modulations versus the distance at four occasions, i.e. 0.032 mV m−1 Hz for 630 km, 0.048 mV m−1 Hz for 727 km, 0.037 mV m−1 Hz for 910 km, and 0.028 mV m−1 Hz for 998 km. The respective modulations appear in the second panel of Fig. 4 with half-opening angles in the order of 37.7, 47.8, 57.0, and 60∘. Around the third modulation (i.e. 0.37 mV m−1 Hz, 910 km, 57∘) one notes quasi-absence of the signal where the background is dominant.
We consider in this analysis the radio wave signal emitted by NWC transmitter at frequency of 19.79 kHz and detected by the electric field detector (EDF) onboard CSES low Earth orbit satellite. We have selected particular orbits where the electric power density is higher than 0.05 mV m−1 Hz. This leads us to study the variation of the electric field measurements specifically above the NWC transmitter station and its conjugate point. We attempt to quantify the variation of the power density taken into consideration two key geometrical parameters: (a) the distance between the satellite and the locations of NWC station and its conjugate point, and (b) the half-opening angle of the beam.
It is clear from this study that the power density behavior is totally different considering the two investigated locations. The role of the Earth's ionosphere is crucial because it disturbs the VLF signal along its ray path. Such disturbances occur when the satellite trajectory is far from the transmitter station. We show that the significant beam has a half-opening angle of about 15∘. In this case, the maximum of power density is found of about 0.12 mV m−1 Hz for a distance between the satellite and NWC station of nearly 517 km. On NWC conjugate region, the power density observed is lower 0.032 mV m−1 Hz with half-opening of about 38∘. The attenuation and the scattering of the NWC signal is more evident in the conjugate region. Our results is in agreement with Parrot et al. (2009) who showed extensions in longitude of the conjugate region and confinements above transmitter station. Additionally, Lefeuvre et al. (2013) demonstrated that the radio waves propagate from lower ionosphere to the DEMETER satellite altitude at about 700 km.
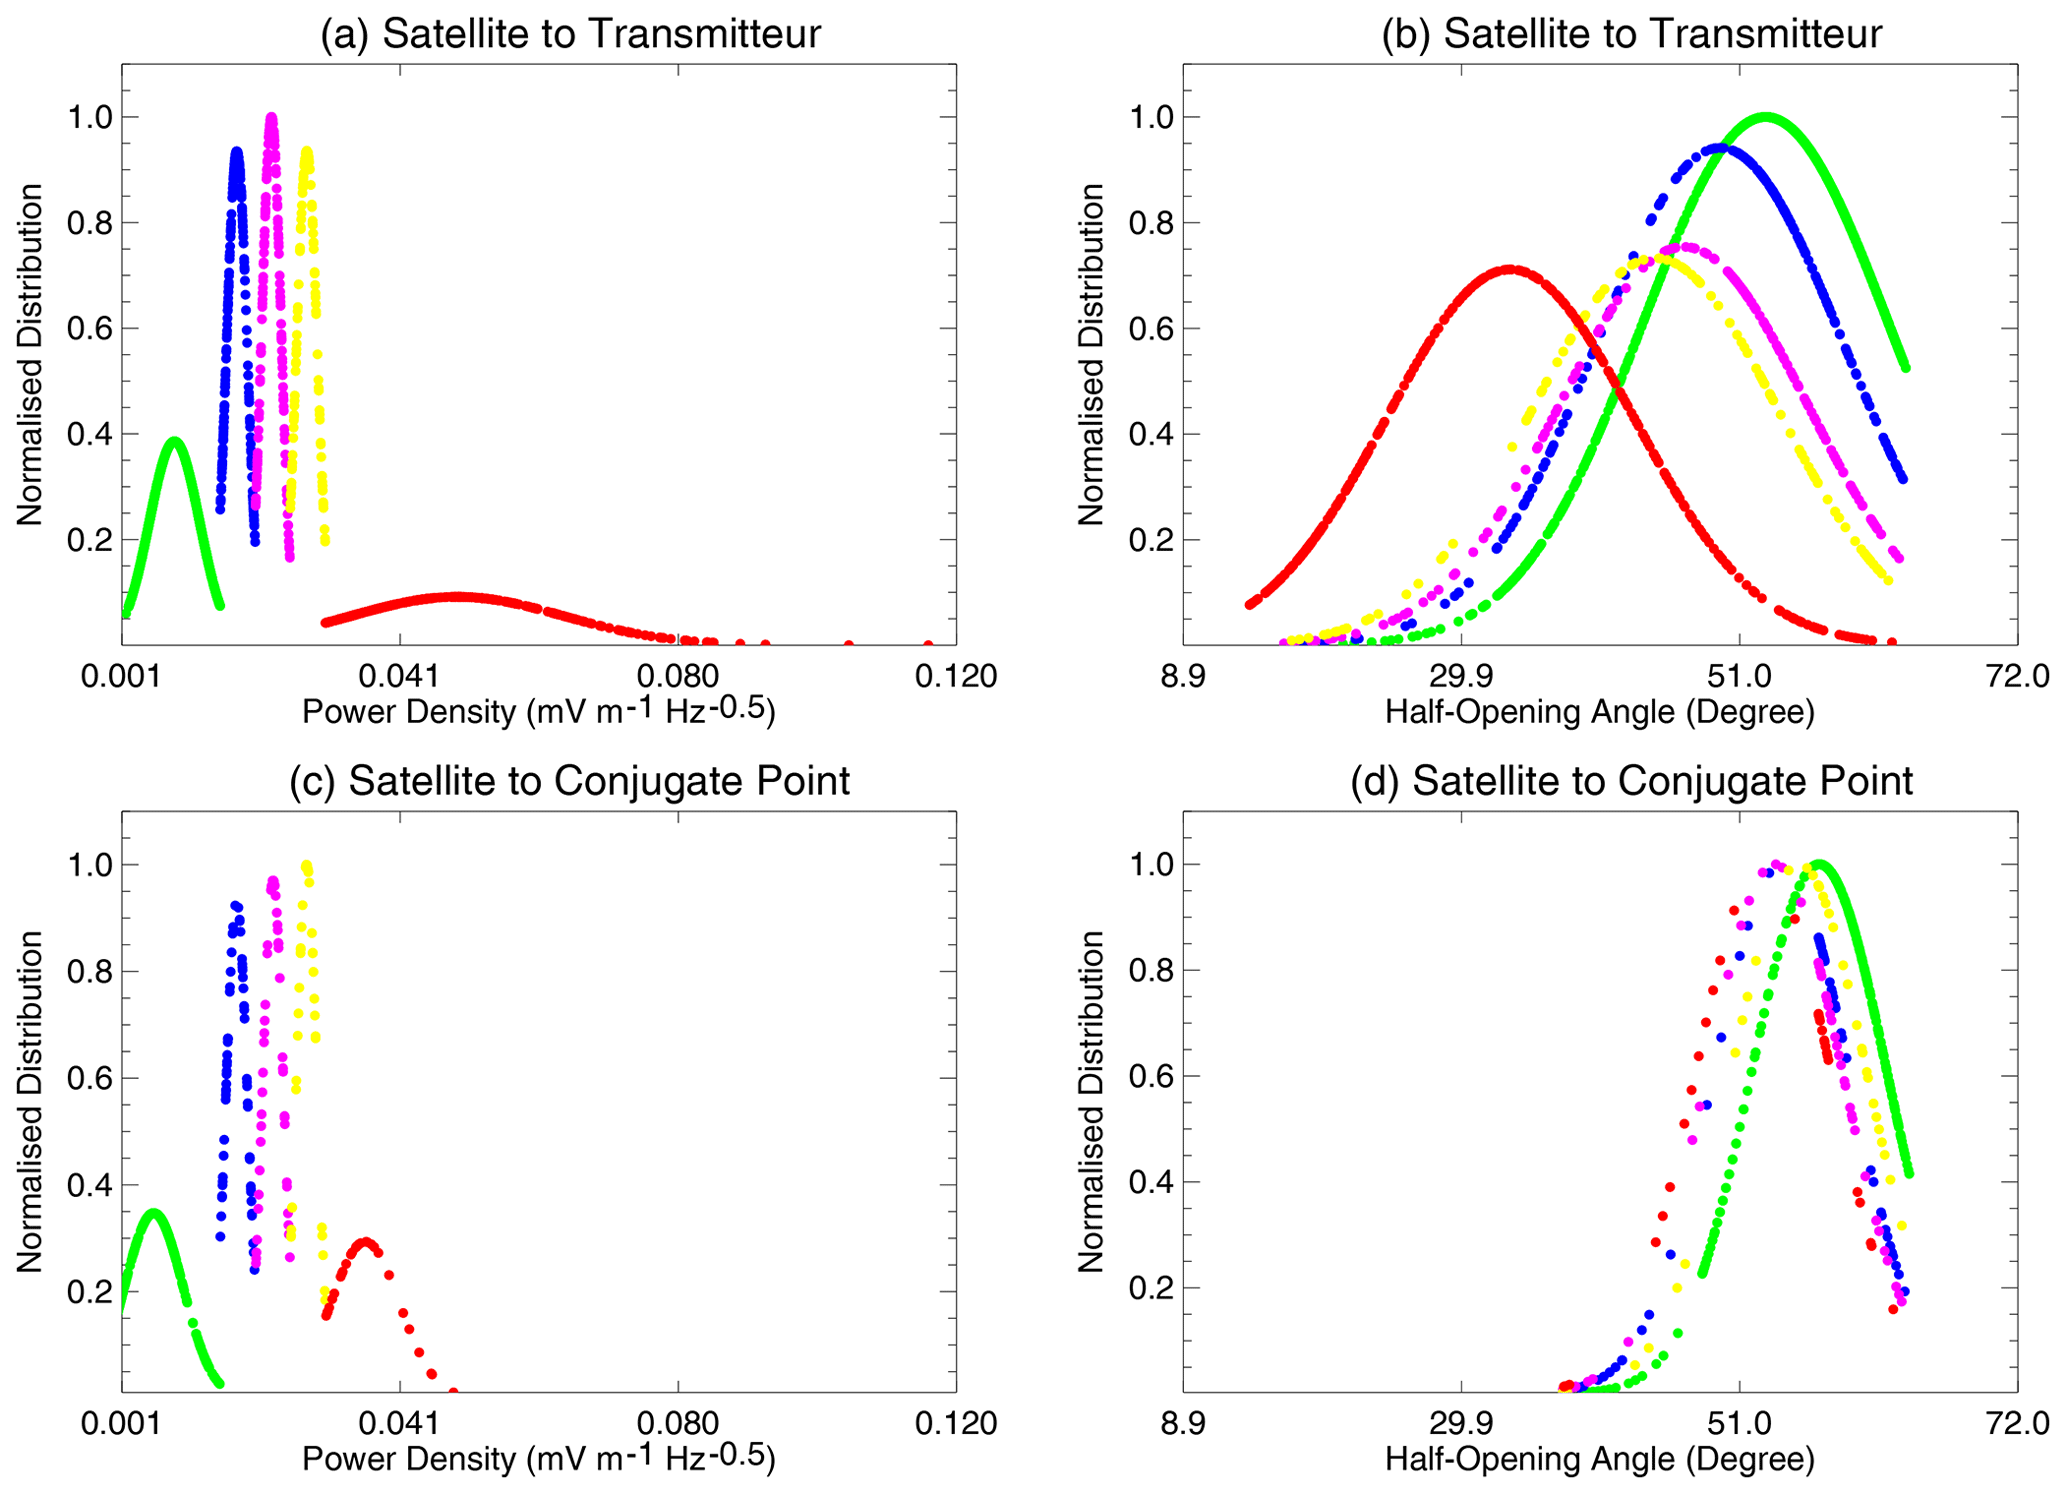
Figure 5Normalized distributions of power densities (a, c) and of half-opening angles (b, d) when the satellite was above NWC transmitter (a, b) and at its conjugate point (c, d). The color codes are similar to those used in Figs. 1, 3 and 4.
It is essential to note that a hollow cone beam might be considered in the case of the VLF radio signal above the NWC station. The main reason is the weak disturbances of the radio signal as shown in Fig. 3. Hence, the hollow cone feature is characterized by an half-opening angle where the power density reduces when the distance increases. However, the half-opening angle exhibits different behavior with an increase from 14 to 18∘ followed by a decrease from 18 to 50∘. In addition, the power density increases from 0.04 to 0.11 mV m−1 Hz and then decreases to 0.05 mV m−1 Hz. The hollow cone concept can only be considered if the distances and the half-opening angles display similar dependence on the power density variation. The situation is different above the conjugate regions where a hollow cone cannot be considered. The presence of modulations could be interpreted as an effect of the ionosphere on the radio wave signal propagations. The disturbed VLF signals appear at an altitude of about 630 km with a half-opening angle of 37.7∘ above conjugate regions, and only 517 km and 14∘ when CSES satellite is above NWC station.
Figure 5 shows the normalised distribution of the power density and the half-opening angle above the ground-based transmitter and at the conjugate point. The color codes are used to distinguish the four power density levels as shown in Figs. 1, 3 and 4. The VLF intense signal (i.e. red color) recorded above the transmitter station is found more extended and cover the range 0.030–0.116 mV m−1 Hz, as displayed in the upper-left panel of Fig. 5, with a mean of about 0.048 mV m−1 Hz. At the conjugate point, the intense signal (i.e. red color) is narrowed to the interval 0.030–0.050 mV m−1 Hz, as illustrated in the lower-left panel of Fig. 5. In this case, the mean is found smaller in the order of 0.005 mV m−1 Hz. Nevertheless, the power density distribution is similar in both hemispheres when the intensity level is smaller than 0.030 mV m−1 Hz. This intensity level boundary leads us to distinguish the following features in the half-opening angle distributions (two left-panels in Fig. 5). Hence, the intense emission (i.e. red color) recorded above NWC station exhibits a well Gaussian distribution fully distinctive from the other ones, as shown in the upper-right panel of Fig. 5, with a mean of about 33.61∘. This is not the case when the satellite is above the conjugate point as displayed in the lower-right panel of Fig. 5. These features allow inferring the only existence of a hollow cone when CSES satellite is above NWC ground-based station. The edge of the beam cone can be estimated from Fig. 5, i.e. upper-right panel, by considering the half-opening angles associated to the power density between 1.6 × 10⁻³ and 0.029 mV m−1 Hz, i.e. blue, violet and yellow curves. The averaged value of the edge is of about 10∘.
We have investigated in this analysis the detection of the NWC transmitter signal by CSES satellite. The orbits have been selected above the NWC station and in the conjugate region. In addition, we only consider the electric power density higher than 0.05 mV m−1 Hz. This leads us to estimate key geometrical parameters that can be derived from the satellite orbit trajectories above both regions and their corresponding beams. We have shown a dependence of the power density on the distance and the half-opening angle. The beam behavior is subject to significant disturbances in the conjugate region with the presence of modulations in the detected signal. Above the NWC transmitter station, the beam can be considered as a hollow cone but with inconsistency dependence of the half-opening angle on the power density. Future investigation will emphasize on the analysis of other transmitters that may help us to a better understanding of the lower ionosphere behavior.
Due to internal confidentiality agreements, the source code is not freely accessible. However, the underlying research details can be requested from the authors.
Data used in this paper is available upon request: Mohammed Y. Boudjada (mohammed.boudjada@oeaw.ac.at).
MYB elaborated the concept for the research subject. Measurements and computations are carried out by MYB and EAH. XZ, WM and AP supported with ideas and feedback. MYB wrote the manuscript and discussed with HUE, PHMG and HL the results and the final manuscript.
The contact author has declared that none of the authors has any competing interests.
Publisher’s note: Copernicus Publications remains neutral with regard to jurisdictional claims in published maps and institutional affiliations.
This article is part of the special issue “Kleinheubacher Berichte 2021”.
The authors acknowledgment China Earthquake Administration for the use of the CSES data, and they thank Xuhui Shen and Jianping Huang who provided the data from the Electric Field Detector (EFD).
This paper was edited by Gottfried Mann and reviewed by two anonymous referees.
Biagi, P. F., Colella, R., Schiavulli, L., Ermini, A., Boudjada, M., Eichelberger, H., Schwingenschuh, K., Katzis, K., Contadakis, M. E., Skeberis, C., Moldovan, I. A., and Bezzeghoud, M.: The INFREP Network: Present Situation and Recent Results, Open Journal of Earthquake Research, 8, 101–115, 2019.
Boudjada, M. Y., Schwingenschuh, K., Al-Haddad, E., Parrot, M., Galopeau, P. H. M., Besser, B., Stangl, G., and Voller, W.: Effects of solar and geomagnetic activities on the sub-ionospheric very low frequency transmitter signals received by the DEMETER micro-satellite, Ann. Geophys.-Italy, 55, 49–55, 2012.
Davies, K.: Ionospheric radio propagation, NBS Monograph., 80, 407 pp., ISBN 978-1124067056, 1965.
Davies, K.: Ionospheric Radio, The Institution of Engineering and Technology, London, United Kingdom, ISBN 978-0-86341-186-1, 2008.
Feng, J., Han, B., Gao, F., Zhang, T., and Zhao, Z.: Analysis of global ionospheric response to solar flares based on total electron content and very low frequency signals, IEEE Access, 9, 57618–57631, https://doi.org/10.1109/ACCESS.2021.3072427, 2021.
Hayakawa, M. and Tanaka, Y.: On the propagation of low-latitude whistlers, Rev. Geophys., 16, 111–123, 1978.
Helliwell, R. A.: Whistlers and Related Ionospheric Phenomena, Stanford Univ. Press, Stanford, Calif., ISBN 978-0486445724, 1965.
Huang, J., Lei, J., Li, S., Zeren, Z., Li, C., Zhu, X., and Yu, W.: The Electric Field Detector (EFD) onboard the ZH-1 satellite and first observational results, Earth and Planetary Physics, 2, 469–478, 2018.
Inan, U. S., Cummer, S. A., and Marshall, R. A.: A survey of ELF and VLF research on lightning-ionosphere interactions and causative discharges, J. Geophys. Res., 115, A00E36, https://doi.org/10.1029/2009JA014775, 2010.
Kumar, S., Kumar, A., Menk, F., Maurya, A. K., Singh, R., and Veenadhari, B.: Response of the low-latitude D region ionosphere to extreme space weather event of 14–16 December 2006, J. Geophys. Res., 120, 788–799, 2015.
Lefeuvre, F., Pinçon, J.L., and Parrot, M.: Midlatitude propagation of VLF to MF waves through nighttime ionosphere above powerful VLF transmitters, J. Geophys. Res., 118, 1210–1219, 2013.
Parrot, M., Inan, U. S., Lehtinen, N. G., and Pinçon, J. L.: Penetration of lightning MF signals to the upper ionosphere over VLF ground-based transmitters, J. Geophys. Res., 14, A12318, https://doi.org/10.1029/2009JA014598, 2009.
Rozhnoi, A., Solovieva, M., Fedun, V., Gallagher, P., McCauley, J., Boudjada, M. Y., Shelyag, S., and Eichelberger, H. U.: Strong influence of solar X-ray flares on low-frequency electromagnetic signals in middle latitudes, Ann. Geophys., 37, 843–850, https://doi.org/10.5194/angeo-37-843-2019, 2019.
Sauvaud, J.-A., Maggiolo, R., Jacquey, C., Parrot, M., Berthelier, J.-J., Gamble, R. J., and Craig, J. R.: Radiation belt electron precipitation due to VLF transmitters: Satellite observations, Geophys. Res. Lett., 35, L09101, https://doi.org/10.1029/2008GL033194, 2008.
Schirninger, C., Eichelberger, H. U., Magnes, W., Boudjada, M. Y., Schwingenschuh, K., Pollinger, A., Besser, B. P., Biagi, P. F., Solovieva, M., Wang, J., Cheng, B., Zhou, B., Shen, X., Delva, M., and Lammegger, R.: Satellite measured ionospheric magnetic field variations over natural hazards sites, Remote Sens., 13, 2360, https://doi.org/10.3390/rs13122360, 2021.
Schwingenschuh, K., Prattes, G., Besser, B. P., Močnik, K., Stachel, M., Aydogar, Ö., Jernej, I., Boudjada, M. Y., Stangl, G., Rozhnoi, A., Solovieva, M., Biagi, P. F., Hayakawa, M., and Eichelberger, H. U.: The Graz seismo-electromagnetic VLF facility, Nat. Hazards Earth Syst. Sci., 11, 1121–1127, https://doi.org/10.5194/nhess-11-1121-2011, 2011.
Thomson, N. R.: Daytime tropical D region parameters from short path VLF phase and amplitude, J. Geophys. Res., 115, A09313, https://doi.org/10.1029/2010JA015355, 2010.
Zhang, X., Wang, Y., Boudjada, M. Y., Liu, J., Magnes, W., Zhou, Y., and Du, X.: Multi-experiment observations of ionospheric disturbances as precursory effects of the Indonesian Ms6.9 earthquake on August 05, 2018, Remote Sens. J., 12, 4050, https://doi.org/10.3390/rs12244050, 2020.