 | 01 Dec 2023
Long-term trends of midlatitude horizontal mesosphere/lower thermosphere winds over four decades
Ales Kuchar
Toralf Renkwitz
Juliana Jaen
We analyse 43 years of mesosphere/lower thermosphere (MLT) horizontal winds obtained from a joint analysis of low frequency (LF) spaced receiver lower ionospheric drift measurements from late 1978 through 2008 and VHF meteor radar wind observations since summer 2004 at Collm (51.3∘ N, 13.0∘ E). Due to limitations of the earlier LF measurements, we restrict ourselves to the analysis of monthly mean winds near 90 km, which represents the meteor peak height as well as mean LF reflection heights in the MLT. We observe mainly positive trends of the zonal prevailing wind throughout the year, while the meridional winds tend to decrease in magnitude in both summer and winter. Furthermore, there is a change in long-term trends around the late 1990s, which is most clearly visible in summer MLT winds. We compare these measurements with long-term partial reflection radar observations of winds at 81–85 km over Juliusruh (54.6∘ N, 13.4∘ E) since 1990, and find general qualitative agreement of trends except for summer. The latter can be explained by the different altitudes considered, and by the latitude dependence of the summer mesospheric jet.
- Article
(2464 KB) - Full-text XML
- BibTeX
- EndNote


It is well known that anthropogenic influences have a cooling effect on the middle atmosphere, including the mesosphere/lower thermosphere (MLT) which has been shown by observations (She et al., 2019) and modelling (Akmaev, 2002; Bremer and Berger, 2002; Qian et al., 2019; Liu et al., 2020), and which is associated with a shrinking of atmospheric layers from the stratosphere (Pisoft et al., 2021) and mesosphere (Taubenheim et al., 1997; Bremer and Berger, 2002; Peters et al., 2017) to the thermosphere (Emmert et al., 2008; Emmert, 2015). Thermospheric climate change also manifests itself in changes and a decrease in ionospheric layer heights and long-term variability of their plasma parameters (Bremer, 2008; Mielich and Bremer, 2013; Jakowski et al., 2017; Liu et al., 2021). This has been summarized several times (e.g., Beig et al., 2003; Laštovička et al., 2006, 2008; Beig, 2011). The effect of anthropogenic atmospheric composition change on the MLT wind is less clear. From earlier radar observations there is an indication that, at least during the last decades, the zonal winds change towards more westerly ones both in summer and winter, and that the meridional winds show a decrease in magnitude (Bremer et al., 1997; Jacobi et al., 1997, 2015; Hoffmann et al., 2011). However, winds in the MLT are strongly forced by gravity wave breaking, and the gravity waves are in turn filtered by the middle atmosphere mean winds. This means, that the MLT winds are influenced mainly by middle atmospheric mean wind changes. Possible changes in gravity wave sources and the interaction between mean winds and waves play a minor role as has been shown by Smith et al. (2010). Still, besides further modelling effort, analysis of long wind time series are required.
Apart from the long-term cooling and a decrease in layer heights, changes in trends of various middle and upper atmosphere parameters have been reported. One mechanism possibly responsible for trend changes is the ozone reversal after 1995, and decreasing cooling or even recent warming of the middle atmosphere had been attributed to that (Lübken et al., 2013). Trends of other parameters, such as planetary waves or ozone laminae (Jacobi et al., 2008, 2009b) also had breakpoints near the ozone turnaround date, and MLT wind changes were thought to be connected with that. It is, however, also possible that MLT wind trend changes are connected with long-term trends in the lower atmosphere, e.g. increased temperature trends at high latitudes after the 1990s (Wendisch et al., 2023).
Two of the longest MLT radar wind time series are available in Germany, namely at Collm (51.3∘ N, 13.0∘ E; Jacobi et al., 1997; Jacobi and Kürschner, 2006; Jacobi et al., 2015) and Juliusruh (54.6∘ N, 13.4∘ E; Keuer et al., 2007; Hoffmann et al., 2011; Jaen et al., 2022). Owing to their different observation methods, they refer to slightly different heights in the MLT, and although long-term trends at the individual sites have been determined several times, a direct comparison of long-term changes at these two sites is still missing. Therefore, in this paper, we compare long-term changes of MLT zonal and meridional winds over Collm and Juliusruh based on observations from 1990 to 2021 in order to check whether the derived trends are consistent. The Collm time series extends further back in time, and these data will be presented also.
At Collm, MLT winds had been measured from December 1978 to 2008 by the low frequency (LF) spaced receiver (D1) method using the sky wave of three commercial radio transmitters. Monthly median half-hourly winds have been used to calculate monthly mean zonal and meridional prevailing winds using a regression analysis including mean winds and the semidiurnal tide (Jacobi and Kürschner, 2006). Since the reflection height itself has been measured only after late 1982 (Kürschner and Schminder, 1986; Kürschner et al., 1987), the data are attributed to the mean nighttime LF reflection height of about 90 km (Jacobi et al., 2009a). LF observations at Collm had started even earlier than 1978 (e.g., Sprenger and Schminder, 1967; Jacobi et al., 1997), but these measurements had been performed on single frequencies and they are not used here.
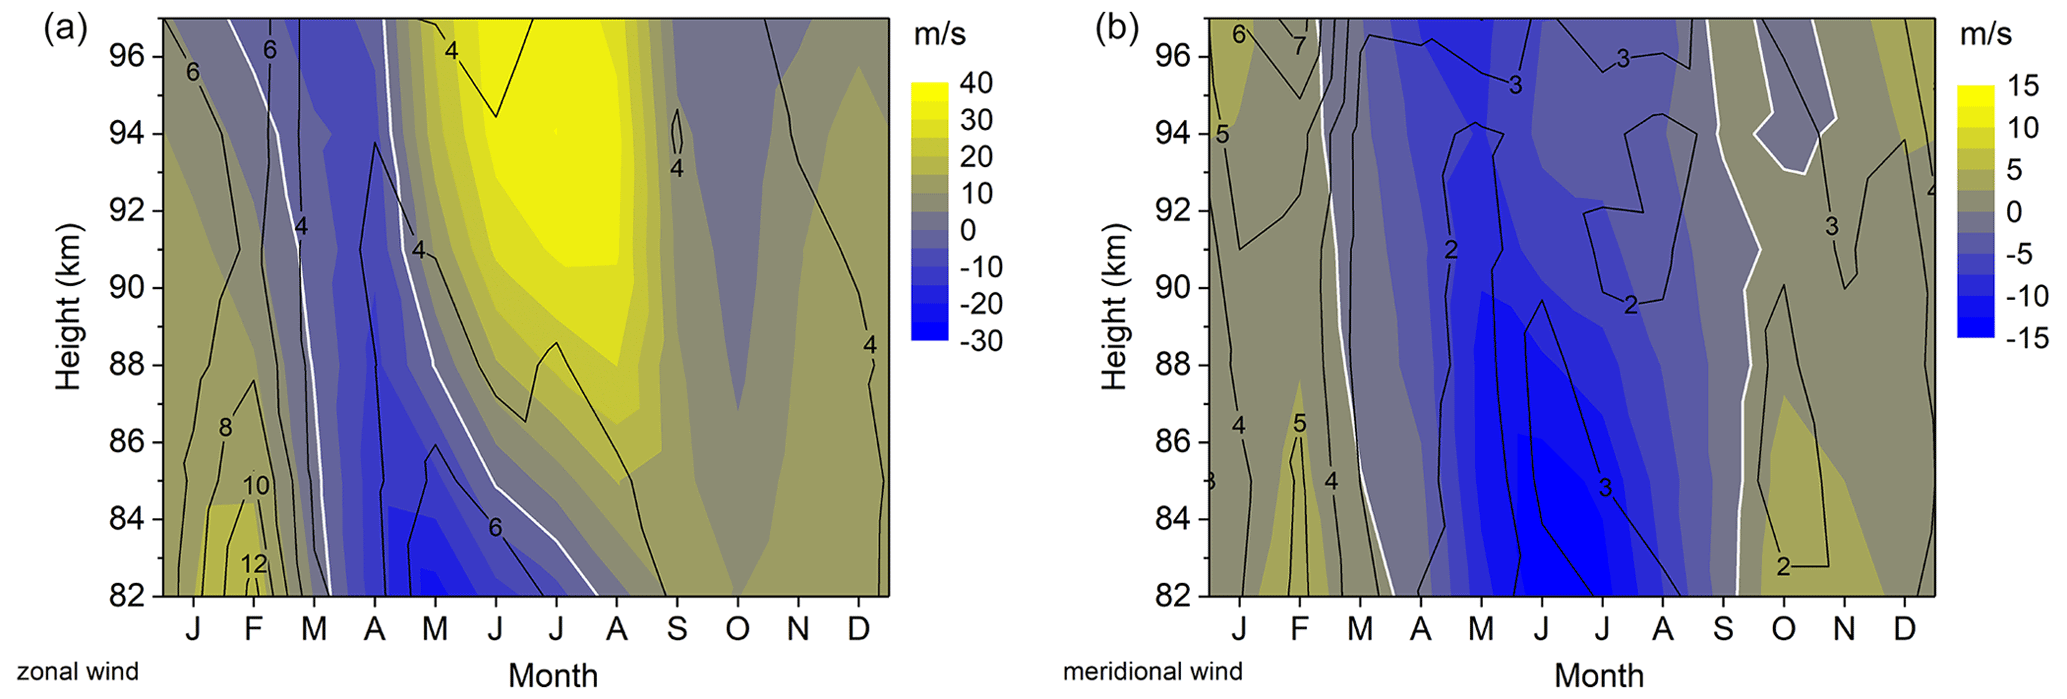
Figure 1Color coding: 2005–2021 mean monthly mean zonal (a) and meridional (b) winds over Collm measured by VHF meteor radar. The respective zero lines are given as solid white curves. Contour lines: standard deviations based on the monthly means of each year.
Since 2004 to date, VHF meteor radar observations have been performed at Collm on 36.2 MHz (Jacobi et al., 2007). An upgrade of the radar has been made in 2015/2016, including antenna configuration and peak power increase. Details of the radar configuration can be found, e.g., in Stober et al. (2021). The radar delivers wind observations in the approximate height range of 75 to 105 km, and the height information is provided by an interferometer. Mean height-time cross-sections of zonal and meridional VHF radar winds for the years 2005–2021 are shown in Fig. 1. In winter, zonal winds are westerly and meridional winds are poleward. In summer, zonal winds are easterly in the upper mesosphere, but westerly in the lower thermosphere, while the meridional winds are southward. The year-to-year variability of mean winds is larger in winter than in summer, due to the action of planetary waves and especially sudden stratospheric warmings especially in January and February (e.g., Charlton and Polvani, 2007), which may strongly affect the mesospheric and thermospheric circulation (e.g., Hoffmann et al., 2007; Miyoshi et al., 2015; Shepherd et al., 2020). Meridional winds, which are driven mainly by gravity wave mean flow interaction in the mesosphere, are considerably weaker than the zonal winds. Similar seasonal cycles of MLT winds have been already shown by earlier observations at Collm and at other midlatitude sites (e.g., Manson and Meek, 1984, 1991; Kashcheyev and Oleynikov, 1994; Schminder et al., 1997). In the following analysis, we do not include the height information that is available from the interferometer, and use the VHF winds without the height information. Monthly mean prevailing winds are calculated by a least squares fit of one month of half-hourly mean winds on model winds including the mean (prevailing) wind and the semidiurnal and diurnal tide (Jacobi et al., 2015).
Meteor peak heights are close to 90 km (e.g., Liu et al., 2017) and thus are comparable to the mean LF nighttime reflection heights. Therefore, the LF and VHF wind time series have been combined using a LF D1 speed bias correction and a virtual height correction based on the joint LF/VHF observations from mid 2004 to 2008. The virtual height correction takes into account the group retardation of LF radio waves in the ionospheric D region that leads to too high (virtual) heights. The correction was performed using phase comparisons of the semidiurnal tide (Jacobi, 2011) and resulted in mean nighttime LF real height estimates that are very close to meteor peak heights. The zonal LF and VHF winds during the joint measurements were close to each other (Jacobi et al., 2015). The meridional LF and VHF winds differed, which was partly due to a spaced receiver speed bias particularly strong in meridional winds (Jacobi et al., 2009a). Furthermore, a correction of the bias due to nighttime LF observation gaps was applied to take into account that neglecting the diurnal tide in the LF analysis leads to errors in mean meridional winds especially in summer due to the diurnal tide phase position then. Therefore, a mean meridional wind bias for each month of the year separately was determined and used to correct the LF meridional winds. The analysis method is described by Jacobi et al. (2015). Note that meteor heights tend to decrease with time due to the shrinking of the middle atmosphere (Stober et al., 2014; Lima et al., 2015), but the same is true for the LF nighttime reflection heights (Kürschner and Jacobi, 2003) so that no change in trends will arise from this decrease. Here, we use combined LF/VHF data from December 1978 through May 2022 for a long-term trend annalysis, while a presentation of the seasonal cycle (see section 4 below) is based on data from January 1990 to December 2021. A long-term linear trend comparison between WACCM-X predictions and the Collm dataset for the shorter period of 1980–2014 has also been performed by Qian et al. (2019). They modeled long-term trends and solar cycle variability of mesospheric temperatures and winds. Their simulated wind trends varied greatly with season and location.
Between 1990 and 2003 a partial reflection (PR) radar was in operation in Juliusruh working with the FMCW (Frequency Modulated Continuous Waves) method at a frequency of 3.18 MHz (e.g., Keuer et al., 2007). This radar has been replaced in spring 2003 by a new modular transmission and reception system (Hoffmann et al., 2010) with distributed power and a new so-called Mills-Cross-Antenna. Now the radar is working with a peak pulse power of 64 kW to date. Other technical parameters are: 27 µs pulse width, 18∘-wide 3 dB beam width, height resolution of 4 km, and sampling resolution of 1 km. We use means from observations obtained between 81 and 85 km using the Full Correlation Analysis wind method.
The following analysis is based on measurements from December 1979 to May 2022 for Collm data, and January 1990 to December 2021 for a comparison of Juliusruh and Collm long-term changes. For Juliusruh, we use monthly means calculated from daily data. For Collm, we use regression analyses based on one month of half-hourly mean zonal and meridional winds each. Seasonal mean winds are calculated as averages over three monthly mean winds. Note that the Juliusruh winds refer to the upper mesosphere throughout the year. Collm observations in winter also show mesospheric winds, but in summer the lower thermospheric jet is visible.
In Fig. 2 are shown 3-monthly mean zonal and meridional winds over Collm at about 90 km for winter (December–February, DJF), spring (March–May, MAM), summer (June–August, JJA), and autumn (September–November, SON). Linear fits without and with one possible trend breakpoint are also added. Breakpoints have been determined through a piecewise linear fitting. This method selects the most probable piecewise fit model with a priori unknown number of breakpoints (up to five) and autoregressive model of order 0, 1, or 2 by minimizing the Bayesian Information Criterion (BIC). The standard deviation of the breakpoint year is determined using a Monte Carlo method. Details of the breakpoint model are given in Liu et al. (2010). We allow a minimum distance of 5 years between individual breakpoints. Trend breaks are given as solid symbols in Fig. 2, if they are indicated as the most probable solution by the minimum BIC, otherwise they are half-filled. Also shown in Fig. 2 are standard deviations of breakpoints. Uncertainty in determining the breakpoints arises from interannual wind variability in relation to the change of linear trend. For MAM zonal winds, the minimum BIC refers to a fit curve with three breakpoints (black line in Fig. 2), which is also added. However, the related BIC is not so much different from the one for a curve with only one breakpoint. If no solid breakpoint symbol is shown, the most probable fit is a straight line. The linear trend coefficients and years of possible trend breaks are also shown in Table 1, together with the respective BIC and order of the autoregression model in brackets and the linear trend values before and after the respective breakpoint. The linear trends differ somewhat from those presented by Qian et al. (2019). They used only data until 2015, and trends have been derived from a multiple linear regression including trend and solar cycle. The zonal wind trends by Qian et al. (2019) are somewhat stronger than those reported here, which can be explained by either a solar cycle influence or the effect of the recent years, where in Fig. 2 one can see an tendency opposite to the linear long-term trend in all seasons.
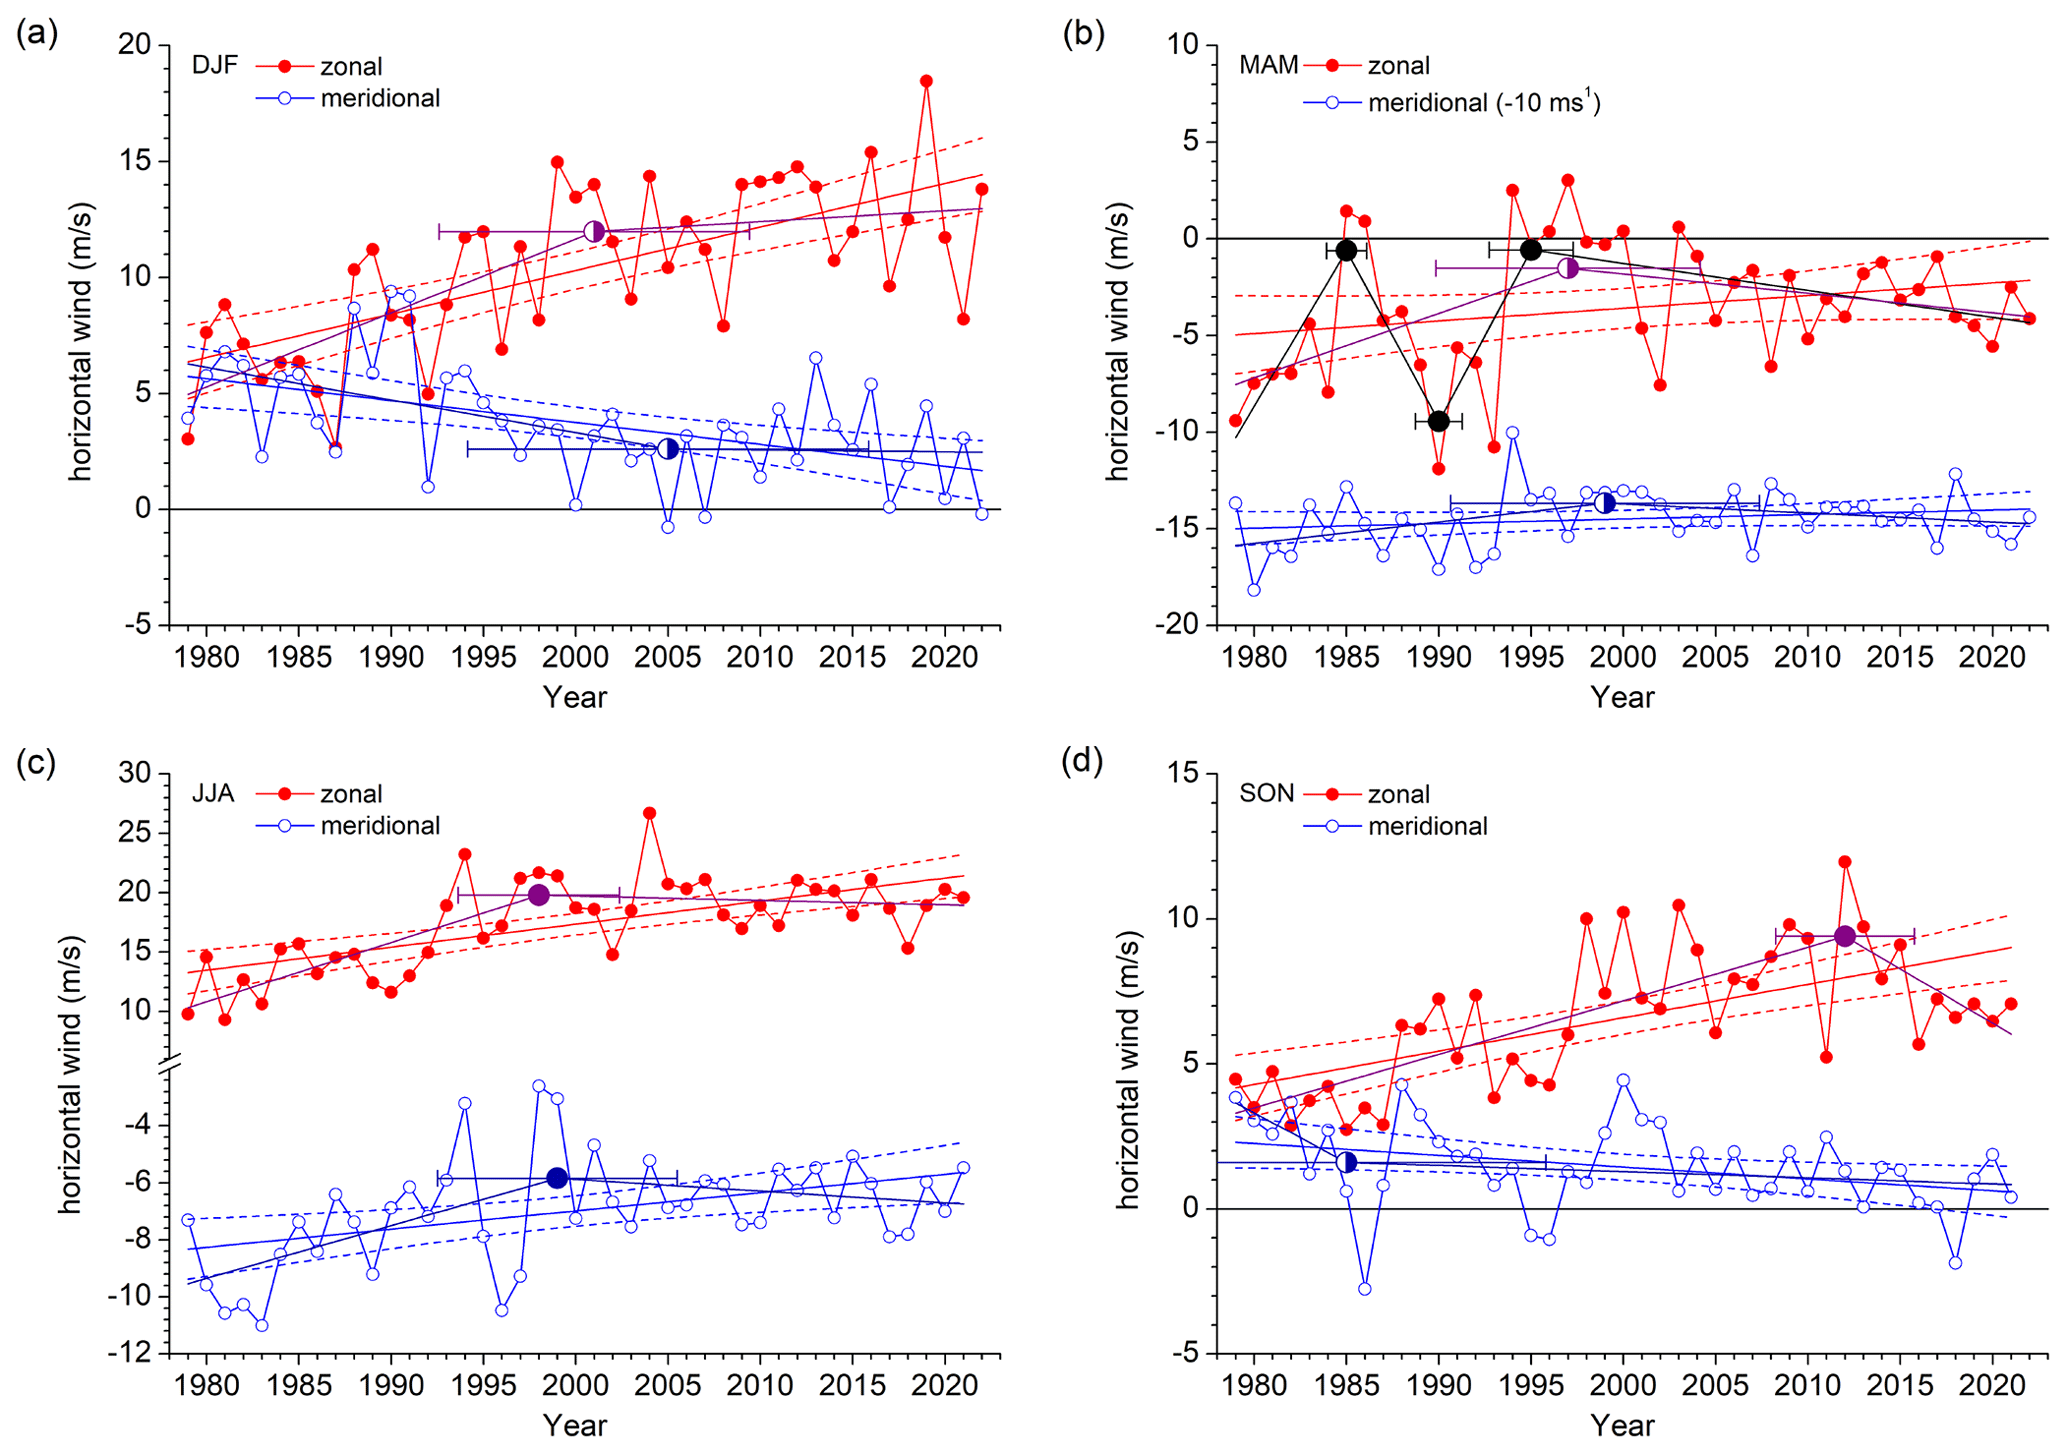
Figure 2Seasonal mean zonal (red) and meridional (blue) winds over Collm at about 90 km for (a) DJF, (b) MAM, (c) JJA, and (d) SON. Linear fits are added with their 95 % confidence intervals. Linear fits with a trend break are also added as purple (zonal wind) and royal blue (meridional wind) curves. Trend breaks are given as solid symbols, if they are indicated by the minimum BIC, otherwise they are half–filled. For MAM zonal winds, the minimum BIC refers to a curve with three breakpoints, which is also added. If no solid breakpoint symbol is given, the minimum BIC curve is the straight linear fit line.
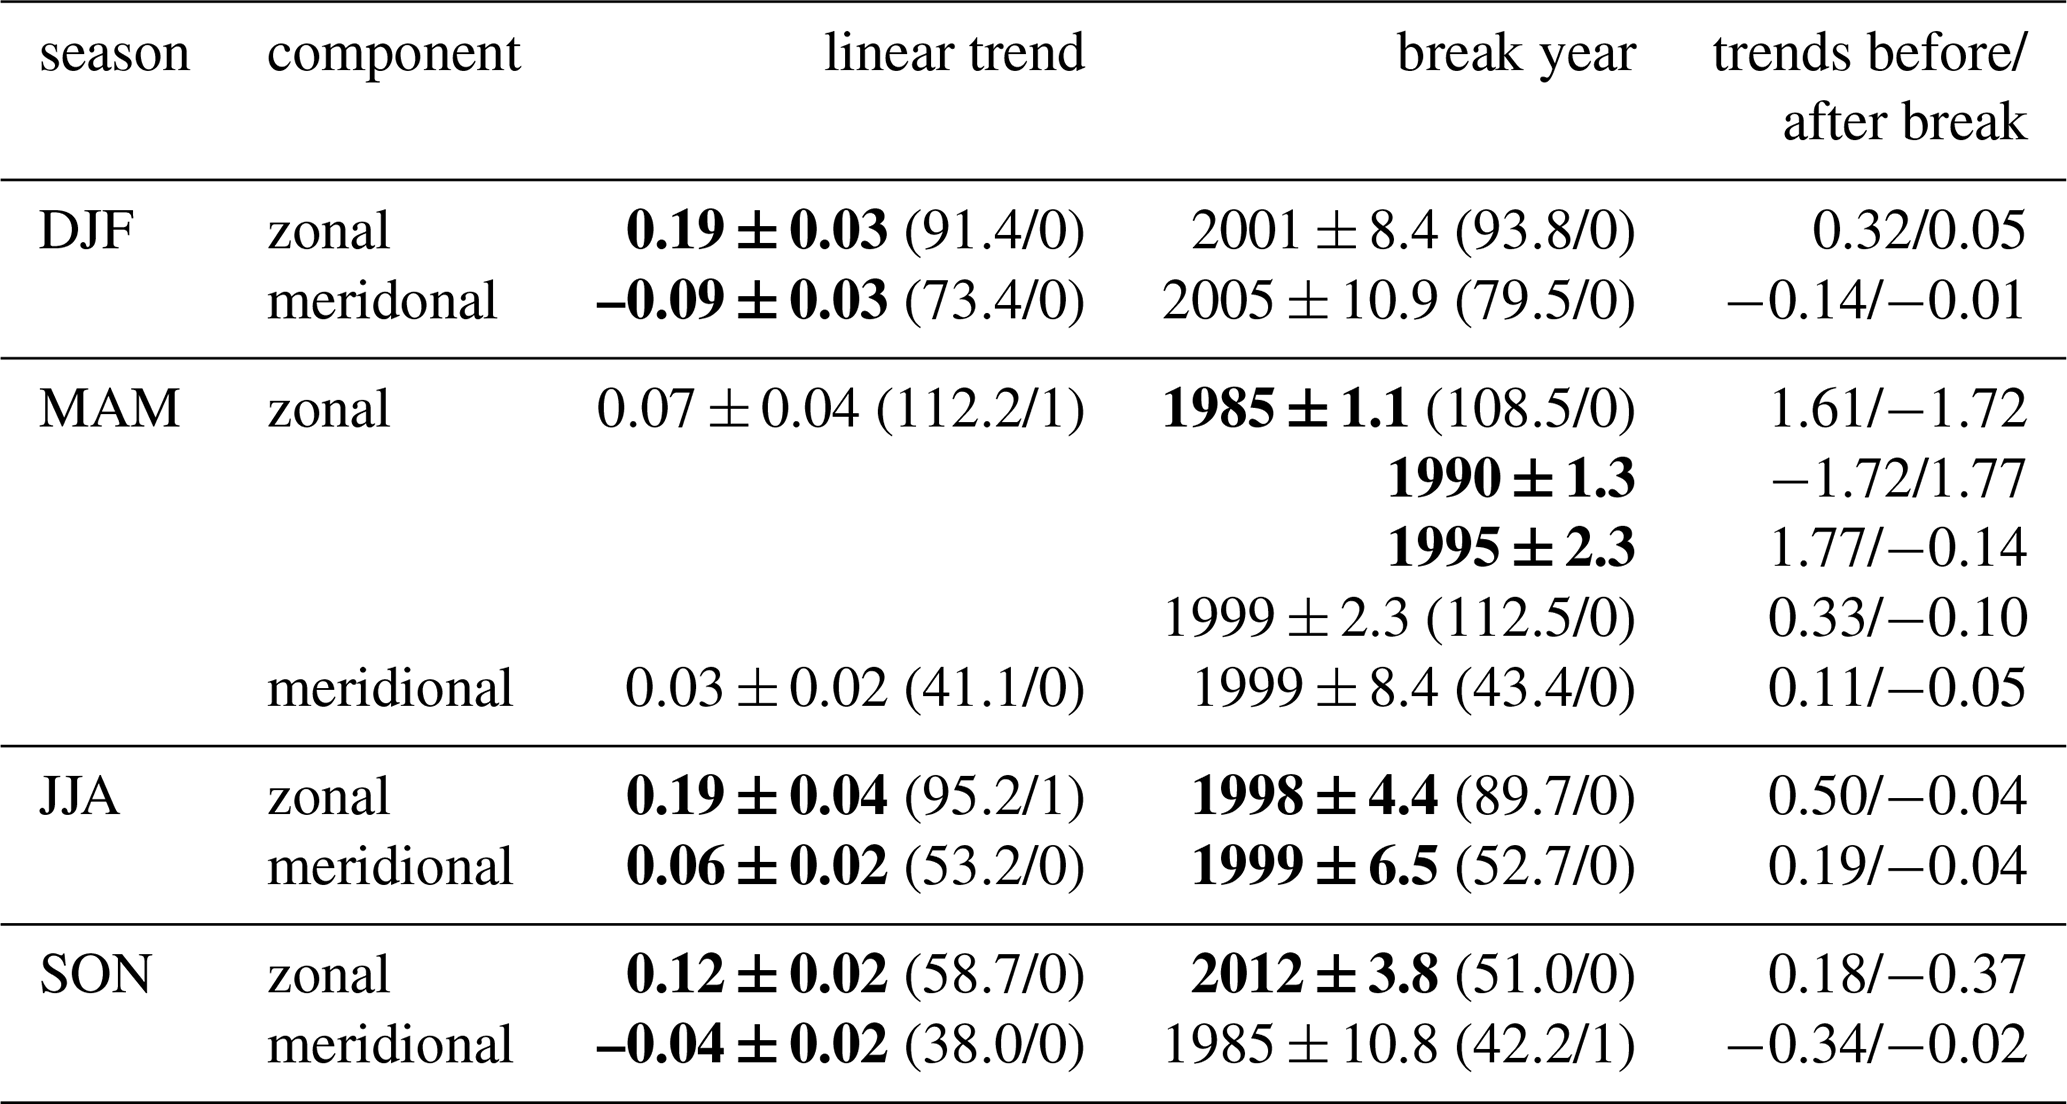
Table 1Linear trend coefficients (in m s−1 yr−1) and their standard errors of horizontal winds over Collm December 1978–May 2022. Significant trends at the 95 % level according to a t-test are given in bold. Also added are years of trend breaks with their standard deviation. Trend break years are given in bold if the fit results in minimum BIC. The respective BIC and order of the autoregression model are given in brackets. For MAM, the break year and BIC are also given for the solution with one breakpoint. The rightmost column shows the linear trends (in m s−1 yr−1) before and after the respective breakpoint.
Linear trends of zonal winds are positive throughout the year, although in spring they are not significant at the 95 % level according to a t-test. The positive trends indicate a strengthening of the westerly mesospheric jet in winter, and a strengthening of the lower thermospheric jet above the MLT wind reversal in summer as well. The meridional winds decrease in magnitude with time during all seasons, which results in a positive trend in summer. This behaviour is mostly similar to the one reported earlier from shorter intervals of Collm data (Jacobi et al., 2015; Qian et al., 2019). Note that Qian et al. (2019) used November–January means for winter, and had performed multiple regression analyses including a solar cycle effect, so that their linear trends differ, especially in winter, where the sign of the trend is different than reported here.
Note that in spring there is large variability in the first half of the observation period. This results in additional breakpoints. This may as well be considered as the signature of a quasi-decadal variation. Actually, during the 1980s and 1990s, the spring zonal winds over Collm are in anticorrelation with solar activity (Jacobi et al., 1997; Jacobi and Kürschner, 2006), but this possible solar cycle effect is not obviously visible in later years, and actually even seems to change its phase, so that there are maximum easterly winds around 1980 and 1990 (solar maximum), but weak easterly winds during the maximum of solar cycle 24 (2014). A quasi-decadal variation is most strongly expressed during May (see Fig. 5 below), but also visible in other seasons, especially in autumn.
Visual inspection of Fig. 2 and the analysis of breakpoints and linear trends before and after them (Table 1) also show that there is a tendency for a decrease in the long-term trend with time, i.e. a change to weaker or even reversed trends. The linear fits including breakpoints show that such a change is significant especially in summer and appears in the late 1990s. During winter, a change of trends is also visible near these dates, taking into account the uncertainty of the breakpoint detection, which is large due to the interannual variability of mean winds partly caused by stratospheric sudden warmings. However, for DJF the fit with one breakpoint is not the most probable solution according to BIC, but this would be a straight line in winter. Similar tendencies are visible for the meridional wind in spring, where a possible breakpoint is seen around the year 1999, but a pure linear trend is more probable. The long-term tendencies in autumn behave differently; there are indications for decreasing zonal winds in the 2nd decade of the 2000s together with strong westerly winds before 2015, which are also observed over Juliusruh (see Fig. 4d below). The reason for this interannual variability is currently not clear. This resulted in minimum BIC for the shown fit model, however, there are also model solutions which show changes in the late 1990s and not in the 2010s (not shown here) that, according to BIC, are even more probably than the pure linear fit. During all other seasons, zonal wind trends after 2000 are small and partly negative.
In this section, Collm and Juliusruh long-term wind changes are compared. However, owing to the different observations by LF/VHF and PR, the reference heights used here differ. Therefore, a direct comparison of winds is not performed here, but only winds at 90 and 83 km during 1990–2021 are presented and analysed with respect to their linear trends.
4.1 Seasonal cycles over Collm and Julisuruh
A comparison of the long-term mean seasonal cycle of horizontal winds over Collm and Juliusruh is given in Fig. 3. Here we present data of the years 1990–2021. As in Fig. 1 the zonal winds (left panel) are westerly during winter over both sites. The winter winds very closely agree with each other, which is due to the small vertical wind gradient then (see Fig. 1). In summer, the Juliusruh winds are easterly. Connected with the very strong positive zonal wind shear (Fig.1), however, westerly (positive) zonal winds are visible at 90 km over Collm. The slight latitudinal difference also contributes to this feature, because the easterly summer wind jet extends to greater heights at higher latitudes (e.g., Jaen et al., 2022).
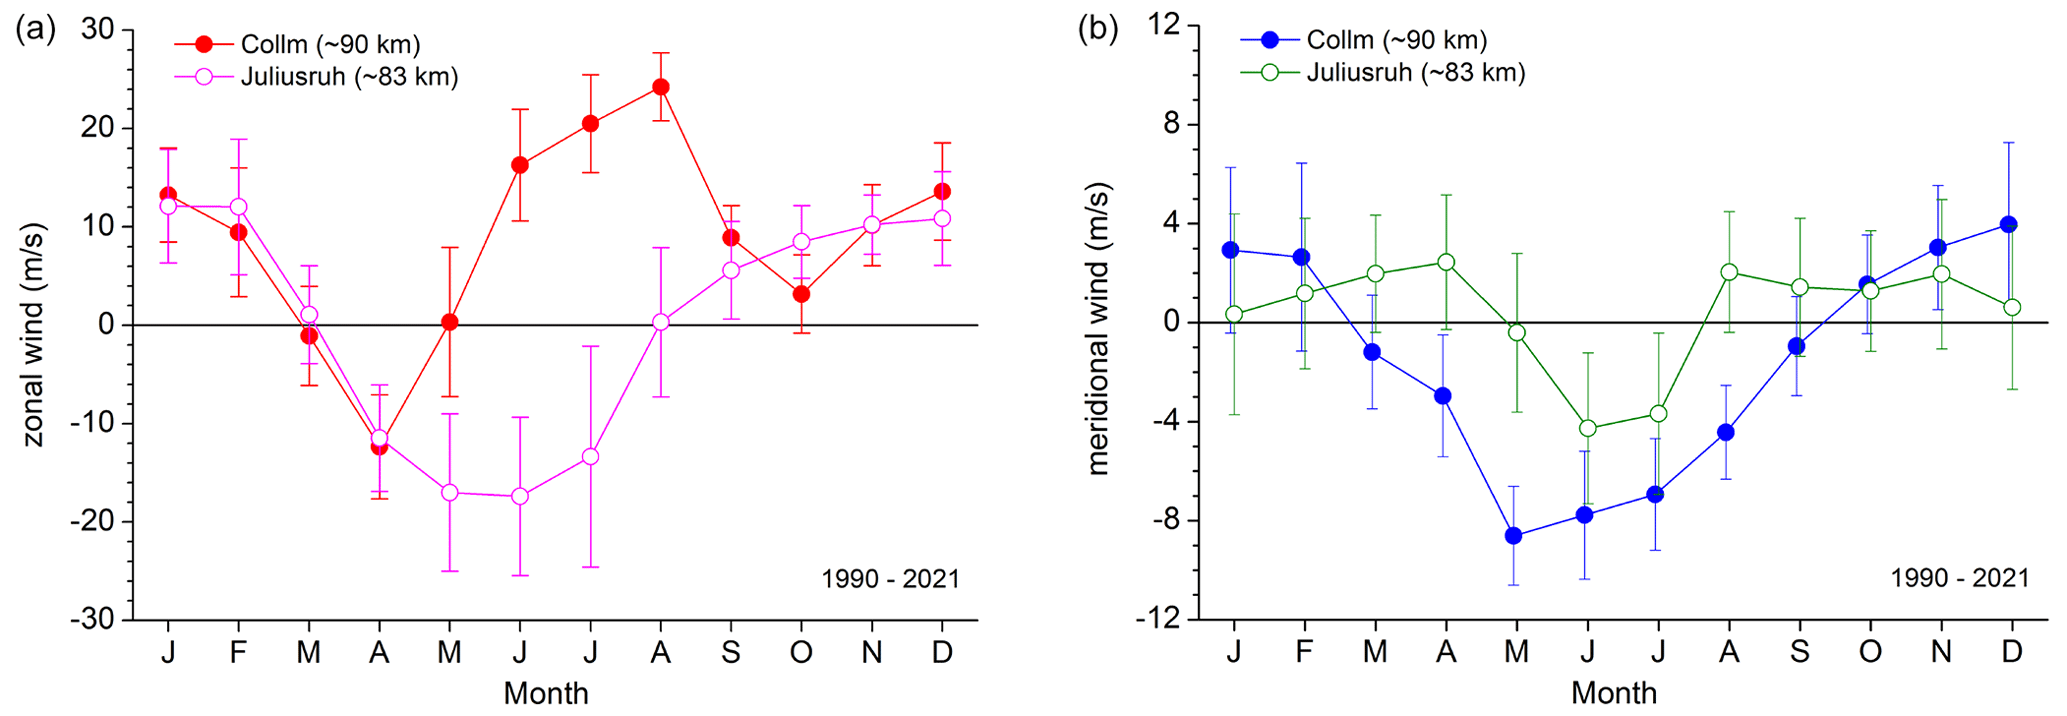
Figure 31990–2021 mean monthly mean zonal (a) and meridional (b) winds over Collm at about 90 km and Juliusruh at 81–85 km. Error bars show standard deviations based on the monthly means of each year.
The meridional winds are weaker than the zonal ones. Over Collm, a clear seasonal cycle is visible, with equatorward (southward) winds in summer, and weak poleward (northward) winds in winter. But over Juliusruh, at lower altitudes, the meridional winds do not show such a clear seasonal cycle. An equatorward maximum is visible in June/July but it is weaker than over Collm at higher altitudes. Again, in winter the winds over Collm and Juliusruh differ less strongly than in summer, but still the winter meridional wind magnitudes over Juliusruh are smaller than those over Collm. The differences are clearly an effect of the different altitudes considered since meridional winds are owing to gravity wave mean flow interaction, which is strongly height dependent (e.g., Yiğit and Medvedev, 2015; Lilienthal et al., 2020).
4.2 Comparison of trends over Collm and Julisuruh
Figure 4 shows zonal and meridional wind time series at Collm and Juliusruh, respectively, for four seasons. Linear fits are added based on the data from 1990–2021. The trend coefficients, their standard errors and their confidence intervals (in brackets) are given in Table 2. The Collm winds, respectively, represent part of the dataset that has been shown in Fig. 2. Comparing the Collm trends derived from the full dataset in Table 1 with those after 1990 (Table 2), it is clear that the trends become weaker and mostly insignificant. After the breakpoint, wind trends either become very weak, or reverse (Fig. 2 and Table 1). Thus, the 43 year trends over Collm are mainly caused by the very strong trends in the first half of the dataset and become smaller when one decade of observations in this first half is disregarded. We do not show linear trends with possible breakpoints as the analysis is only performed for the time after 1990, so that breakpoints, if any, would be expected close to the beginning of the time series.
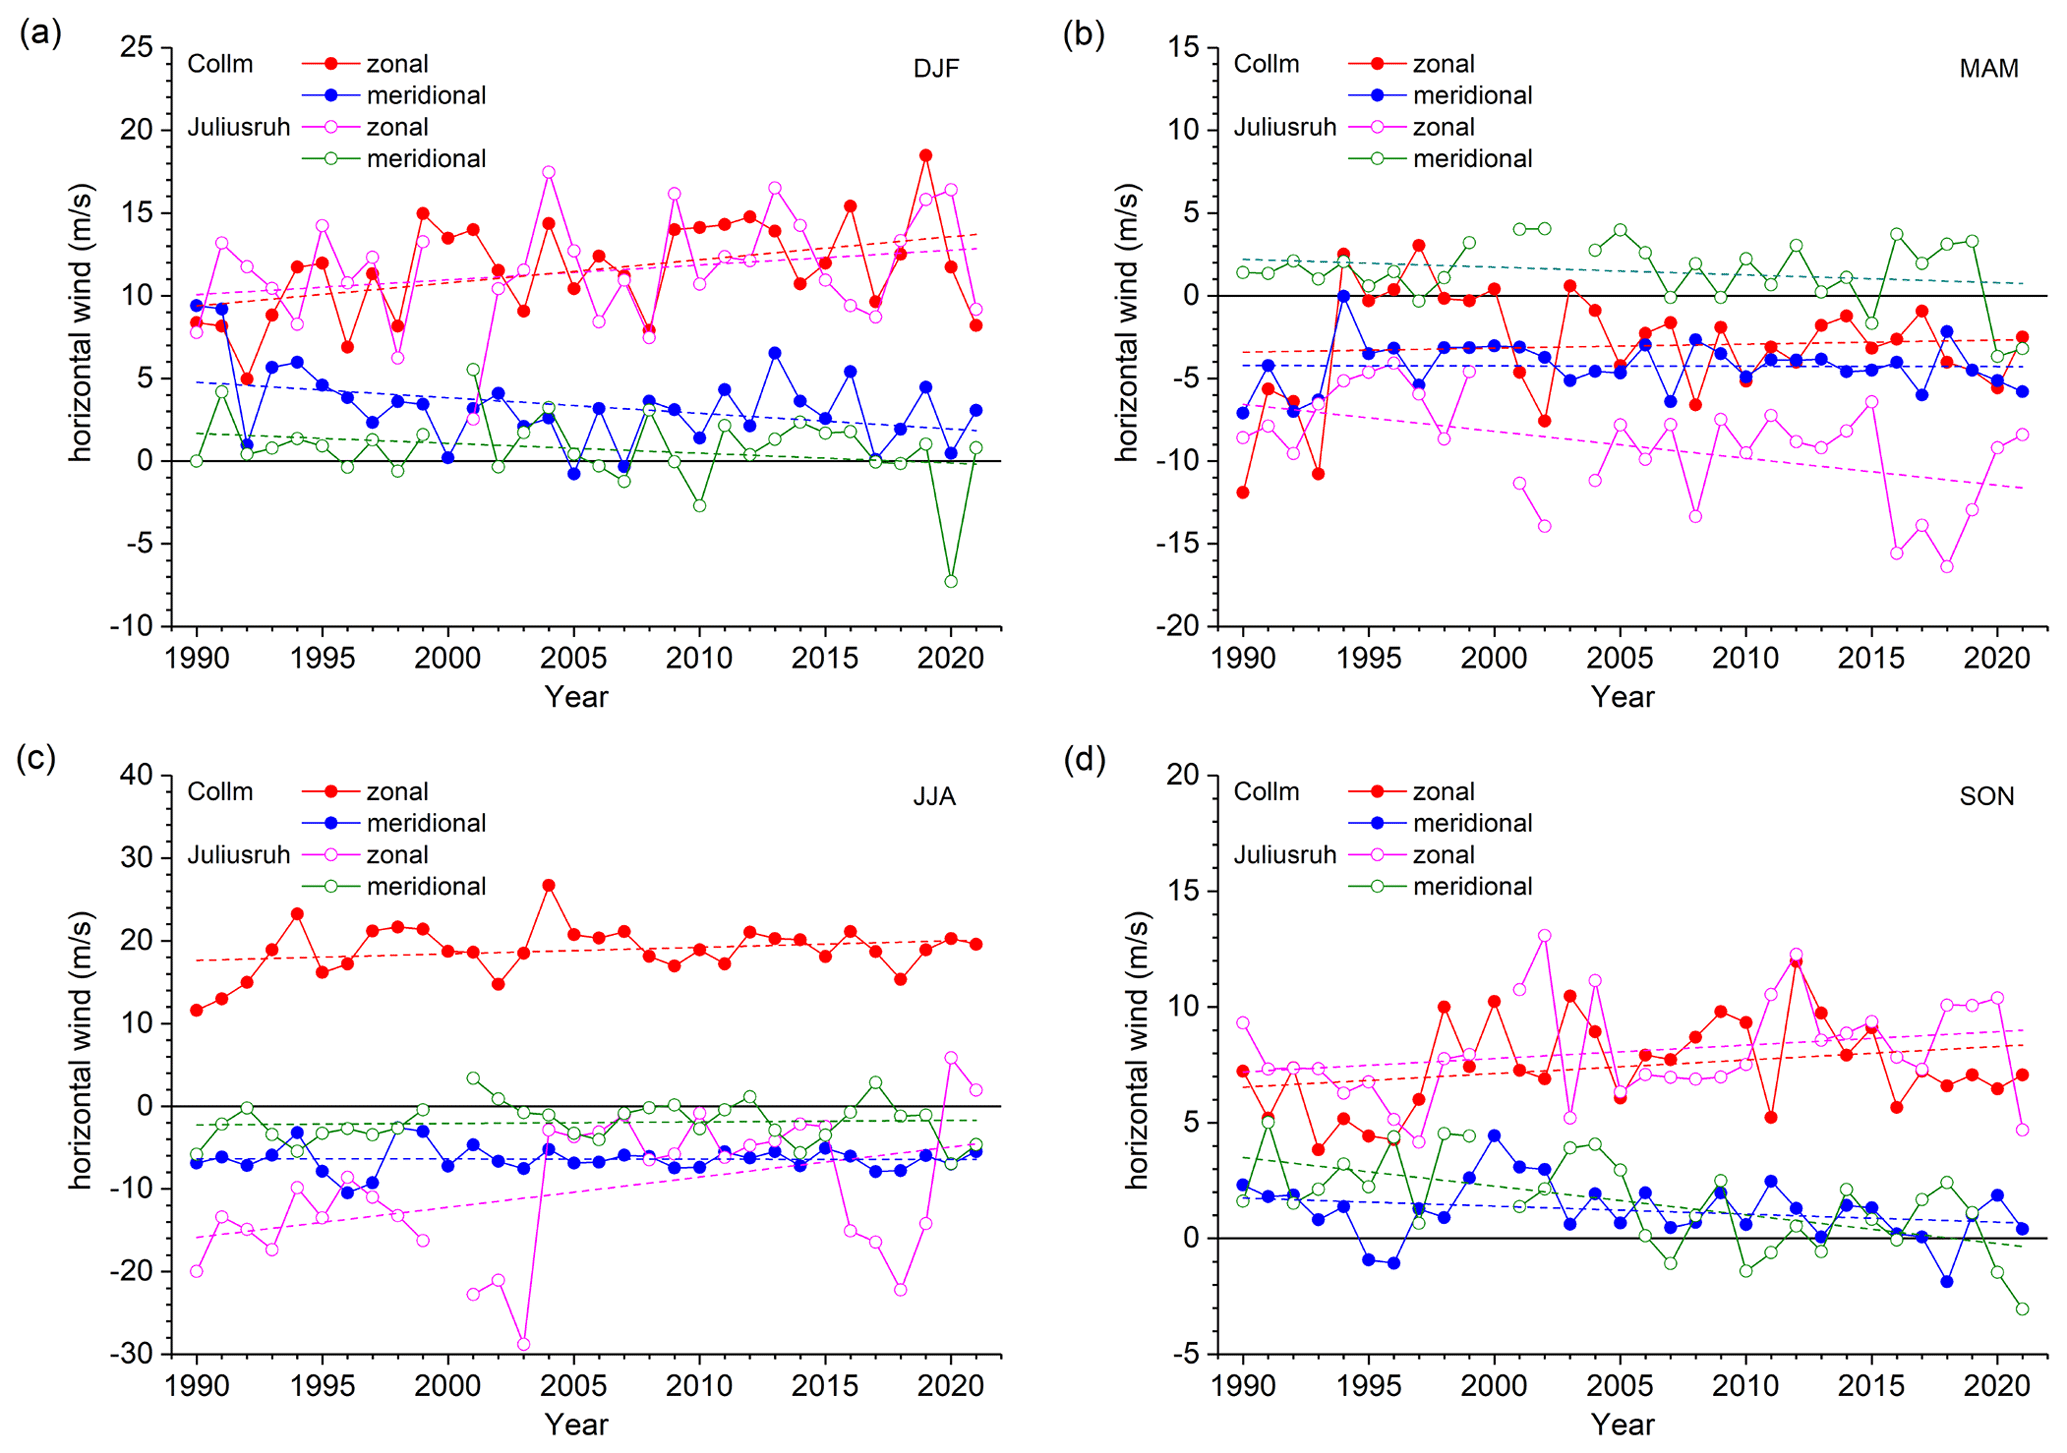
Figure 4Seasonal mean zonal and meridional winds over Collm at about 90 km and Juliusruh at 81–85 km for (a) DJF, (b) MAM, (c) JJA, and (d) SON.
Table 2Linear trends and their standard errors of seasonal mean horizontal winds over Collm and Juliusruh. For spring, the March/April mean and May winds are given separatly as well. 95 % confidence intervals are given in brackets. Values are given in m s−1 yr−1. Significant trends at the 95 % level according to a t-test are given in bold.
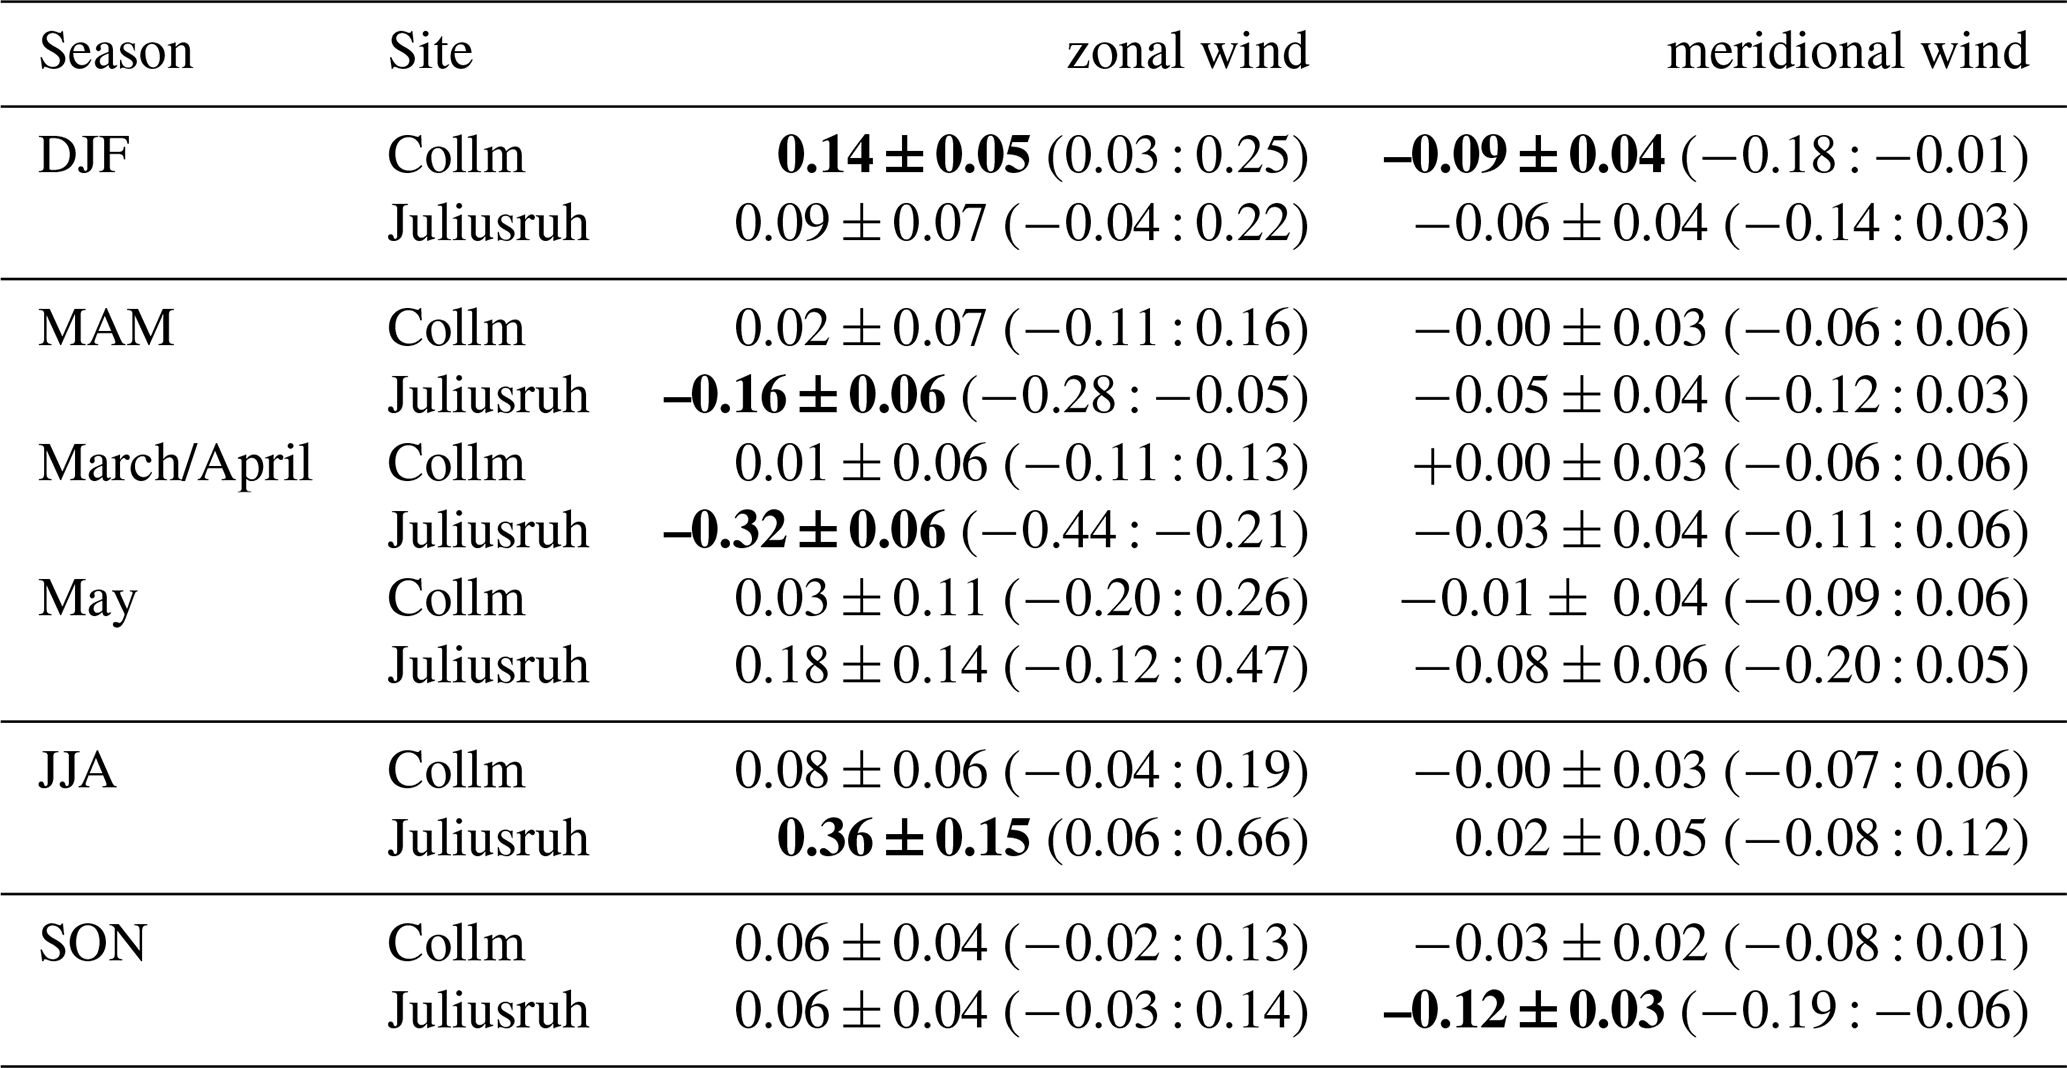
In DJF the zonal wind trends are positive, i.e. towards stronger westerly winds over both sites. Due to the small vertical (see Fig. 1) and meridional gradients (Jacobi et al., 2019) during DJF, the mean values are very close to each other. The trend is slightly weaker over Juliusruh, so it is not statistically significant. Interannual variability is in the same order of magnitude over both sites, however, maximums and minimums do not always correspond to each other. The meridional winds decrease over both sites, although the linear trend for Juliusruh is weaker and not statistically significant at the 95 % level.
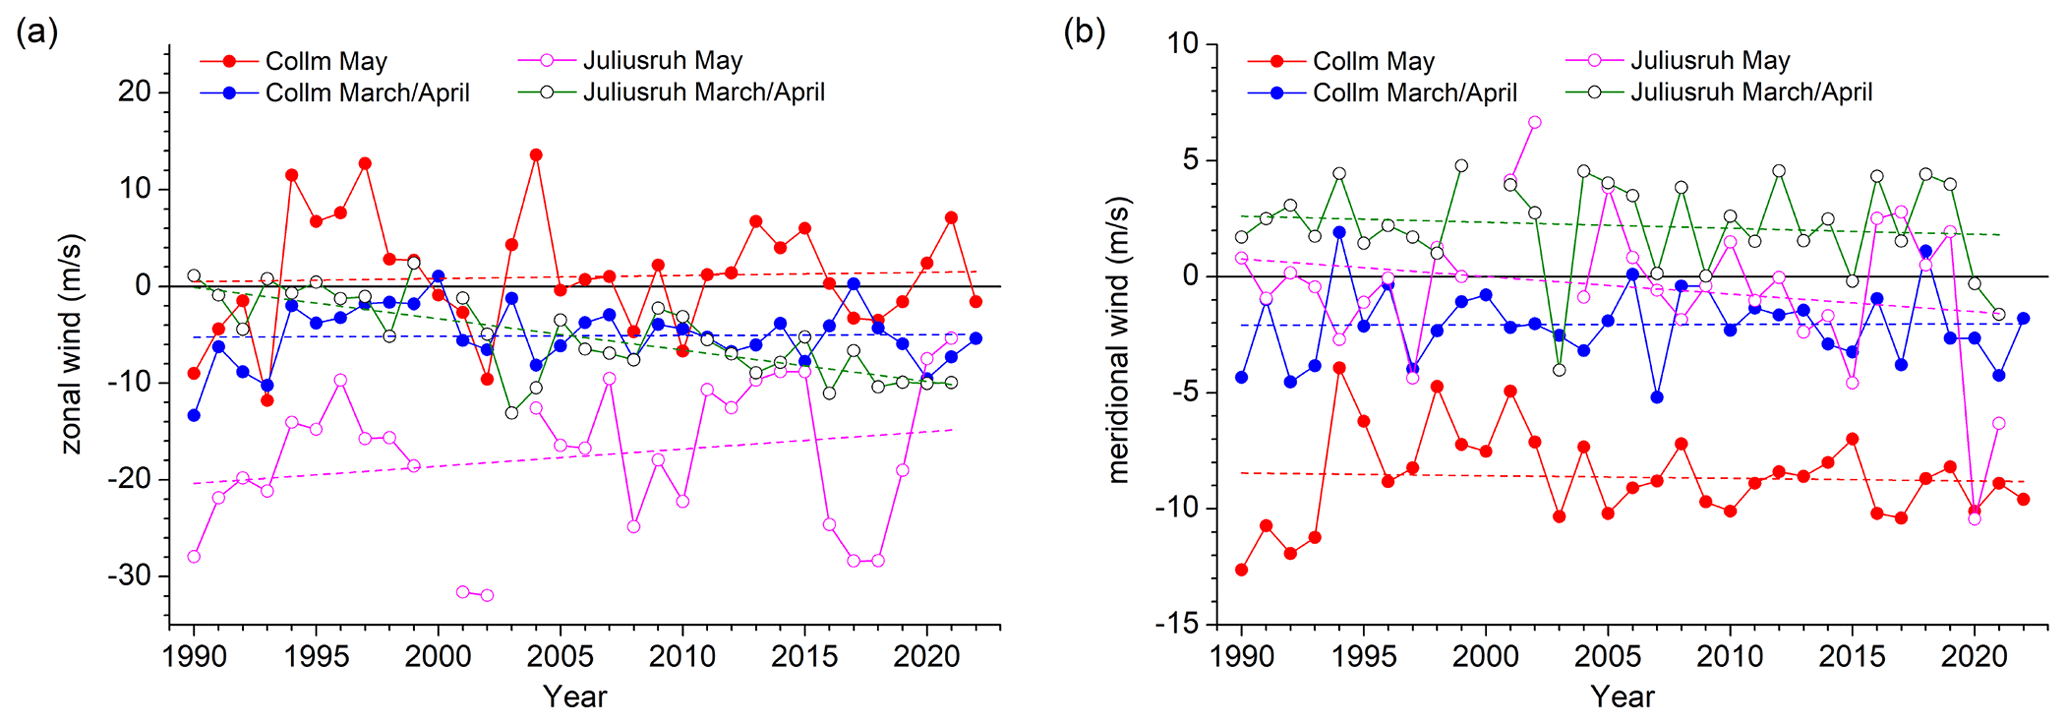
Figure 5Bimonthly and monthly mean (a) zonal and (b) meridional winds over Collm at about 90 km and Juliusruh at 81–85 km for March/April and May.
During spring (MAM) there is considerable interannual variability of zonal winds over both sites. Moreover, while during March and April the long-term mean zonal winds are similar over both sites, this is not the case for May with its summer onset (see Fig. 3). Consequently, there are also different long-term trends over the two sites for the zonal wind. We show March/April and May mean winds separately in Fig. 5 with the trend coefficients are also shown in Table 2. Over Juliusruh, the zonal wind trend is negative, while it is negligible over Collm. Note that the latter is due to strongly negative wind values over Collm in the early 1990s and the breakpoint in 1995 (see Table 1), and if the linear trend is calculated from 1995–2021 it becomes negative with the trend at Collm becoming comparable to the Juliusruh one. The Collm zonal wind trends during March/April and May are similar (Fig. 5) however, the May winds are more variable than the March/April ones so that the strong quasi-decadal variability in MAM zonal winds is mainly due to May wind variability, and not owing to winter final stratospheric warming variations. During May, the transition from spring to summer takes place, with the lower thermosphere change to westerlies owing to gravity wave action. There is a strong acceleration of the zonal wind on the order of 20 m s−1 per month (see Fig. 1) in May, and a delay in summer beginning (SB) would already have large impact on the May winds. Jaen et al. (2022) shows that the SB may vary by a period on the order of 10 d, which, given the seasonal cycle, lead to a change of 5–10 m s−1 for mean May zonal winds. Note that the large decadal/interdecadal variability over both sites at both heights is similar, and the May zonal winds over Collm and Juliusruh are positively correlated with a correlation coefficient of r=0.7.
The meridional wind trends over Collm and Juliusruh are both negative, but insignificant in MAM, and the trend at Collm is extremely weak. This is also the case for March/April and May regarded separately (Fig. 5) .
Summer zonal wind trends are positive at both sites (Fig. 4c and Table 2), which means a weakening of the easterly mesospheric jet but a strengthening of the lower thermospheric westerlies. The meridional wind trends are small at both sites. The positive linear trend over Collm seen in Fig. 2 is due to strong changes in the 1980s and early 1990s, but not to trends in later years.
Autumn (SON) long-term changes qualitatively agree with winter ones. Thus, zonal wind trends are positive, while meridional wind trends are negative. This is true for both Collm and Juliusruh. There is a considerable interannual variability, so linear trends are not significant except for the meridional winds over Juliusruh.
The radar MLT wind time series obtained at Juliusruh and Collm range among the longest ones worldwide, so the analysis of their interannual and long-term variability may provide insight into possible effects of climate change on the MLT. Here, we show long-term trends and possible changes in trends over Collm, and compare the long-term linear trends over both sites. Owing to the different observation methods the considered heights differ by several kilometres. Consequently, the summer climatological mean zonal winds are different: while the Juliusruh observations at about 83 km show the upper part of the mesospheric easterlies, the Collm LF/VHF measurements fall into the lower thermospheric westerly jet. During winter, the vertical zonal wind gradient is smaller, and the differences between the two sites are smaller, too.
Long-term trends over Collm and Juliusruh agree qualitatively (in terms of sign), in particular in SON and DJF, but also for JJA, notwithstanding the climatological difference in mean winds. Differences in trends are found for MAM. This may be partly due to a possible trend change in the 1990s, and the strong wind shear in the summer half year, which at least includes May also.
Based on Collm winds, there are indications for a trend change in the late 1990s, which is especially prominent in summer. During winter, although the most probable solution for linear fits is a straight line then, a possible trend change is also visible. Such a change, possibly connected with the ozone turnaround after 1995 or lower atmosphere climate change, has been reported earlier (Jacobi et al., 2015). The update of the Collm time series presented here shows that the wind tendencies after the late 1990s, which mainly show a decrease or even a reversal of the trends before that time, continued during the recent years.
The comparison of Collm and Juliusruh winds in Fig. 4 also shows a considerable variability at time scales of a few years, although the year-to-year variability at the two sites is partly different. Possible mechanisms for such kind of variability may be the influence of lower/middle atmosphere circulation patterns like QBO, NAO, and ENSO. These patterns have been shown to possibly influence the middle atmosphere winds up to the mesosphere (Jacobi and Beckmann, 1999; Sridharan et al., 2010; Ermakova et al., 2019; Koval et al., 2022), but their effect decreases or reverses, respectively, near the mesopause region. The height difference of the wind time series analysed here therefore may be a reason for the different variability at these time scales. The effect of lower atmosphere variability on the MLT therefore should be analysed in more detail in the future, including numerical modelling.
In the literature, a possible solar cycle effect on mean MLT winds has frequently been proposed (Sprenger and Schminder, 1967; Jacobi et al., 1997; Qian et al., 2019). Such a solar cycle may influence trend analyses, if not adequately taken into account (Laštovička et al., 2012; Laštovička and Jelínek, 2019). There are indications that there is a quasi-decadal variability of winds present in the MLT, but on the other hand it seems that this effect is not stable and changes with time. However, given that a solar effect on winds may be quite variable with location and season, and taking into account that at least some of the linear trend estimates change when including solar activity, further analyses are required to carefully analyse the solar activity effect on MLT winds, including its possible modulation with time.
The trend break detection software is available on request by Christoph Jacobi as Fortran-90 code.
Collm wind data are available on request by Christoph Jacobi. Juliusruh wind data are available on request by Toralf Renkwitz (renkwitz@iap-kborn.de).
CJ initiated the study, provided the Collm wind data and prepared the first draft of the paper. AK contributed to the trend analysis. TR and JJ provided the Juliusruh wind data. All authors actively contributed to the writing of the final version.
The contact author has declared that none of the authors has any competing interests.
Publisher’s note: Copernicus Publications remains neutral with regard to jurisdictional claims in published maps and institutional affiliations.
This article is part of the special issue “Kleinheubacher Berichte 2022”. It is a result of the Kleinheubacher Tagung 2022, Miltenberg, Germany, 27–29 September 2022.
This research has been supported by the Deutsche Forschungsgemeinschaft (grant nos. PO 2341/2-1 and JA 836/43-1) and the Bundesministerium für Bildung und Forschung (grant no. 01LG 1902A.).
This paper was edited by Ralph Latteck and reviewed by two anonymous referees.
Akmaev, R.: Modeling the cooling due to CO2 increases in the mesosphere and lower thermosphere, Phys. Chem. Earth A/B/C, 27, 521–528, https://doi.org/10.1016/S1474-7065(02)00033-5, 2002. a
Beig, G.: Long-term trends in the temperature of the mesosphere/lower thermosphere region: 2. Solar response, J. Geophys. Res.-Space, 116, A00H12, https://doi.org/10.1029/2011JA016766, 2011. a
Beig, G., Keckhut, P., Lowe, R. P., Roble, R. G., Mlynczak, M. G., Scheer, J., Fomichev, V. I., Offermann, D., French, W. J. R., Shepherd, M. G., Semenov, A. I., Remsberg, E. E., She, C. Y., Lübken, F. J., Bremer, J., Clemesha, B. R., Stegman, J., Sigernes, F., and Fadnavis, S.: Review of mesospheric temperature trends, Rev. Geophys., 41, 1015, https://doi.org/10.1029/2002RG000121, 2003. a
Bremer, J.: Long-term trends in the ionospheric E and F1 regions, Ann. Geophys., 26, 1189–1197, https://doi.org/10.5194/angeo-26-1189-2008, 2008. a
Bremer, J. and Berger, U.: Mesospheric temperature trends derived from ground-based LF phase-height observations at mid-latitudes: comparison with model simulations, J. Atmos. Sol.-Terr. Phys., 64, 805–816, https://doi.org/10.1016/S1364-6826(02)00073-1, 2002. a, b
Bremer, J., Schminder, R., Greisiger, K., Hoffmann, P., Kürschner, D., and Singer, W.: Solar cycle dependence and long-term trends in the wind field of the mesosphere/lower thermosphere, J. Atmos. Sol.-Terr. Phys., 59, 497–509, https://doi.org/10.1016/S1364-6826(96)00032-6, 1997. a
Charlton, A. J. and Polvani, L. M.: A new look at stratospheric sudden warmings. Part I: Climatology and modeling benchmarks, J. Climate, 20, 449–469, https://doi.org/10.1175/JCLI3996.1, 2007. a
Emmert, J. T.: Altitude and solar activity dependence of 1967–2005 thermospheric density trends derived from orbital drag, J. Geophys. Res.-Space, 120, 2940–2950, https://doi.org/10.1002/2015JA021047, 2015. a
Emmert, J. T., Picone, J. M., and Meier, R. R.: Thermospheric global average density trends, 1967–2007, derived from orbits of 5000 near-Earth objects, Geophys. Res. Lett., 35, L05101, https://doi.org/10.1029/2007GL032809, 2008. a
Ermakova, T. S., Aniskina, O. G., Statnaia, I. A., Motsakov, M. A., and Pogoreltsev, A. I.: Simulation of the ENSO influence on the extra-tropical middle atmosphere, Earth Planets Space, 71, 8, https://doi.org/10.1186/s40623-019-0987-9, 2019. a
Hoffmann, P., Singer, W., Keuer, D., Hocking, W., Kunze, M., and Murayama, Y.: Latitudinal and longitudinal variability of mesospheric winds and temperatures during stratospheric warming events, J. Atmos. Sol.-Terr. Phys., 69, 2355–2366, https://doi.org/10.1016/j.jastp.2007.06.010, 2007. a
Hoffmann, P., Becker, E., Singer, W., and Placke, M.: Seasonal variation of mesospheric waves at northern middle and high latitudes, J. Atmos. Sol.-Terr. Phys., 72, 1068–1079, https://doi.org/10.1016/j.jastp.2010.07.002, 2010. a
Hoffmann, P., Rapp, M., Singer, W., and Keuer, D.: Trends of mesospheric gravity waves at northern middle latitudes during summer, J. Geophys. Res.-Atmos., 116, D00P08, https://doi.org/10.1029/2011JD015717, 2011. a, b
Jacobi, C.: Meteor radar measurements of mean winds and tides over Collm (51.3∘ N, 13∘ E) and comparison with LF drift measurements 2005–2007, Adv. Radio Sci., 9, 335–341, https://doi.org/10.5194/ars-9-335-2011, 2011. a
Jacobi, C. and Beckmann, B.: On the connection between upper atmospheric dynamics and tropospheric parameters: Correlations between mesopause region winds and the North Atlantic Oscillation, Climatic Change, 43, 629–643, https://doi.org/10.1023/A:1005451227975, 1999. a
Jacobi, C. and Kürschner, D.: Long-term trends of MLT region winds over Central Europe, Phys. Chem. Earth A/B/C, 31, 16–21, https://doi.org/10.1016/j.pce.2005.01.004, 2006. a, b, c
Jacobi, C., Schminder, R., Kürschner, D., Bremer, J., Greisiger, K., Hoffmann, P., and Singer, W.: Long-term trends in the mesopause wind field obtained from LF D1 wind measurements at Collm, Germany, Adv. Space Res., 20, 2085–2088, https://doi.org/10.1016/S0273-1177(97)00599-1, 1997. a, b, c, d, e
Jacobi, C., Fröhlich, K., Viehweg, C., Stober, G., and Kürschner, D.: Midlatitude mesosphere/lower thermosphere meridional winds and temperatures measured with meteor radar, Adv. Space Res., 39, 1278–1283, https://doi.org/10.1016/j.asr.2007.01.003, 2007. a
Jacobi, C., Hoffmann, P., and Kürschner, D.: Trends in MLT region winds and planetary waves, Collm (52∘ N, 15∘ E), Ann. Geophys., 26, 1221–1232, https://doi.org/10.5194/angeo-26-1221-2008, 2008. a
Jacobi, C., Arras, C., Kürschner, D., Singer, W., Hoffmann, P., and Keuer, D.: Comparison of mesopause region meteor radar winds, medium frequency radar winds and low frequency drifts over Germany, Adv. Space Res., 43, 247–252, https://doi.org/10.1016/j.asr.2008.05.009, 2009a. a, b
Jacobi, C., Hoffmann, P., Liu, R., Križan, P., Laštovička, J., Merzlyakov, E., Solovjova, T., and Portnyagin, Y.: Midlatitude mesopause region winds and waves and comparison with stratospheric variability, J. Atmos. Sol.-Terr. Phys., 71, 1540–1546, https://doi.org/10.1016/j.jastp.2009.05.004, 2009b. a
Jacobi, C., Lilienthal, F., Geißler, C., and Krug, A.: Long-term variability of mid-latitude mesosphere-lower thermosphere winds over Collm (51∘ N, 13∘ E), J. Atmos. Sol.-Terr. Phys., 136, 174–186, https://doi.org/10.1016/j.jastp.2015.05.006, 2015. a, b, c, d, e, f, g
Jacobi, C., Lilienthal, F., Stober, G., Korotyshkin, D., and Merzlyakov, E.: Mesosphere/lower thermosphere winds measured with nearby SKiYMET meteor radars at Collm and Juliusruh, and comparison with Kazan winds, 2019 Kleinheubach Conference, 23–25 September 2019, Miltenberg, Germany, IEEE, https://ieeexplore.ieee.org/document/8890153 (last access: 15 December 2022), 2019. a
Jaen, J., Renkwitz, T., Chau, J. L., He, M., Hoffmann, P., Yamazaki, Y., Jacobi, C., Tsutsumi, M., Matthias, V., and Hall, C.: Long-term studies of mesosphere and lower-thermosphere summer length definitions based on mean zonal wind features observed for more than one solar cycle at middle and high latitudes in the Northern Hemisphere, Ann. Geophys., 40, 23–35, https://doi.org/10.5194/angeo-40-23-2022, 2022. a, b, c
Jakowski, N., Hoque, M., Mielich, J., and Hall, C.: Equivalent slab thickness of the ionosphere over Europe as an indicator of long-term temperature changes in the thermosphere, J. Atmos. Sol.-Terr. Phys., 163, 91–102, https://doi.org/10.1016/j.jastp.2017.04.008, 2017. a
Kashcheyev, B. and Oleynikov, A.: Dynamic regime of the mesopause–lower thermosphere at mid-latitudes of the northern hemisphere by radio meteor observations, J. Atmos. Sol.-Terr. Phys., 56, 1197–1207, https://doi.org/10.1016/0021-9169(94)90057-4, 1994. a
Keuer, D., Hoffmann, P., Singer, W., and Bremer, J.: Long-term variations of the mesospheric wind field at mid-latitudes, Ann. Geophys., 25, 1779–1790, https://doi.org/10.5194/angeo-25-1779-2007, 2007. a, b
Koval, A. V., Gavrilov, N. M., Pogoreltsev, A. I., and Kandieva, K. K.: Dynamical impacts of stratospheric QBO on the global circulation up to the lower thermosphere, J. Geophys. Res.-Atmos., 127, e2021JD036095, https://doi.org/10.1029/2021JD036095, 2022. a
Kürschner, D. and Jacobi, C.: Quasi-biennial and decadal variability obtained from long-term measurements of nighttime radio wave reflection heights over Central Europe, Adv. Space Res., 32, 1701–1706, https://doi.org/10.1016/S0273-1177(03)90465-0, 2003. a
Kürschner, D. and Schminder, R.: High-atmosphere wind profiles for altitudes between 90 and 110 km obtained from D1 LF measurements over Central Europe in 1983/1984, J. Atmos. Sol.-Terr. Phys., 48, 447–453, https://doi.org/10.1016/0021-9169(86)90121-2, 1986. a
Kürschner, D., Schminder, R., Singer, W., and Bremer, J.: Ein neues Verfahren zur Realisierung absoluter Reflexionshöhenmessungen an Raumwellen amplitudenmodulierter Rundfunksender bei Schrägeinfall im Langwellenbereich als Hilfsmittel zur Ableitung von Windprofilen in der oberen Mesopausenregion, Z. Meteorol., 37, 322–332, 1987. a
Laštovička, J. and Jelínek, Š.: Problems in calculating long-term trends in the upper atmosphere, J. Atmos. Sol.-Terr. Phys., 189, 80–86, https://doi.org/10.1016/j.jastp.2019.04.011, 2019. a
Laštovička, J., Akmaev, R. A., Beig, G., Bremer, J., and Emmert, J. T.: Global Change in the Upper Atmosphere, Science, 314, 1253–1254, https://doi.org/10.1126/science.1135134, 2006. a
Laštovička, J., Akmaev, R. A., Beig, G., Bremer, J., Emmert, J. T., Jacobi, C., Jarvis, M. J., Nedoluha, G., Portnyagin, Yu. I., and Ulich, T.: Emerging pattern of global change in the upper atmosphere and ionosphere, Ann. Geophys., 26, 1255–1268, https://doi.org/10.5194/angeo-26-1255-2008, 2008. a
Laštovička, J., Solomon, S. C., and Qian, L.: Trends in the neutral and ionized upper atmosphere, Space Sci. Rev., 168, 113–145, https://doi.org/10.1007/s11214-011-9799-3, 2012. a
Lilienthal, F., Yiğit, E., Samtleben, N., and Jacobi, C.: Variability of gravity wave effects on the zonal mean circulation and migrating terdiurnal tide as studied with the Middle and Upper Atmosphere Model (MUAM2019) using a nonlinear gravity wave scheme, Front. Astron. Space Sci., 7, 588956, https://doi.org/10.3389/fspas.2020.588956, 2020. a
Lima, L., Araújo, L., Alves, E., Batista, P., and Clemesha, B.: Variations in meteor heights at 22.7∘ S during solar cycle 23, J. Atmos. Sol.-Terr. Phys., 133, 139–144, https://doi.org/10.1016/j.jastp.2015.08.015, 2015. a
Liu, H., Tao, C., Jin, H., and Nakamoto, Y.: Circulation and tides in a cooler upper atmosphere: dynamical effects of CO2 doubling, Geophys. Res. Lett., 47, e2020GL087413, https://doi.org/10.1029/2020GL087413, 2020. a
Liu, H., Tao, C., Jin, H., and Abe, T.: Geomagnetic activity effects on CO2-driven trend in the thermosphere and ionosphere: ideal model experiments with GAIA, J. Geophys. Res.-Space, 126, e2020JA028607, https://doi.org/10.1029/2020JA028607, 2021. a
Liu, L., Liu, H., Chen, Y., Le, H., Sun, Y.-Y., Ning, B., Hu, L., and Wan, W.: Variations of the meteor echo heights at Beijing and Mohe, China, J. Geophys. Res.-Space, 122, 1117–1127, https://doi.org/10.1002/2016JA023448, 2017. a
Liu, R. Q., Jacobi, C., Hoffmann, P., Stober, G., and Merzlyakov, E. G.: A piecewise linear model for detecting climatic trends and their structural changes with application to mesosphere/lower thermosphere winds over Collm, Germany, J. Geophys. Res.-Atmos., 115, 588956, https://doi.org/10.1029/2010JD014080, 2010. a
Lübken, F.-J., Berger, U., and Baumgarten, G.: Temperature trends in the midlatitude summer mesosphere, J. Geophys. Res.-Atmos., 118, 13347–13360, https://doi.org/10.1002/2013JD020576, 2013. a
Manson, A. and Meek, C.: Winds and tidal oscillations in the upper middle atmosphere at Saskatoon (52∘ N, 107∘ W, L=4.3) during the year June 1982–May 1983, Planet. Space Sci., 32, 1087–1099, https://doi.org/10.1016/0032-0633(84)90134-X, 1984. a
Manson, A. H. and Meek, C. E.: Climatologies of mean winds and tides observed by medium frequency radars at Tromsø (70∘ N) and Saskatoon (52∘ N) during 1987–1989, Can. J. Phys., 69, 966–975, https://doi.org/10.1139/p91-152, 1991. a
Mielich, J. and Bremer, J.: Long-term trends in the ionospheric F2 region with different solar activity indices, Ann. Geophys., 31, 291–303, https://doi.org/10.5194/angeo-31-291-2013, 2013. a
Miyoshi, Y., Fujiwara, H., Jin, H., and Shinagawa, H.: Impacts of sudden stratospheric warming on general circulation of the thermosphere, J. Geophys. Res.-Space, 120, 10897–10912, https://doi.org/10.1002/2015JA021894, 2015. a
Peters, D. H., Entzian, G., and Keckhut, P.: Mesospheric temperature trends derived from standard phase-height measurements, J. Atmos. Sol.-Terr. Phys., 163, 23–30, https://doi.org/10.1016/j.jastp.2017.04.007, 2017. a
Pisoft, P., Sacha, P., Polvani, L. M., Añel, J. A., de la Torre, L., Eichinger, R., Foelsche, U., Huszar, P., Jacobi, C., Karlicky, J., Kuchar, A., Miksovsky, J., Zak, M., and Rieder, H. E.: Stratospheric contraction caused by increasing greenhouse gases, Environ. Res. Lett., 16, 064038, https://doi.org/10.1088/1748-9326/abfe2b, 2021. a
Qian, L., Jacobi, C., and McInerney, J.: Trends and solar irradiance effects in the mesosphere, J. Geophys. Res.-Space, 124, 1343–1360, https://doi.org/10.1029/2018JA026367, 2019. a, b, c, d, e, f, g
Schminder, R., Kürschner, D., Singer, W., Hoffmann, P., Keuer, D., and Bremer, J.: Representative height-time cross-sections of the upper atmosphere wind field over Central Europe 1990–1996, J. Atmos. Sol.-Terr. Phys., 59, 2177–2184, https://doi.org/10.1016/S1364-6826(97)00062-X, 1997. a
She, C.-Y., Berger, U., Yan, Z.-A., Yuan, T., Lübken, F.-J., Krueger, D. A., and Hu, X.: Solar Response and Long-Term Trend of Midlatitude Mesopause Region Temperature Based on 28 Years (1990–2017) of Na Lidar Observations, J. Geophys. Res.-Space, 124, 7140–7156, https://doi.org/10.1029/2019JA026759, 2019. a
Shepherd, M. G., Meek, C. E., Hocking, W. K., Hall, C. M., Partamies, N., Sigernes, F., Manson, A. H., and Ward, W. E.: Multi-instrument study of the mesosphere-lower thermosphere dynamics at 80∘ N during the major SSW in January 2019, J. Atmos. Sol.-Terr. Phys., 210, 105427, https://doi.org/10.1016/j.jastp.2020.105427, 2020. a
Smith, A. K., Garcia, R. R., Marsh, D. R., Kinnison, D. E., and Richter, J. H.: Simulations of the response of mesospheric circulation and temperature to the Antarctic ozone hole, Geophys. Res. Lett., 37, L22803, https://doi.org/10.1029/2010GL045255, 2010. a
Sprenger, K. and Schminder, R.: Results of ten years' ionospheric drift measurements in the l.f. range, J. Atmos. Sol.-Terr. Phys., 29, 183–199, https://doi.org/10.1016/0021-9169(67)90132-8, 1967. a, b
Sridharan, S., Tsuda, T., and Gurubaran, S.: Long-term tendencies in the mesosphere/lower thermosphere mean winds and tides as observed by medium-frequency radar at Tirunelveli (8.7∘ N, 77.8∘ E), J. Geophys. Res.-Atmos., 115, D08109, https://doi.org/10.1029/2008JD011609, 2010. a
Stober, G., Matthias, V., Brown, P., and Chau, J. L.: Neutral density variation from specular meteor echo observations spanning one solar cycle, Geophys. Res. Lett., 41, 6919–6925, https://doi.org/10.1002/2014GL061273, 2014. a
Stober, G., Kuchar, A., Pokhotelov, D., Liu, H., Liu, H.-L., Schmidt, H., Jacobi, C., Baumgarten, K., Brown, P., Janches, D., Murphy, D., Kozlovsky, A., Lester, M., Belova, E., Kero, J., and Mitchell, N.: Interhemispheric differences of mesosphere–lower thermosphere winds and tides investigated from three whole-atmosphere models and meteor radar observations, Atmos. Chem. Phys., 21, 13855–13902, https://doi.org/10.5194/acp-21-13855-2021, 2021. a
Taubenheim, J., Entzian, G., and Berendorf, K.: Long-term decrease of mesospheric temperature, 1963–1995, inferred from radiowave reflection heights, Adv. Space Res., 20, 2059–2063, https://doi.org/10.1016/S0273-1177(97)00596-6, 1997. a
Wendisch, M., Brückner, M., Crewell, S., Ehrlich, A., Notholt, J., Lüpkes, C., Macke, A., Burrows, J. P., Rinke, A., Quaas, J., Maturilli, M., Schemann, V., Shupe, M. D., Akansu, E. F., Barrientos-Velasco, C., Bärfuss, K., Blechschmidt, A.-M., Block, K., Bougoudis, I., Bozem, H., Böckmann, C., Bracher, A., Bresson, H., Bretschneider, L., Buschmann, M., Chechin, D. G., Chylik, J., Dahlke, S., Deneke, H., Dethloff, K., Donth, T., Dorn, W., Dupuy, R., Ebell, K., Egerer, U., Engelmann, R., Eppers, O., Gerdes, R., Gierens, R., Gorodetskaya, I. V., Gottschalk, M., Griesche, H., Gryanik, V. M., Handorf, D., Harm-Altstädter, B., Hartmann, J., Hartmann, M., Heinold, B., Herber, A., Herrmann, H., Heygster, G., Höschel, I., Hofmann, Z., Hölemann, J., Hünerbein, A., Jafariserajehlou, S., Jäkel, E., Jacobi, C., Janout, M., Jansen, F., Jourdan, O., Jurányi, Z., Kalesse-Los, H., Kanzow, T., Käthner, R., Kliesch, L. L., Klingebiel, M., Knudsen, E. M., Kovács, T., Körtke, W., Krampe, D., Kretzschmar, J., Kreyling, D., Kulla, B., Kunkel, D., Lampert, A., Lauer, M., Lelli, L., von Lerber, A., Linke, O., Löhnert, U., Lonardi, M., Losa, S. N., Losch, M., Maahn, M., Mech, M., Mei, L., Mertes, S., Metzner, E., Mewes, D., Michaelis, J., Mioche, G., Moser, M., Nakoudi, K., Neggers, R., Neuber, R., Nomokonova, T., Oelker, J., Papakonstantinou-Presvelou, I., Pätzold, F., Pefanis, V., Pohl, C., van Pinxteren, M., Radovan, A., Rhein, M., Rex, M., Richter, A., Risse, N., Ritter, C., Rostosky, P., Rozanov, V. V., Donoso, E. R., Saavedra-Garfias, P., Salzmann, M., Schacht, J., Schäfer, M., Schneider, J., Schnierstein, N., Seifert, P., Seo, S., Siebert, H., Soppa, M. A., Spreen, G., Stachlewska, I. S., Stapf, J., Stratmann, F., Tegen, I., Viceto, C., Voigt, C., Vountas, M., Walbröl, A., Walter, M., Wehner, B., Wex, H., Willmes, S., Zanatta, M., and Zeppenfeld, S.: Atmospheric and Surface Processes, and Feedback Mechanisms Determining Arctic Amplification: A Review of First Results and Prospects of the (AC)3 Project, B. Am. Meteorol. Soc., 104, E208–E242, https://doi.org/10.1175/BAMS-D-21-0218.1, 2023. a
Yiğit, E. and Medvedev, A. S.: Internal wave coupling processes in Earth’s atmosphere, Adv. Space Res., 55, 983–1003, https://doi.org/10.1016/j.asr.2014.11.020, 2015. a
- Abstract
- Introduction
- Observations
- Long-term trends over Collm and their changes, based on LF/VHF measurements
- Comparison of Collm LF/VHF and Juliusruh PR winds and their changes
- Conclusions
- Code availability
- Data availability
- Author contributions
- Competing interests
- Disclaimer
- Special issue statement
- Financial support
- Review statement
- References