 | 01 Dec 2023
Anomaly Detection with Decision Trees for AI Assisted Evaluation of Signal Integrity on PCB Transmission Lines
Emre Ecik
Werner John
Julian Withöft
Jürgen Götze
Printed circuit board (PCB) design can be supported to a high degree by adding AI modules to the design system. Predictions from these modules can be made available to the designer in order to speed up circuit design and make it more efficient. Problems regarding signal integrity (SI) can be detected in time by providing hints on component connection or routing. However, the optimization and ML methods used in this context are usually very sophisticated (e.g., Bayesian optimization). Therefore, the design parameters provided by the AI modules must be accepted without further insights (for the experienced as well as the inexperienced designer). In this paper, a decision tree for anomaly detection and SI verification is presented, which by nature of this algorithm provides insights to the decisions made to obtain the proposed design parameters. Using a point-to-point (P2P) network as an example, the prediction accuracy of the AI model is investigated. It is shown that assessing SI effects with a decision tree provides a simple approach to obtain the suggested design. Furthermore, the predictions of the decision tree can be verified against the design rules.
- Article
(4720 KB) - Full-text XML
- BibTeX
- EndNote


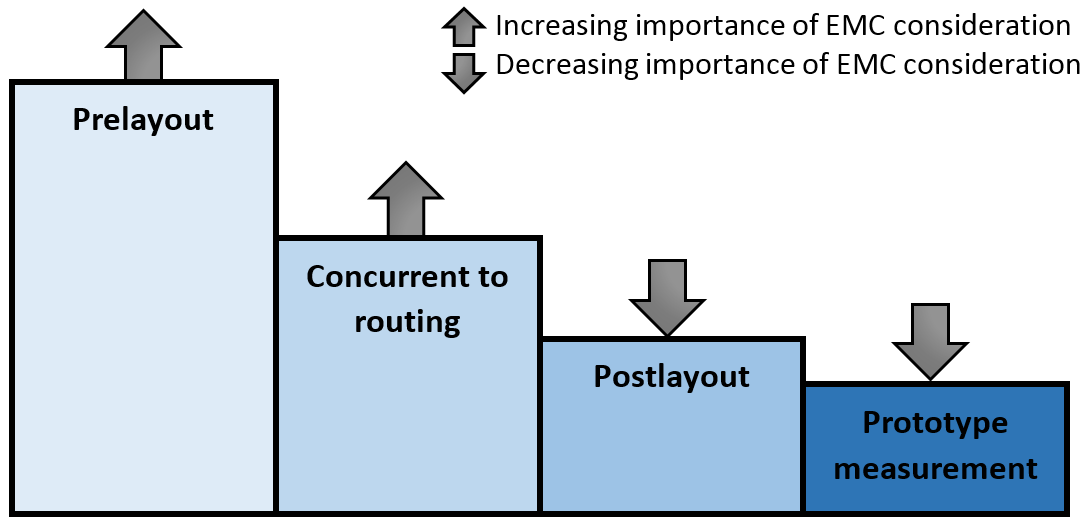
The topic of signal integrity is becoming more and more important due to continuously decreasing dimensions and higher frequencies of electronic systems. Distortions and interferences of signals as a cause of reflections must be eliminated by the developer already in the prelayout phase. Since SI effects have a great impact on EMC problems, the importance of EMC analysis for different design levels can also serve as a starting point for considering signal integrity. Therefore, addressing signal integrity at earlier design stages is inevitable as illustrated in Fig. 1. In addition to maintaining the functionality of a design, other factors such as “time to market”, “number of necessary iterations during design process” and “cost” can be significantly reduced by ensuring an SI-compliant design in prelayout.
By developing AI models and expressing them as AI modules for use in the SI-compliant design of PCB transmission line structures, the design tasks PreLayout and PostLayout can be efficiently supported. For this purpose, the introduction of combined process and phase models to describe the development of electronic systems is mandatory. A generalized design process (Process Model to Integrate SI-Constraints into Electronic System Design; see also works of John, 1996) was presented by John et al. (2022) to support the implementation of AI/ML models and modules with respect to AI/ML-relevant data sources and objects.
In the following, the use of combined process and phase models for effective implementation of AI models and modules, as well as their potential applications for PCB development, are discussed in more detail.
1.1 Combined Model for Analyzing and Handling Physical Coupling Effects
Combined process and phase models can be used to analyze and describe development processes. Insights gained in the analysis enable an assessment of the examined process with regard to its efficiency and can thus be the starting point for optimization. The following considerations for the introduction of generally usable process models refer in this paper exclusively to SI effects caused by reflections on PCB transmission line systems. The combined process and phase model explained in the following can be used at any time also for the EDA-based treatment of further physical coupling effects (e.g. crosstalk/PDN/radiation/conducted disturbances/…). The use of generally usable process and phase models creates a very good basis for comparison, since industrial development and thus EDA-supported design processes generally differ from one another.
The procedures for the development of electronic systems are characterized by recurring basic principles. It is possible to determine generally valid phases that are passed through during system development. Complex systems are developed in a hierarchical way. Process models can be found in the literature, which reflect these basic principles among other things (Schefström and van den Broek, 1993; Bortolazzi and Müller-Glaser, 1990; John, 1996, pp. 365–372).
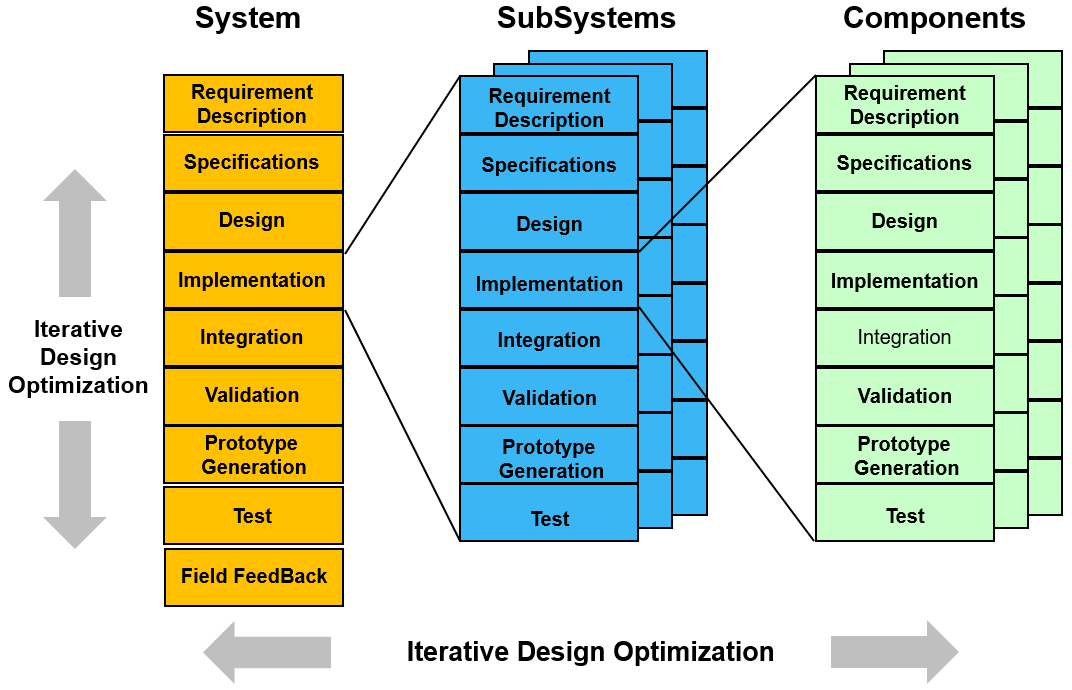
Figure 3 shows such a combined process and phase model (John, 1993, 1995, 1996), which is in current use within the project “progressivKI” (see works of John et al., 2022 and Financial support).
The development of an electronic system covers the phases “Requirement Description” via the phase Test “Integration” to the phase “Test” or respectively “Field FeedBack”. It is necessary to describe the development process hierarchically. Only in this way is it possible to fully capture the design boundary conditions at system, subsystem and component level and to identify the interrelationships between the levels. The respective development phases serve to structure the development processes to be described and may have to be processed overlapping. The respective system hierarchy results inevitably from the required functionality of the electronic systems. The system to be developed is usually partitioned recursively into subsystems/components. In this way, a complex development task can be divided into more manageable subtasks. The resulting system hierarchy can be described by a tree structure. The process model used was designed so that both “top-down” and “bottom-up” approaches are possible.
1.2 Synopsis – Integration of AI Modules into EDA Design Workflows
Printed circuit board design for high speed applications involves complex interdisciplinary processes. Currently, it can be observed in the EDA landscape that, for reasons of time and thus also of cost and quality, a significant shift of design revisions from the post layout (SI simulation) phase to the concurrent layout phase is taking place (shift left; Hess, 2022). It is therefore expected that a significant reduction in redesign cycles can be achieved by using, for example, AI modules to predict suitable SI solutions. For this purpose, e.g. for the development of an SI concept for upcoming design tasks, the presented extended combined process and phase model is essential. The integration of the AI modules presented below, which are still under development, into existing EDA design workflows is easily possible using the process model presented above. The definition of interfaces (data generation + invoking AI modules) to the respective individual EDA tools to be used is to be tested as an example at a later stage of the project.
1.3 PCB Transmission Line Network Applications
To illustrate the complexity of the SI issues to be addressed, a PCB transmission line network with one transmitter and four receivers (DDR), extracted from a typical industrial application and transformed for simulations, has to be be considered (see Fig. 2).
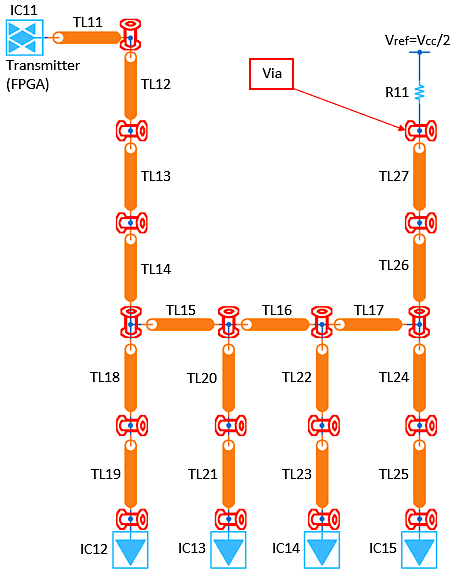
Figure 2Daisy Chain topology with a bi-directional transmitter and four receivers (memory devices).
For the PCB designer, for example, the complexity of the design task consists of analyzing (simulation) the application-specific parameters such as signal propagation times, impedance mismatch, overshoot, undershoot and noise limits (EMC) for each line network and evaluating the input and output signals.
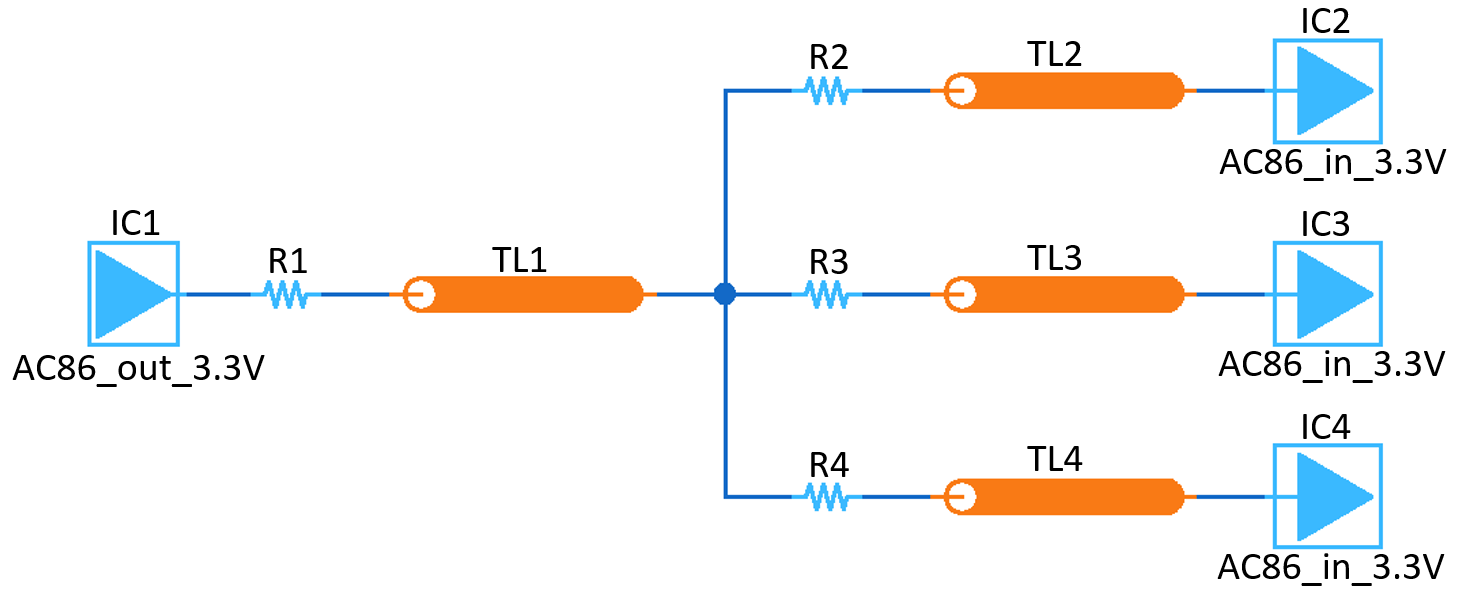
In order to be able to fundamentally investigate the use of anomaly detection methods, the above PCB line network was simplified and two typical PCB network types were introduced (point-to-point and star point; see Figs. 6 and 7). In the following, further considerations on the use of anomaly detection methods will concentrate on these two PCB network types.
1.4 Reduction of SI Analysis Complexity in PCB Design
It is immediately clear that the designer is confronted with a complex optimization problem due to many parameters to be considered in the design space. For this purpose, simulations and measurements are generally necessary for a consideration of signal integrity while ensuring constraints in the design. Analytical solutions may be sufficient for simple applications, whereas more complex designs require 3D full-wave solvers to compute the output (Trinchero and Canavero, 2021). These simulations are very time and resource consuming if there are a large number of input parameters. Furthermore, especially for inexperienced designers finding an SI compliant solution can become very difficult and error prone. In this regard, AI-based models of electronic circuits can assist the designer. Numerous possible solutions have already been presented in the literature, which are based, among other things, on the estimation of eye diagrams (Ma et al., 2019; Lu et al., 2018) or of S-parameters (Li and Hu, 2020) depending on the selected design parameters. Methods such as support vector regression (SVR; Smola and Schölkopf, 2004), neural networks (NN; John et al., 2022), sparse grids (Stoyanov, 2015), or random forest regression (RFR; Segal, 2004) are used.
By combining the mentioned surrogate models with iterative optimization techniques, such as Bayesian optimization (BO) or genetic algorithms (GA), design parameters can be proposed that ensure sufficiently good performance in terms of signal integrity (Torun et al., 2018; Zhang et al., 2022). Furthermore, inverse neural networks (INN) can be found in literature to directly obtain predictions for design parameters from eye diagrams (Ambasana et al., 2021; Moura et al., 2022).
The presented strategies for SI compliant design are complex and mostly related to specific high-speed systems (Torun et al., 2018; Lu et al., 2018). Furthermore, the mentioned algorithms such as BO and GA can become very time-consuming for higher dimensions. Therefore, an anomaly detection method is presented in this paper, which is implemented by a decision tree. Various decision tree methods were already compared by Lai et al. (2023) for predicting impedance values. However, these approaches treat the forward problem and are not based on assessing output waveforms. The presented anomaly detection with a decision tree allows the designer to evaluate SI effects in a simple structured decision process. Furthermore, the decisions that led to the design proposal can be understood more easily (explainable AI). In addition to these advantages, decision trees rank the features used in terms of significance and have a high computational efficiency (Casas et al., 2016).
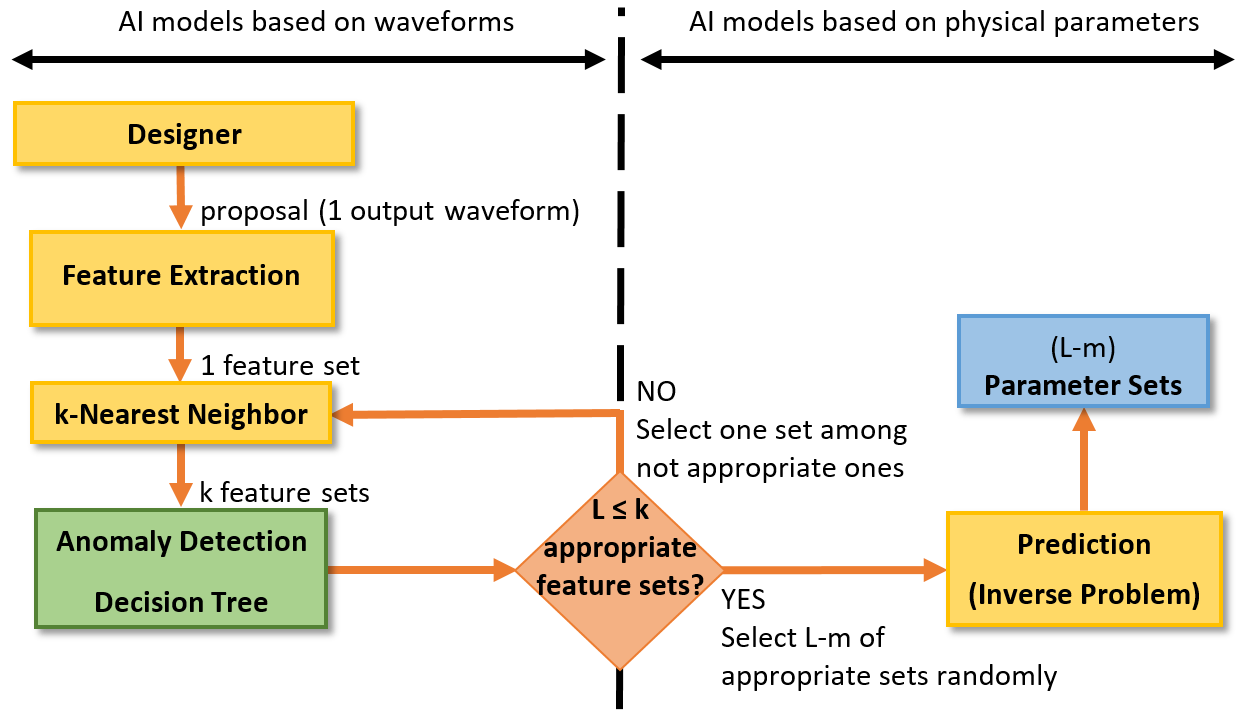
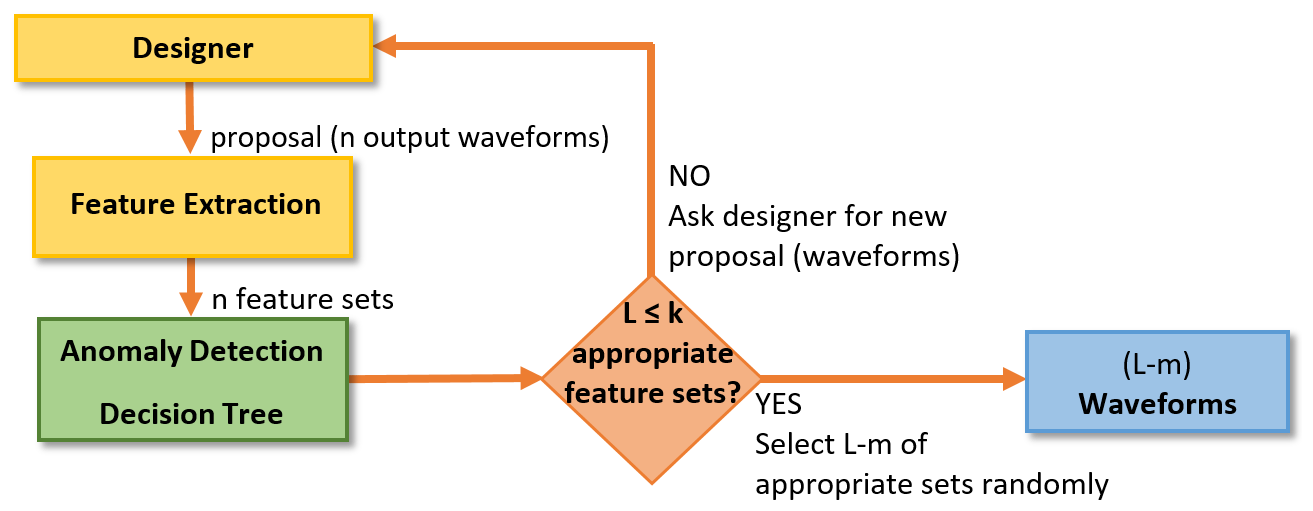
By using presented methods (k-Nearest Neighbor and NN) from previous work (John et al., 2022), a design optimization framework can be implemented for evaluating the proposals with decision trees. One possible approach is shown in Fig. 4. The designer makes an initial proposal. Then, a number of feature sets are generated by the k-Nearest Neighbor. These sets are evaluated by an anomaly detection, which divides the waveforms in appropriate and not appropriate ones. If appropriate waveforms are not available, the procedure will be repeated with newly proposed feature sets by the k-Nearest Neighbor algorithm. In the case of finding appropriate sets, L−m predictions are chosen randomly. Finally, the predictions of an AI model, which solves the inverse design problem, will lead to SI conform waveforms.
In contrast to the algorithms of Medico et al. (2019), which are based on the assessment of signals by an anomaly detection similar to the present work, the concept from Fig. 4 does not require complex algorithms such as BO or autoencoder (AE). Furthermore, the deployment of the decision tree in presented work differs from the implementation of Zhang et al. (2019), because the method here is not directly dependent on physical parameters. The decision tree relies on anomaly detection based on output waveforms and models the human evaluation process. Therefore, the introduced anomaly detection can be seen as an independent model, which can be deployed to output waveforms without considering the topology primarily (see Fig. 5). The information regarding the physical parameters are required only in the case of utilizing the anomaly detection for optimizing a dedicated design (see Fig. 4).
Present work first addresses the suitability of the decision tree for evaluating SI effects based on the output signals (see Fig. 5). After verification of these results, the presented anomaly detection can be used as a module for design optimization (see Fig. 4).
For the implementation of the decision tree, Sect. 2 first describes the idea of SI evaluation by a tree structure and briefly discusses the theoretical principles. In the Sects. 3 and 4, the findings are presented and the prediction accuracy of the anomaly detection for different networks is investigated. Finally, the results are summarized and future work is presented.
To evaluate SI effects with anomaly detection, the model shown in Fig. 5 is used as a starting point in the following. With the developer's suggestions, output signals are first generated from pyhsical parameters of the network by simulations and then features are extracted. For this purpose, AI models can be used instead of simulations, which perform the prediction of features directly from the design parameters. The selected features are inspected by anomaly detection and a decision is made whether the waveforms to be inspected are suitable from a signal integrity point of view. By implementing an anomaly detection using a decision tree, the human evaluation process is modeled at this point. The tree structure implements an interpretable model of rules, which are usually given by design guides or experienced designers. The implemented model can be easily extended by adapting the output signal requirements, if the networks under consideration change.
2.1 Anomaly Detection
Anomaly detection is based on the identification of deviations in a data set. In the present work, supervised learning is used since both ideal and non-ideal output signals are labeled. In terms of the distribution of these two classes, it can be said that the non-ideal output signals form the majority class. In literature, methods (Joshi et al., 2019; Weiss and Hirsh, 1998) for identifying events in unbalanced data sets already exist. These strategies are not discussed further here, as the main goal of the work is to investigate the applicability of an anomaly detection approach with respect to SI evaluation. The basic principle is analyzed using a simple decision tree and the traceability of the predictions is demonstrated.
2.2 Decision Trees
By using decision trees, the supervised anomaly detection can be easily implemented. Decision trees have a hierarchical structure and are implemented with algorithms such as CART (Breiman et al., 1984) or C4.5 (Quinlan, 1993). At a certain node, the feature space is partitioned according to a metric. This procedure is continued until the leaves of the tree are reached via the branches or the algorithm is aborted due to other defined conditions (maximum depth). Overfitting can be avoided by the last mentioned action. Gini index or entropy are used as metrics for the partitioning of the feature space (Casas et al., 2016) in order to determine the information gain of the respective decision. The decision with the largest information gain is usually made first.
The decision tree in this paper was implemented using Matlab (The MathWorks, 2022) and is based on the CART algorithm. The Gini impurity measure was used for determining the optimal splits.
Two simple networks were considered for data generation and validation of results. Starting from the point-to-point network in Fig. 6, training data was generated and the prediction accuracy of the implemented anomaly detection by confusion matrices was assessed. Furthermore, the star point network shown in Fig. 7 was used to demonstrate the applicability of the previously created AI model for a different design.
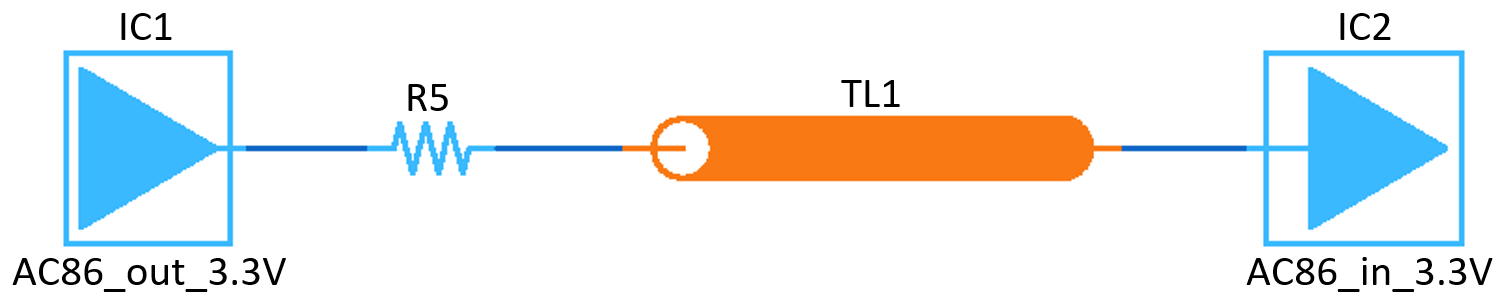
It can be seen that both networks (Figs. 6 and 7) use nonlinear IBIS models (AC86 gates) as output and input devices. Several reasons led to the selection of the AC technology. The main purpose included the comparability to previous works (John et al., 2022). Furthermore, AC86 Spice decks will be available in future, so that additional investigations can be carried out with the achieved results.
A detailed description of the selected parameter spaces and simulation results can be found in the following subsections.
3.1 Data Generation for Training of the Decision Trees
Voltage curves were first generated for the networks with the software eCADSTAR (Zuken Ltd., 2022). Parameters were varied for the point-to-point network in a batch mode using an implemented Python code according to Table 1. A total of 60 000 waveforms were generated for training and validation. Subsequently, waveforms for the star point network were generated independently for transfer learning by varying the physical parameters (see Table 1). A small data set of 1296 simulations was used since no batch operation for the star point network was available at the time of data generation. Nevertheless, the small dataset was sufficient because of the fact that it was deployed for the expansion of the decision tree and testing the possibility for transfer learning methodologies.
The dataset generation for the introduced AI model implementation procedure is based on already validated EDA simulation tools (Zuken Ltd., 2022).
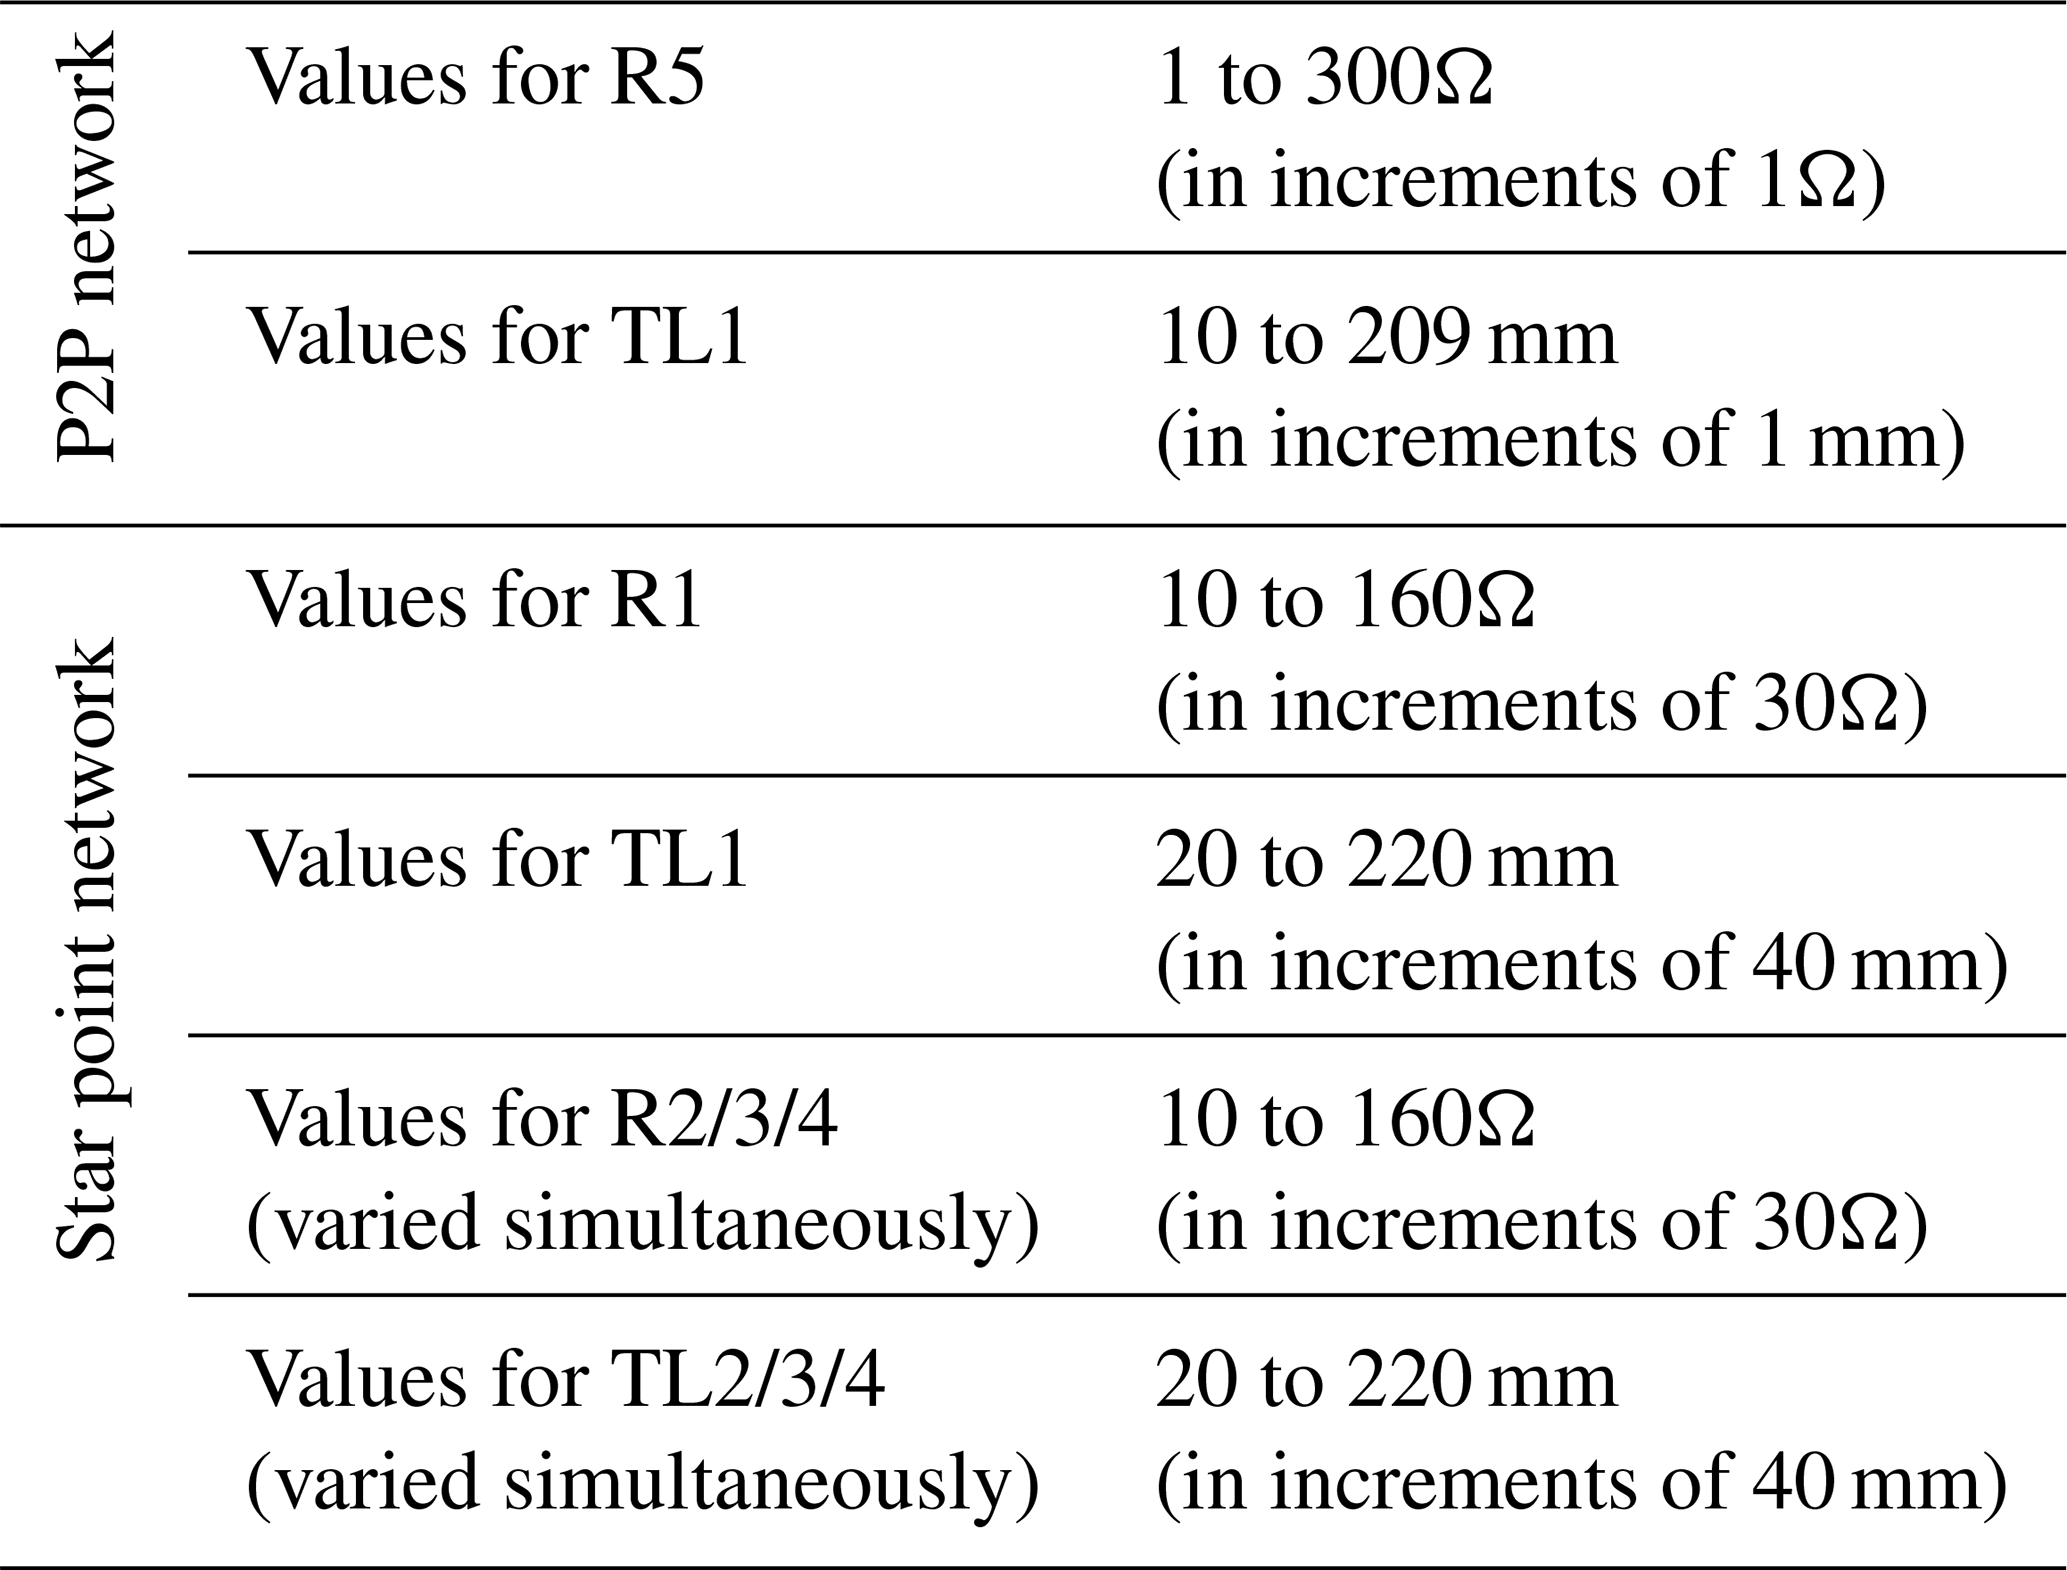
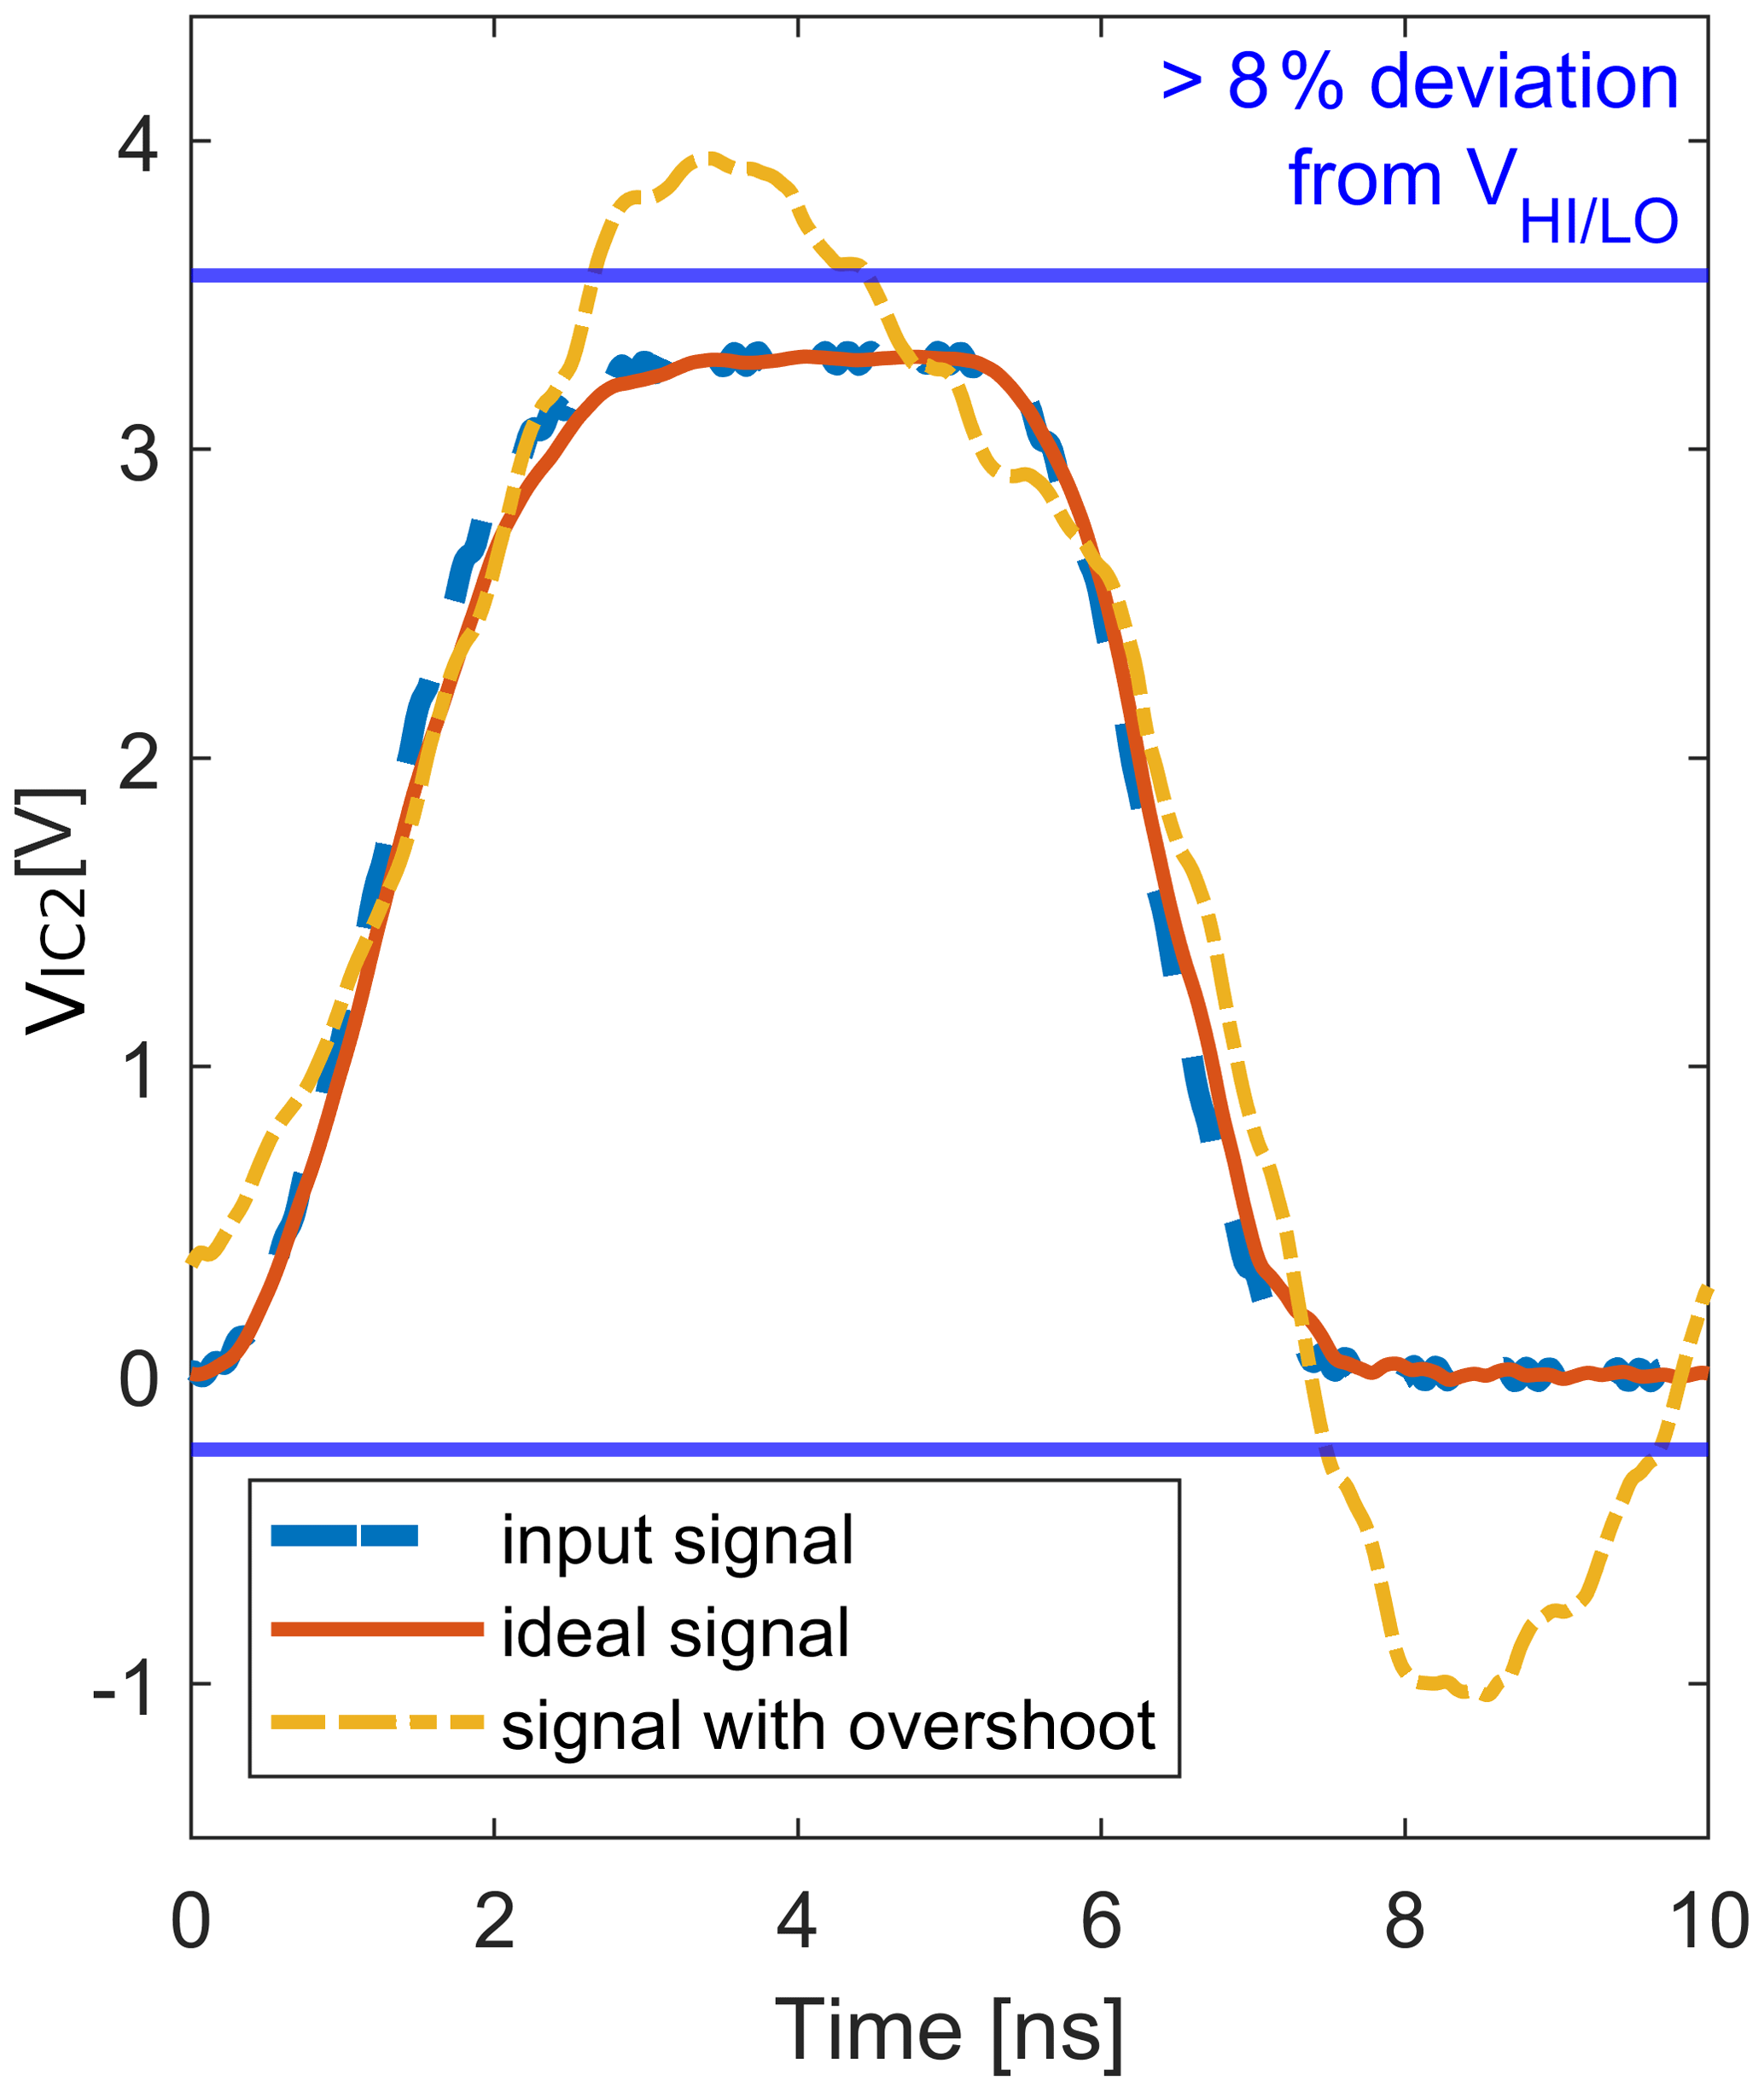
Figure 8 shows two possible voltage curves measured at the input of the receiver, representing an ideal (red) or non-ideal (orange; more than 8 % deviation from the high/low level) waveform from the signal integrity point of view. Furthermore, the input voltage (blue) is plotted as a reference. The processing of the signals was done with Matlab (The MathWorks, 2022). For further use, only the first signal periods of the voltage curves were considered due to the periodic nature of the waveforms. Additionally, signal propagation times were removed based on the lengths of the transmission lines in order to reduce the number of time-domain features (e.g., pin-to-pin delays) and complexity during training process.
3.2 Embedding Tacit Knowledge – Data Labeling
The task in this step is to develop a set of rules based on the designer's implicit knowledge (tacit knowledge) and to document the information (explicit knowledge). However, it is not always trivial to transform and formally describe the knowledge of the SI expert. Therefore, rules from design guides can additionally be used to identify voltage curves with respect to signal integrity. For this purpose, a selection of possible criteria is listed in Table 2.
Table 2A selection of criteria for assessing waveforms from a signal integrity perspective.
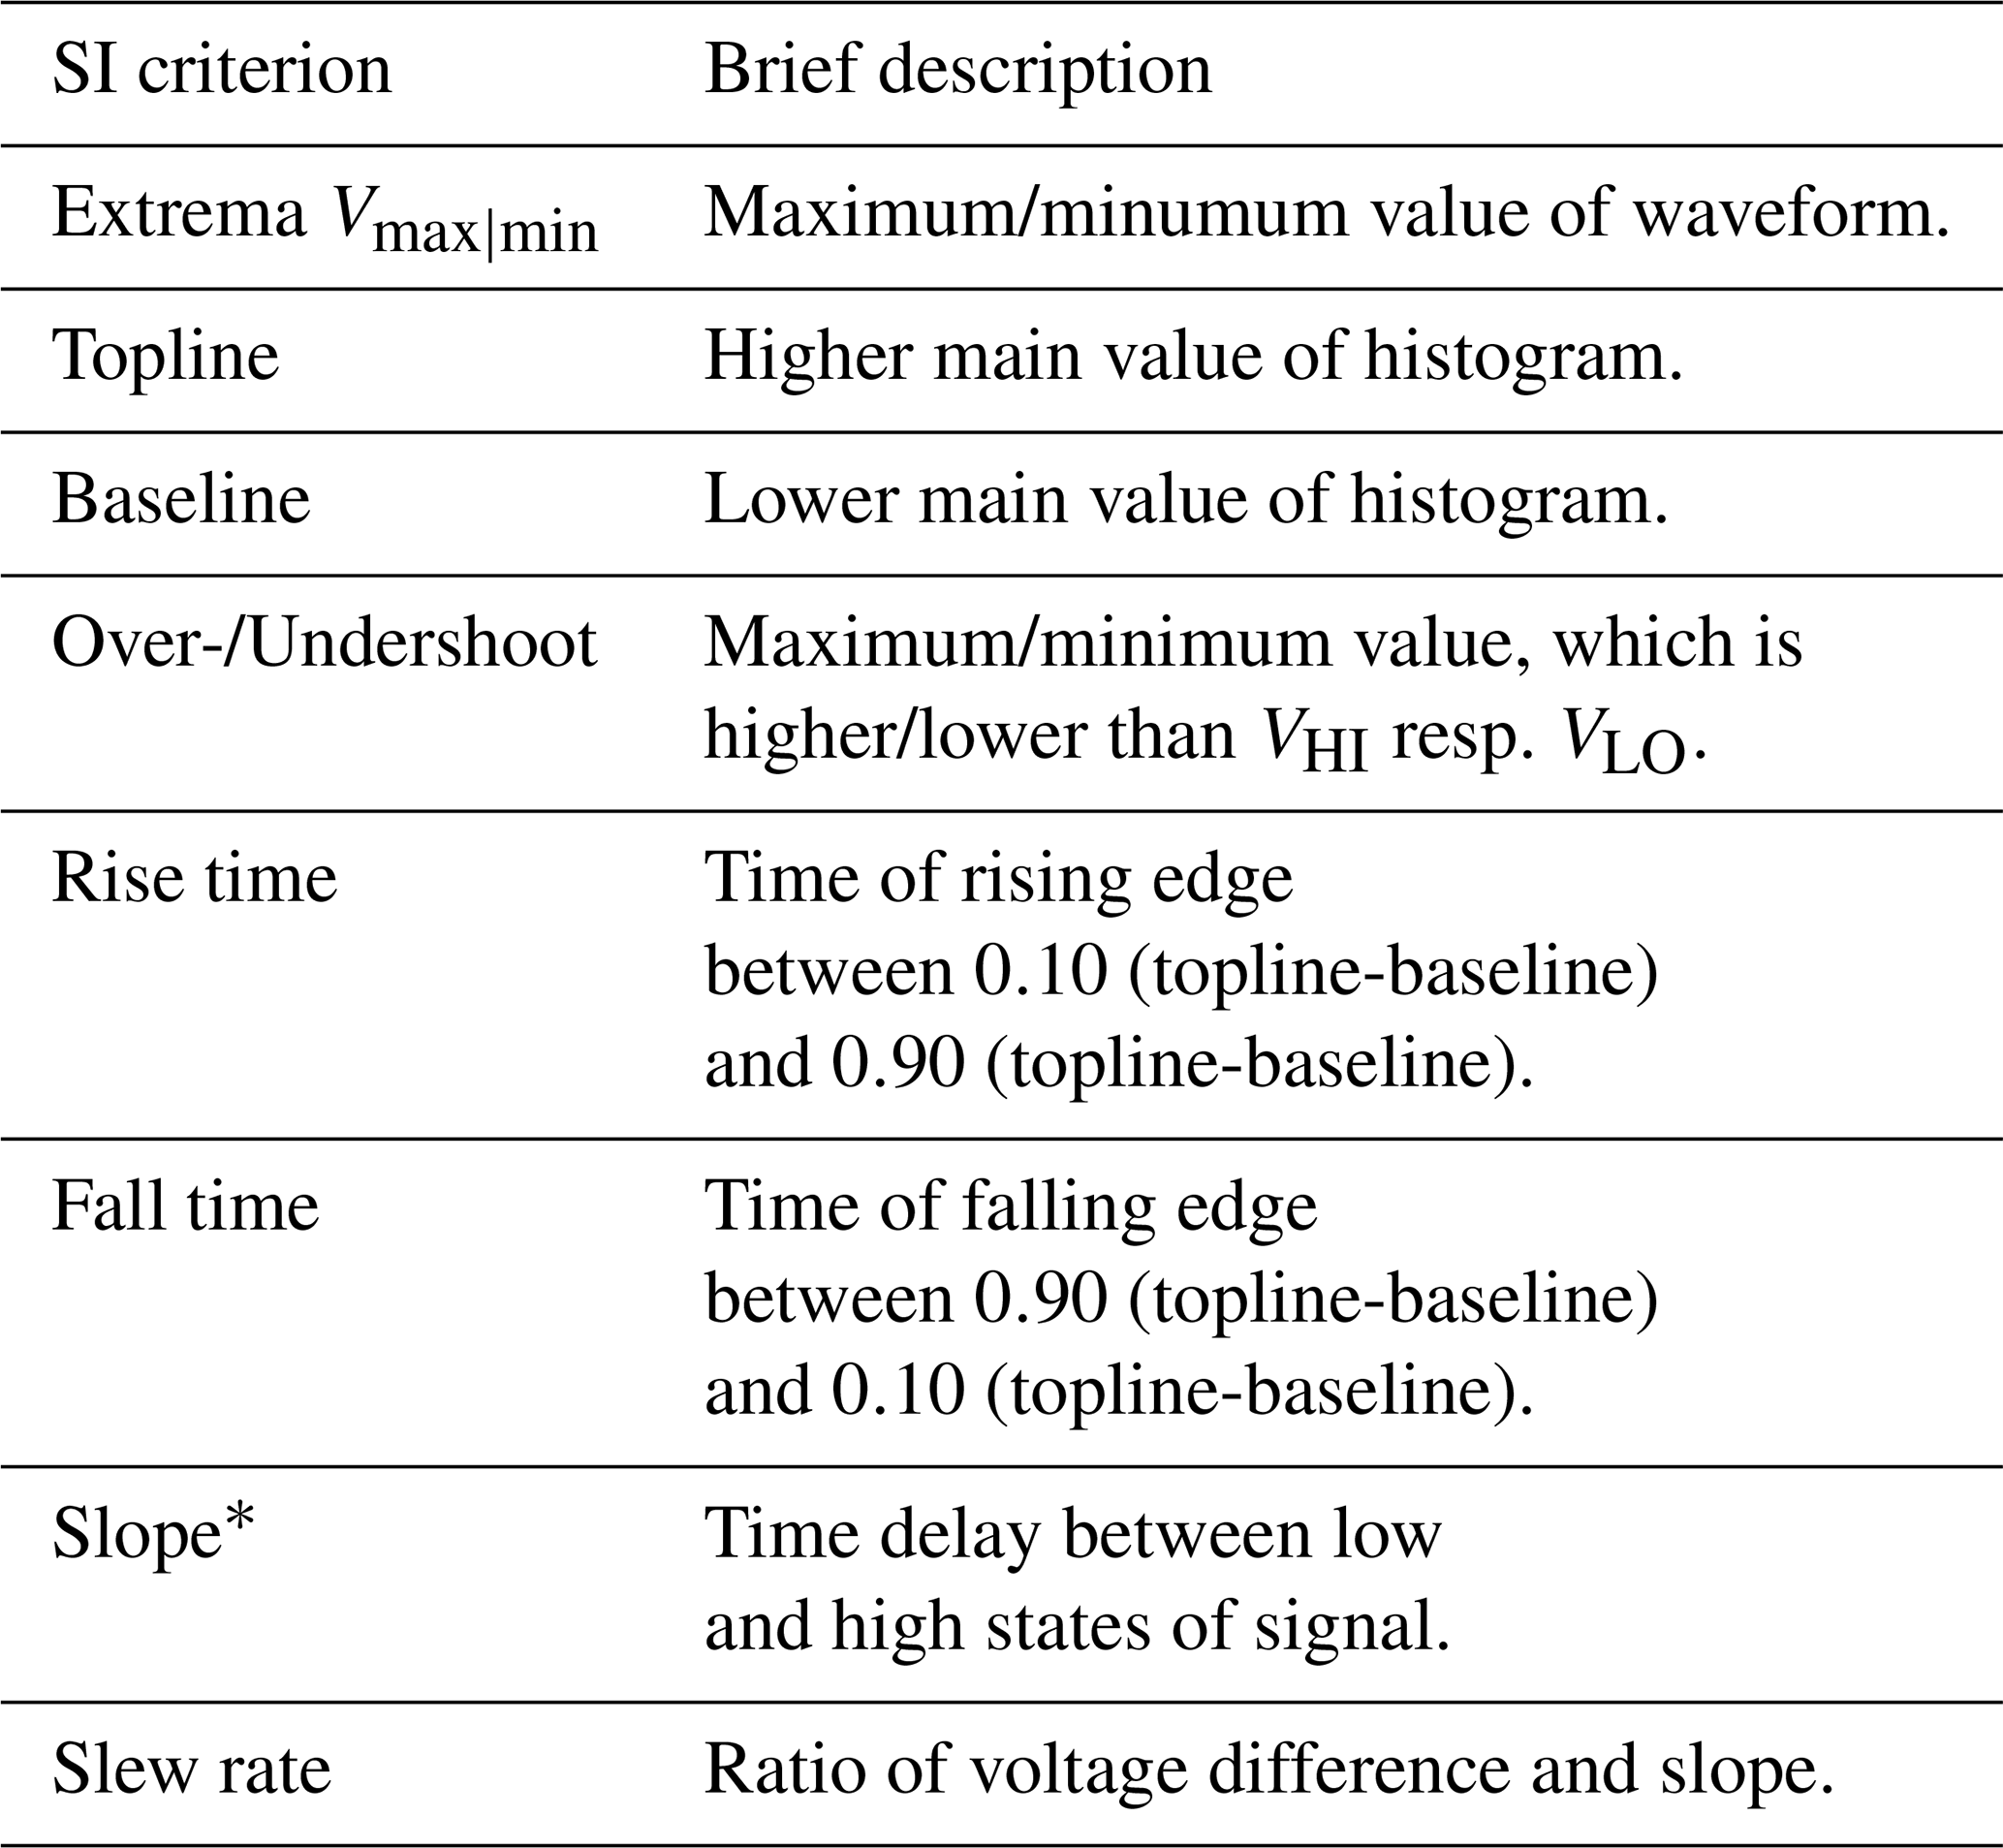
* Zuken Ltd. (2022) uses the reference voltage Vth and (stored in the IBIS model of the receiver (AC86) from Fig. 6) as defined in JEDEC (2012). According to other design rules in literature, voltage levels for slope can be defined as 10 % [20 %] and 90 % [80 %] of topline-baseline as in the case of rise/fall time.
The implementation for labeling the output curves can be extended by the developer at any time by adding further SI criteria like flight time, settling time and eye pattern values, so that the model of the decision tree can be adapted by a new training. However, the Matlab script for the labeling of voltage curves with SI conform characteristics was implemented in this work according to the conditions slew rate (definition as per JEDEC, 2012), over- and undershoot. Furthermore, it was checked whether the output curves exceed or fall below the voltage levels during the transition to the high/low state and maintain their values for a defined time (Fig. 9).
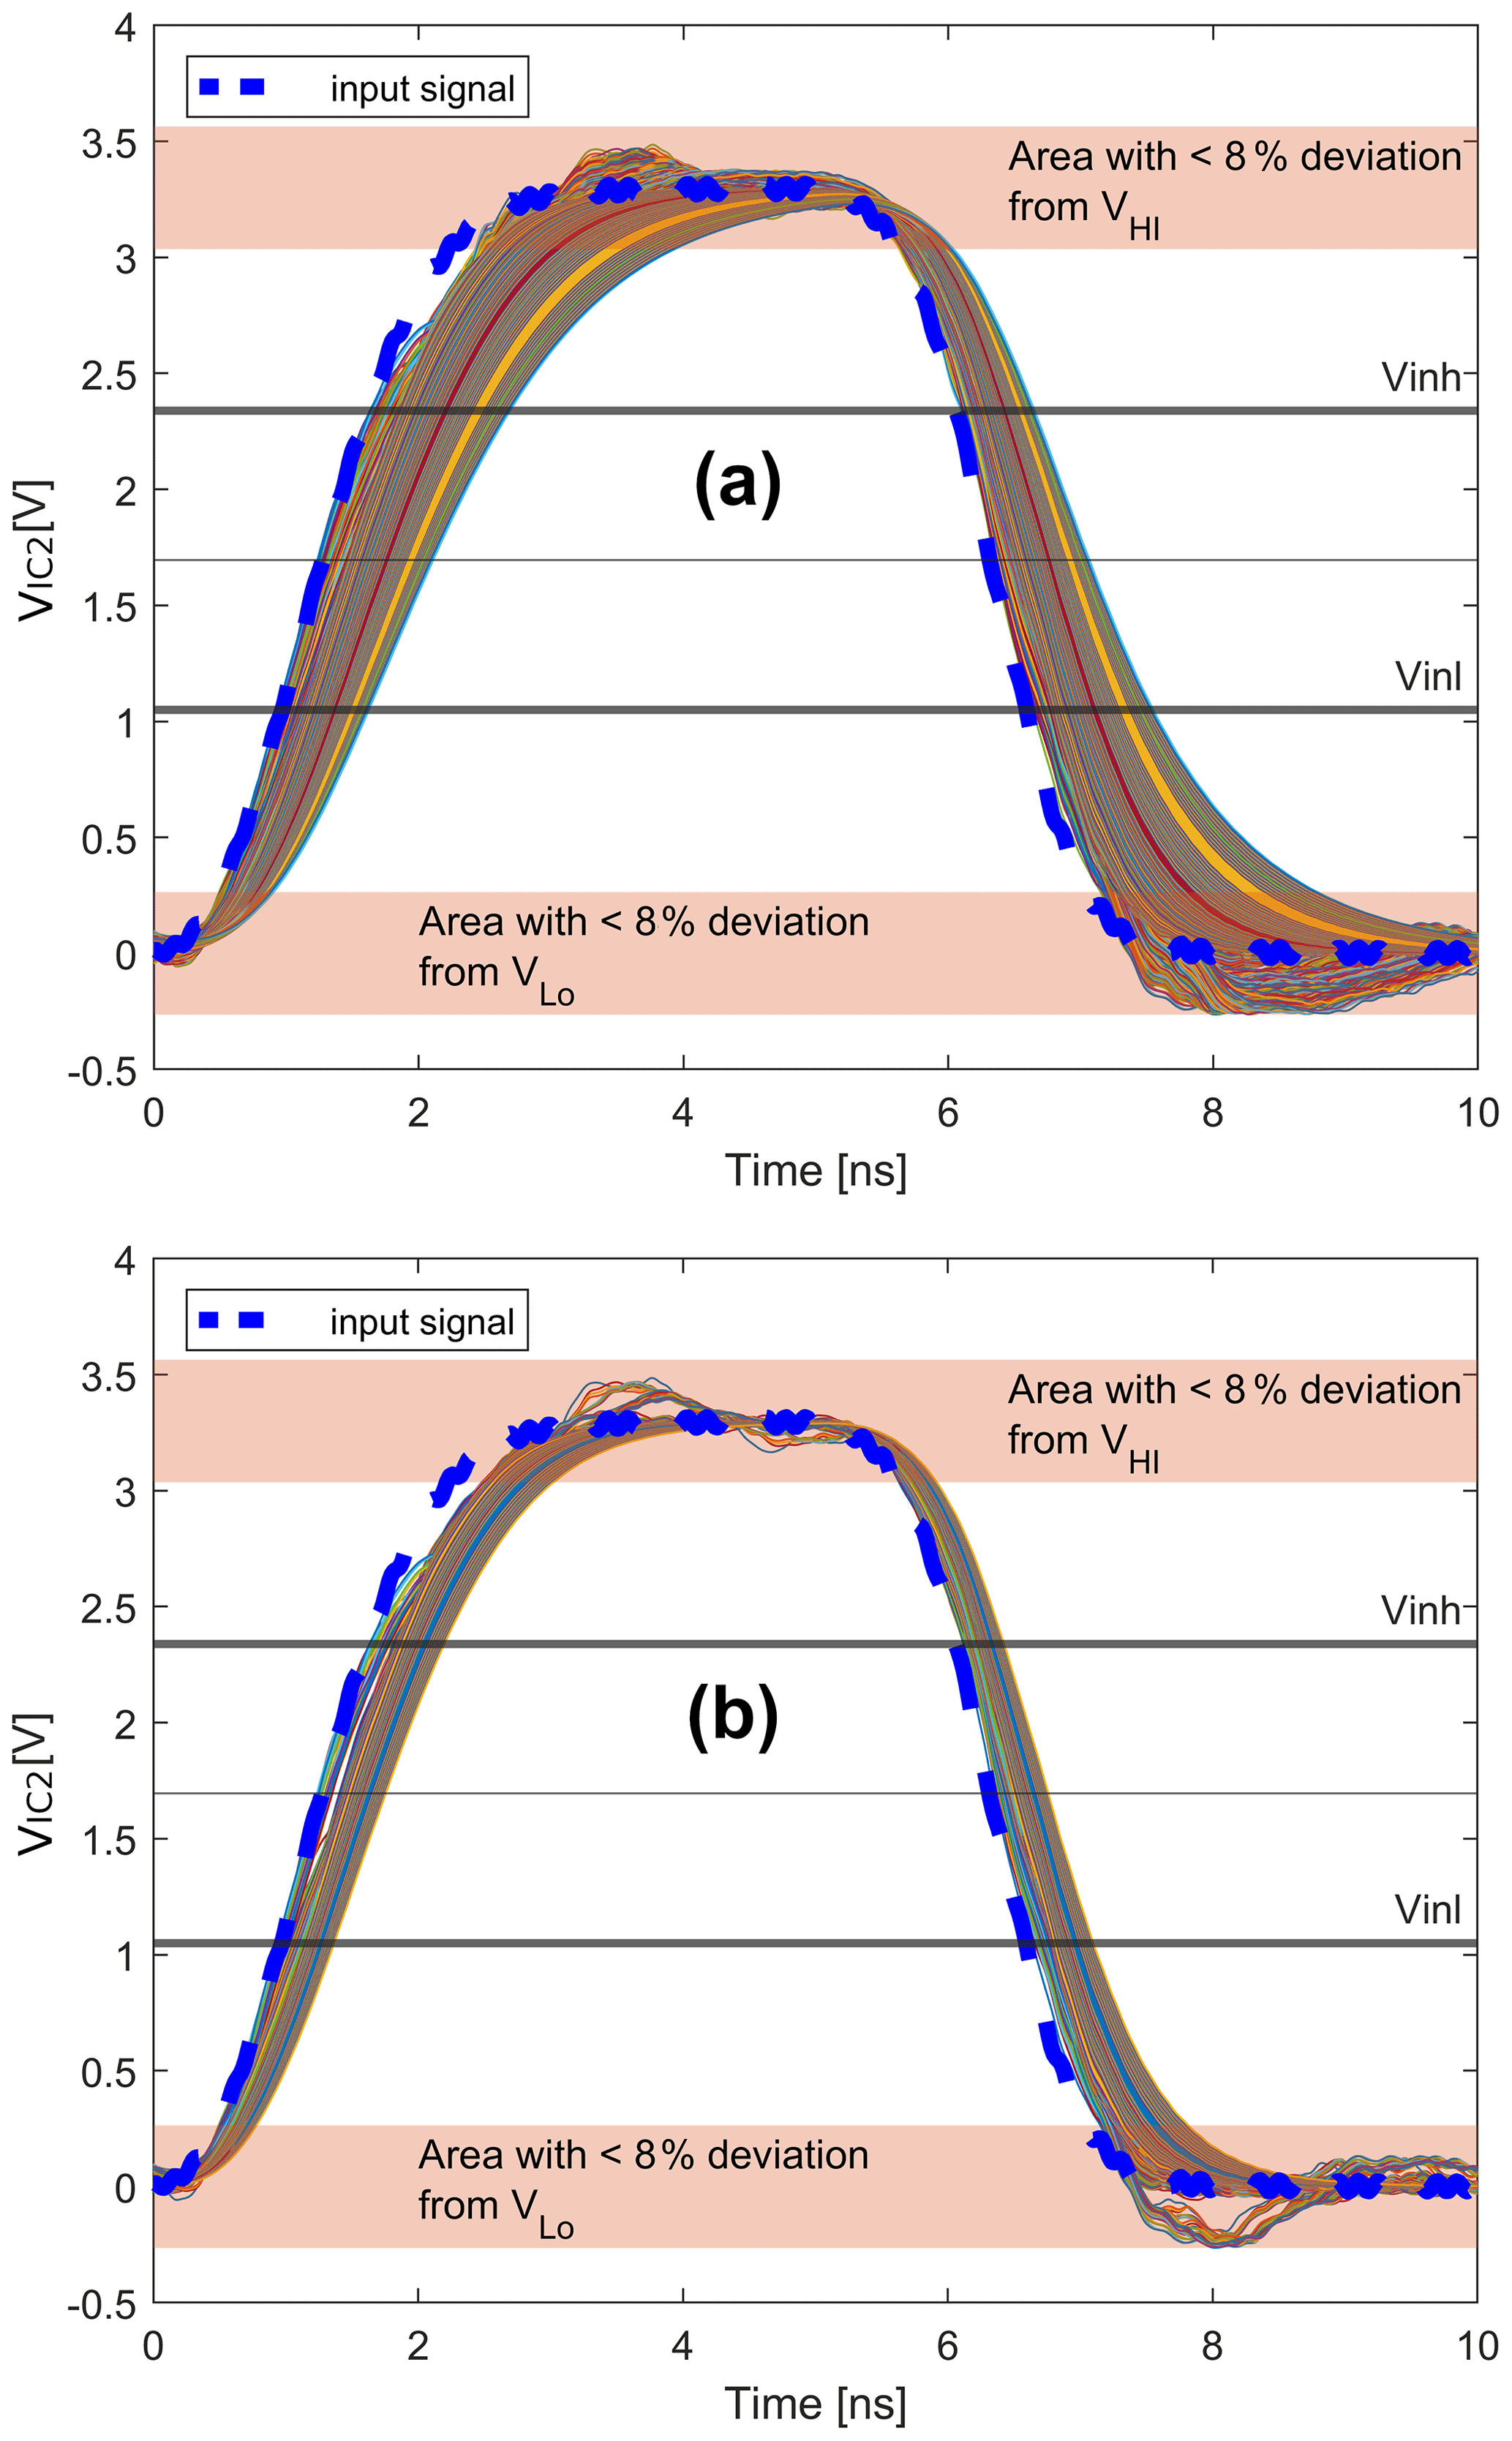
Figure 9Labeled waveforms according to the defined signal integrity criteria (overshoot/undershoot, slew rate and voltage level ): (a) Slew rate >1.1 [V ns−1]; (b) Slew rate >1.45 [V ns−1].
It can be seen in Fig. 9 that the deployment of the chosen criteria for labeling was precise enough without increasing the complexity of the implemented script by considering additional features. For the constraint “slew rate > 1.1 [V ns−1]” the choice of waveforms is mainly determined by the restriction “over-/undershoot <8 %” (Fig. 9(a)). With a more strictly formulated constraint “slew rate >1.45 [V ns−1]”, no significant over- or undershoot exists anymore (Fig. 9(b)).
A partitioning of the generated data sets into 80 % training and 20 % test data was first performed. Features were then extracted according to the parameters listed in Table 3.
Table 3Features for the training of the decision tree.
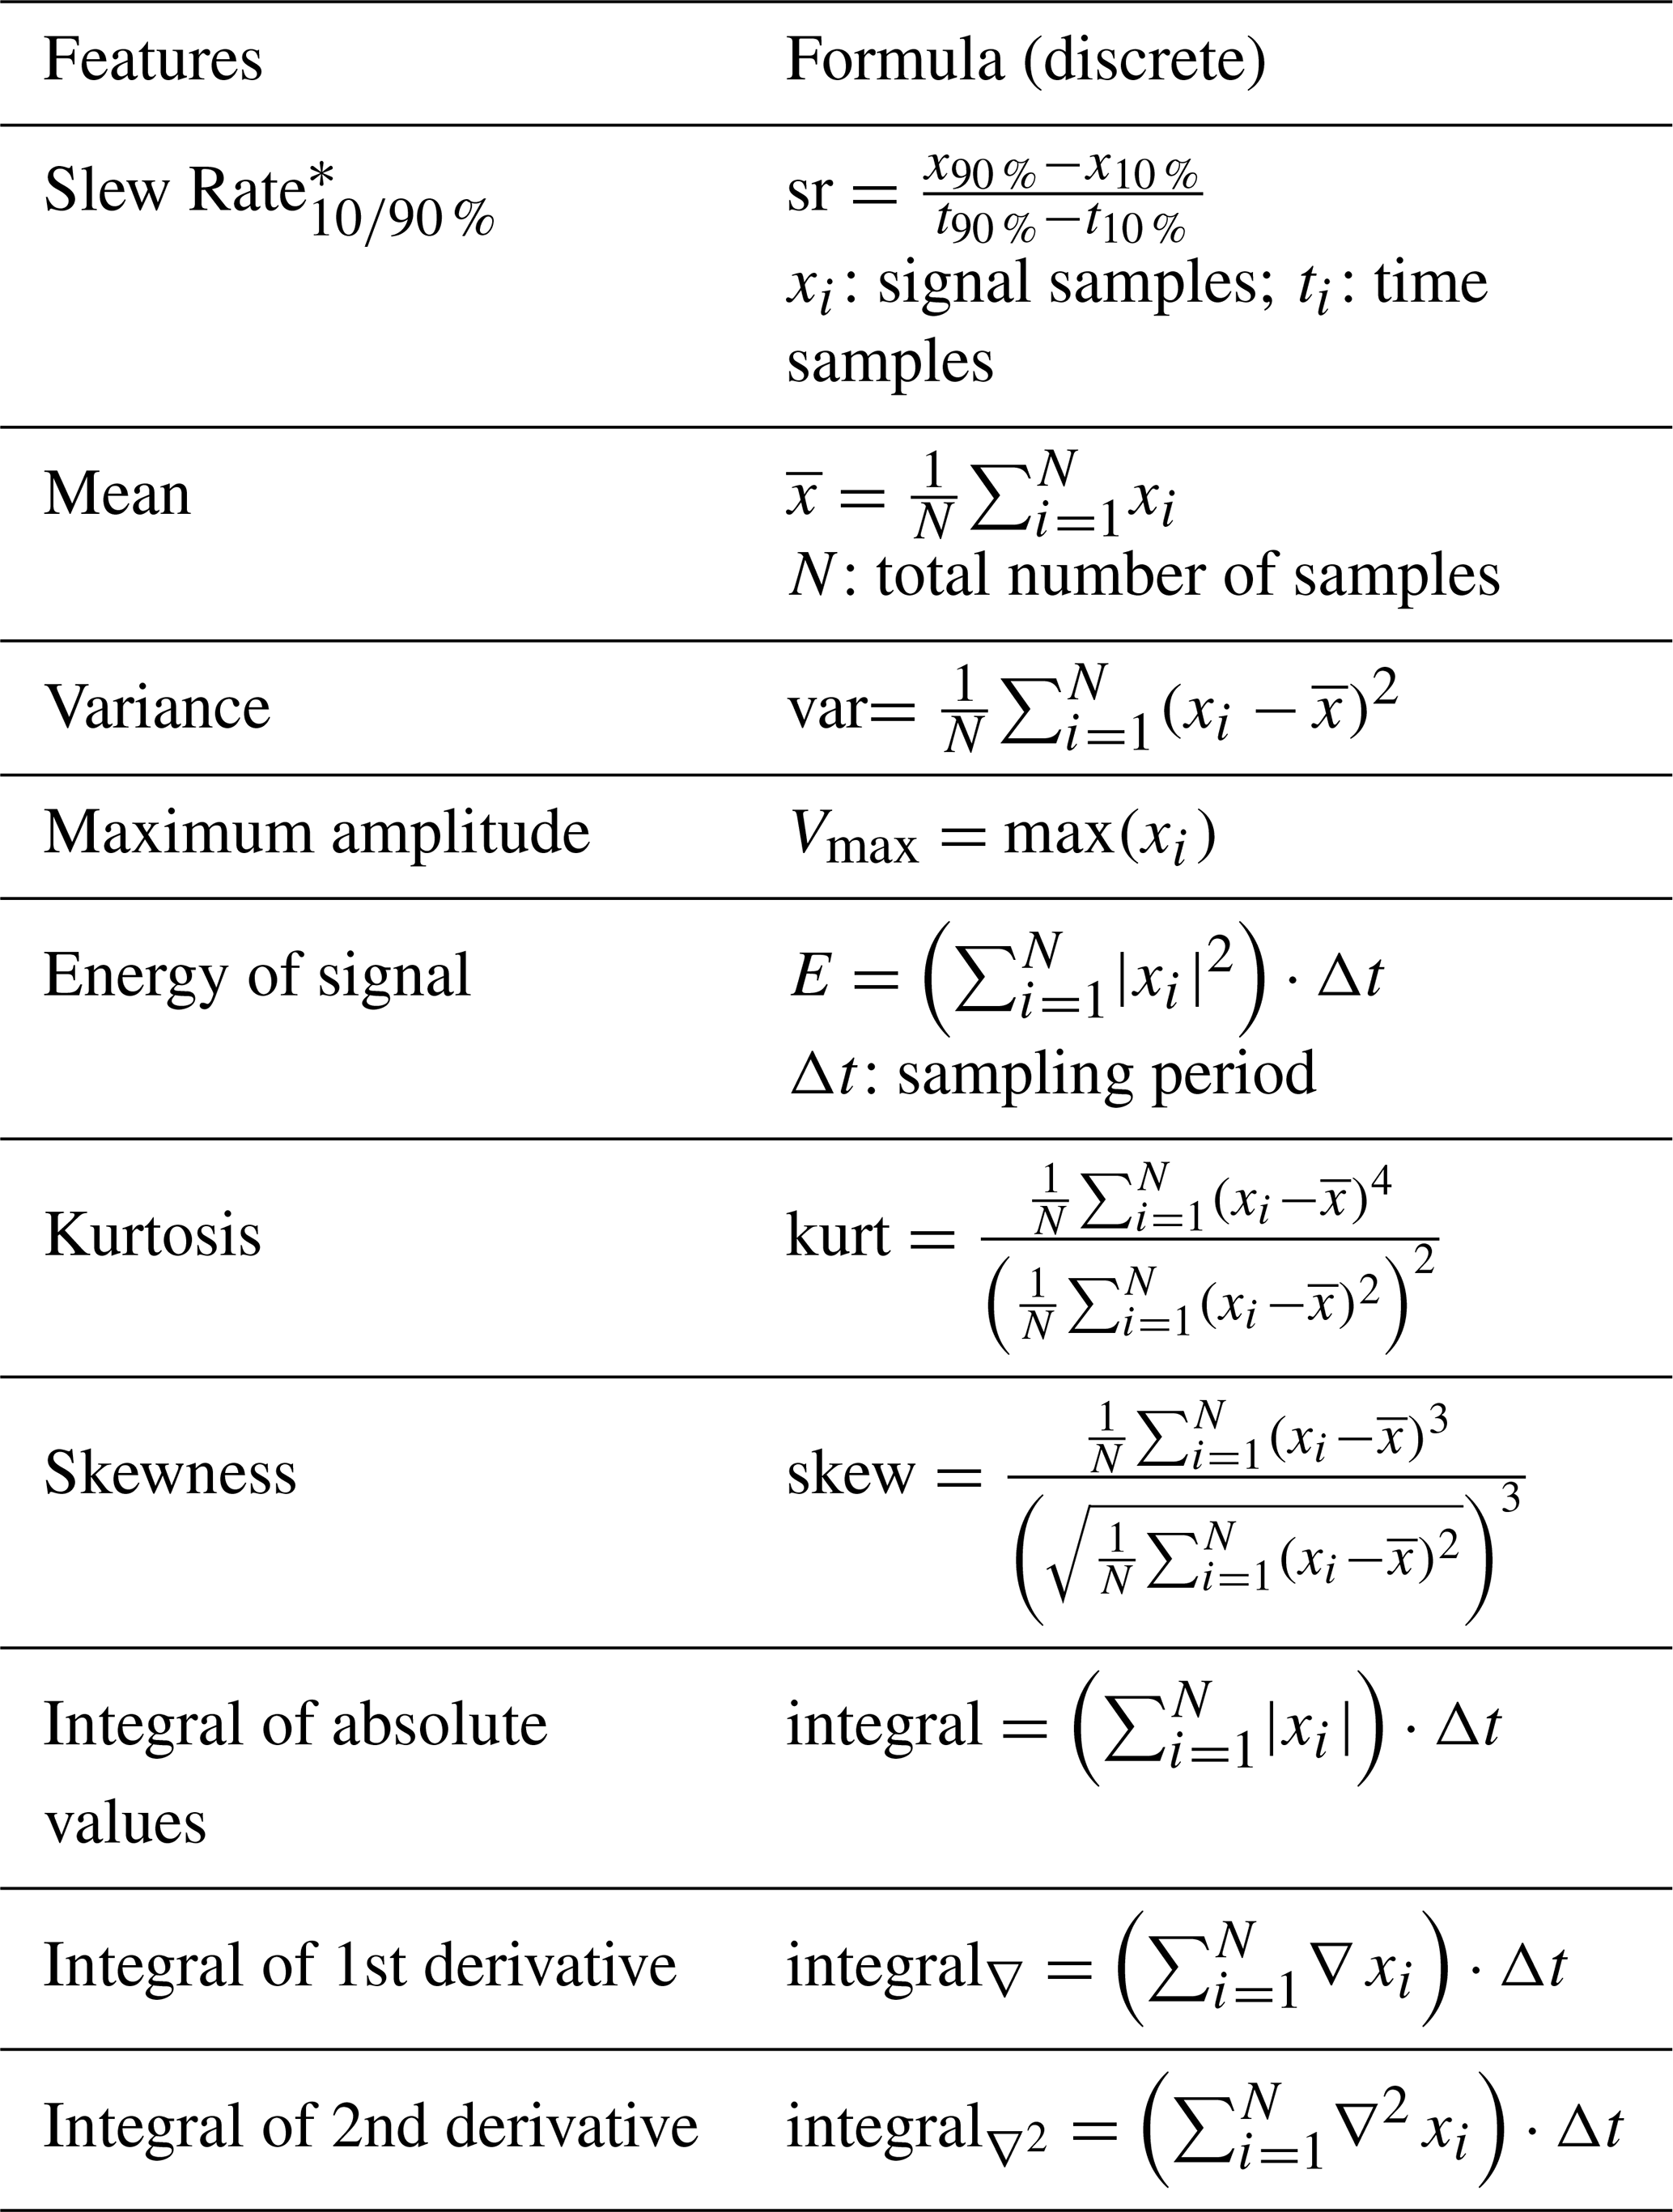
* The convention was used to maintain comparability with previous works (John et al., 2022).
4.1 Utilizing the Decision Tree for the Point-To-Point Network
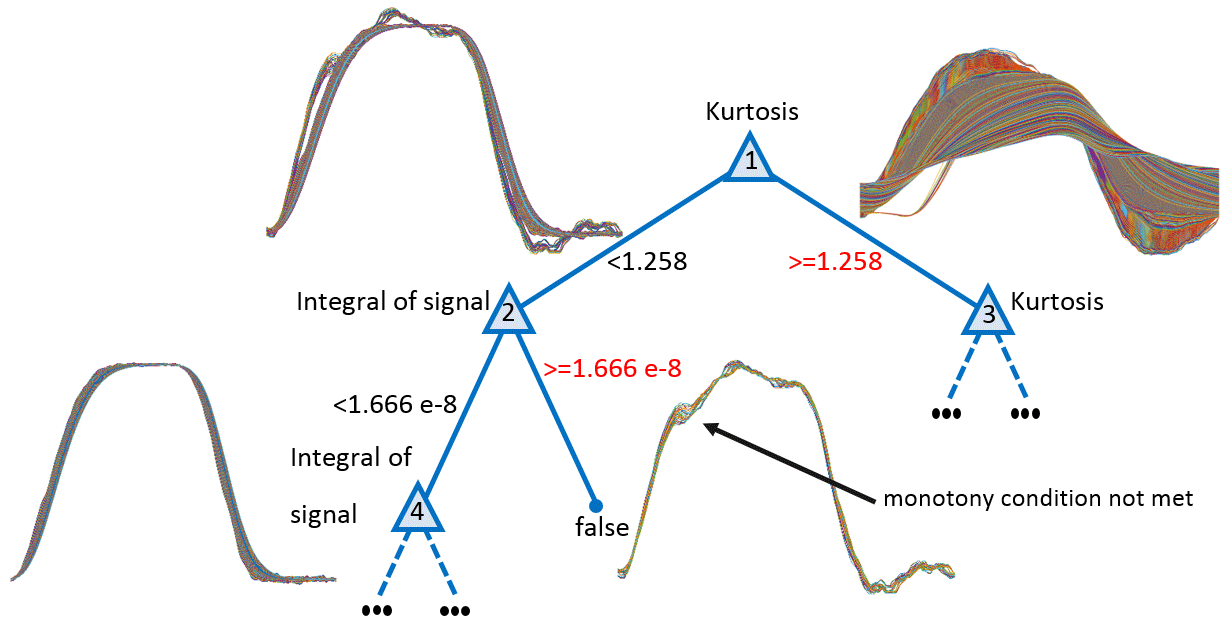
The data of the point-to-point network were labeled according to the criteria “slew rate > 1.45 [V ns−1]' and “over-/undershoot <8%”. A tree structure was created by Matlab during the training of the P2P model, which can be seen in Fig. 10. Only the first four nodes are shown to illustrate the predictions made. It can be seen that a decision is made in the root node regarding the feature “Kurtosis”. Therefore, kurtosis has the highest importance with respect to the predictions of the decision tree. Figure 11 illustrates this significance of the kurtosis. The histograms of two voltage curves with ideal and non-ideal characteristics can be seen. The histogram for the voltage curve with overshoot (Fig. 11(b)) has a higher kurtosis (more outliers) due to the deviations around the high level and is well suited as a distinguishing feature.
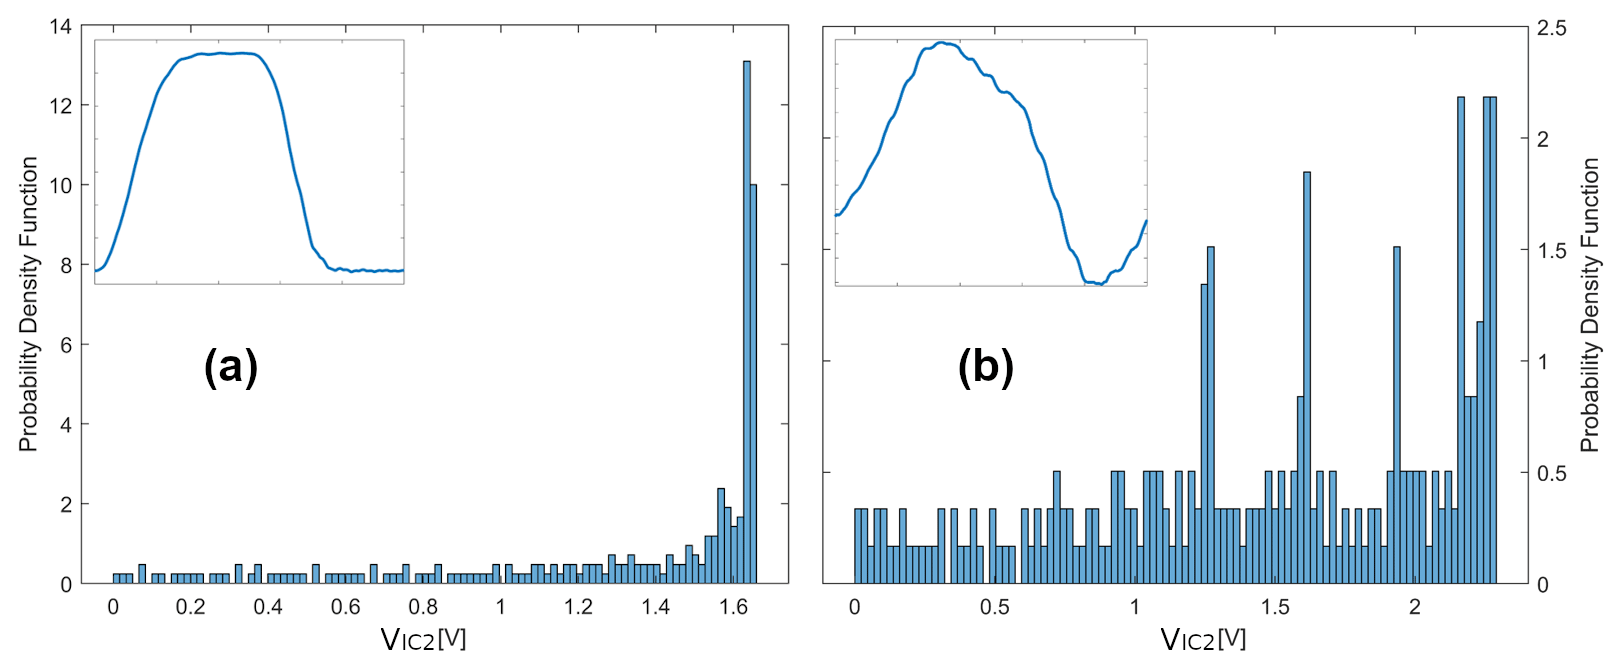
Figure 11Histograms of zero-mean waveforms with ideal and non-ideal characteristics (positive amplitudes): (a) Ideal waveform (kurtosis: 1.2281); (b) Non-ideal waveform (kurtosis: 1.5887).
Furthermore, the comprehensibility of the implemented model becomes clear by looking at the selected output voltage curves in the individual branches (see Fig. 10). By the first decision in the root node, a high proportion of curves with ideal characteristics is already selected in the left branch (“Kurtosis <1.258”). After node (2), there are no more output curves with significant over- and undershoot on the left half. The output signals on the right half are discarded due to the decision in node (2) (“Integral of the signal ”), because they show a non-monotonic behaviour outside the range “over-/undershoot <8%”.
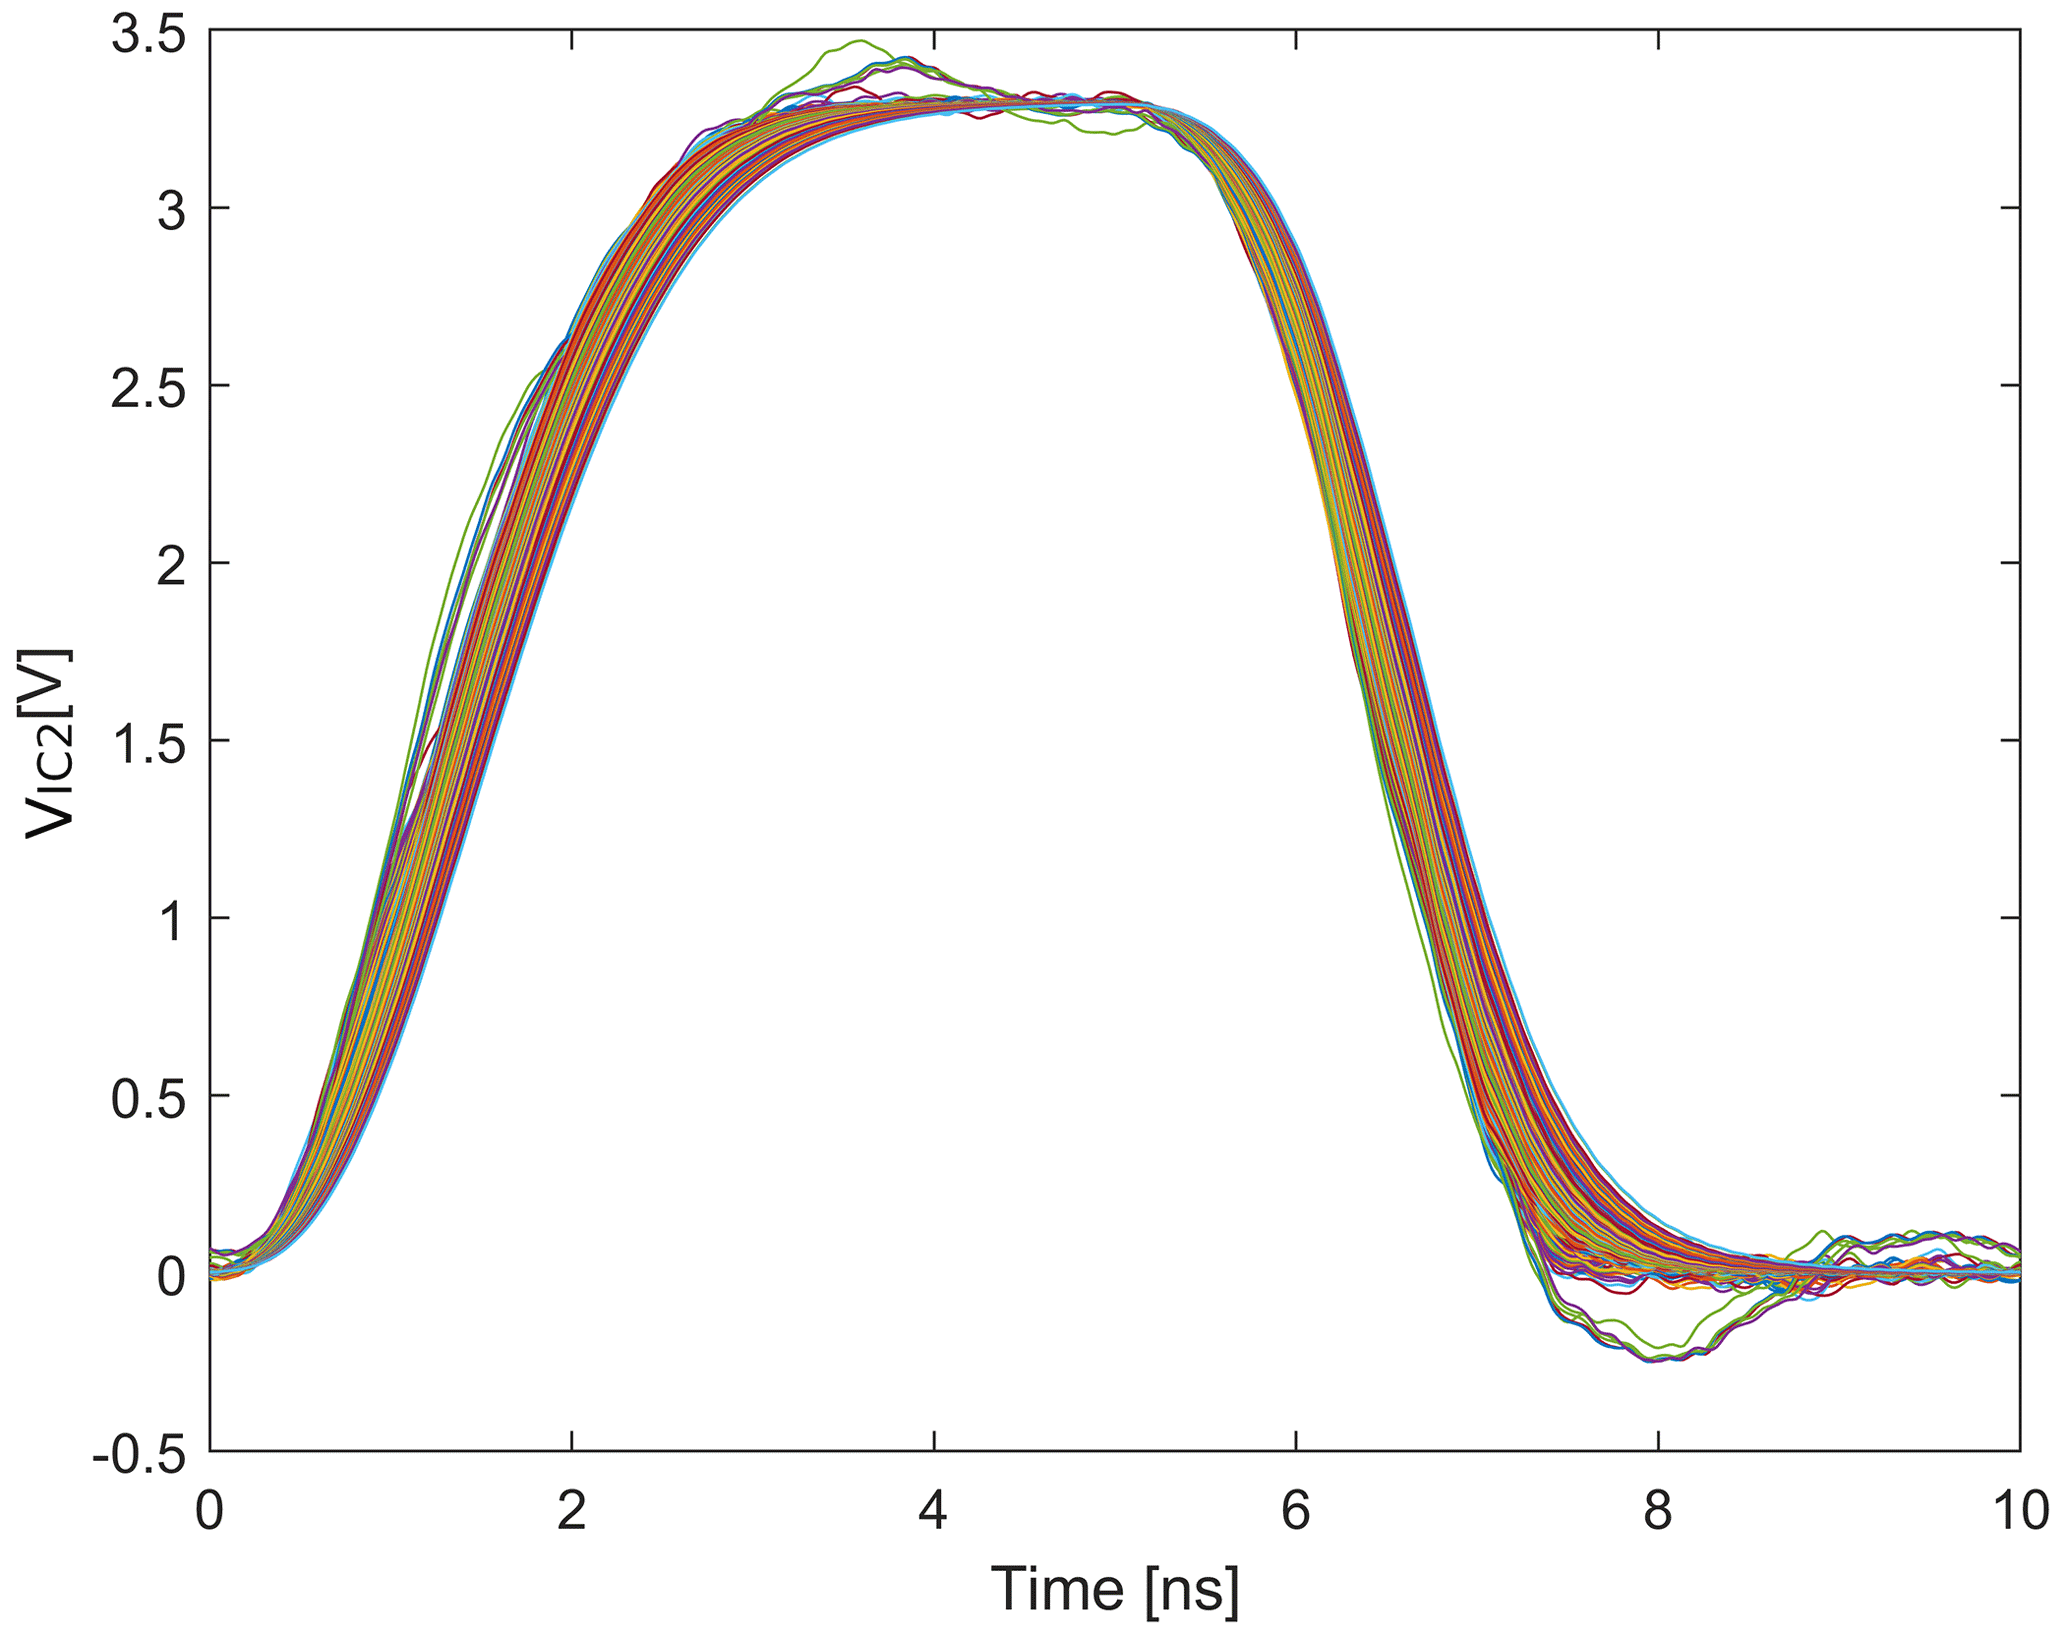
Figure 12 assesses the prediction accuracy of the implemented model. To create this confusion matrix, the test data were used and evaluated in terms of signal integrity deploying the implemented anomaly detection. The voltage curves initially labeled as ideal were also classified as ideal by the AI model with a high accuracy. These proposed waveforms are shown in Fig. 13. A brief reconsideration of the proposed curves by the designer is essential at this point. The proposals for SI compliant waveforms done by the AI model cannot be accepted directly. So, the final approval based on the designer's visual observation is inevitable in order to ensure functional safety (IEC, 2010). Furthermore, a utilization of the decisions made by the AI can still be a challenge for the designer. Depending on the parameter combinations to be assessed, the outcome may contain a significant number of SI conform waveforms as illustrated in Fig. 13. To avoid a tedious selection of SI compliant waveforms at the output of the implemented AI model, the designer could be further supported by using a k-Nearest Neighbor approach (John et al., 2022), for example. The combination of the decision tree with a Nearest Neighbor algorithm enables a rapid delimitation of the outcome by setting the factor k.
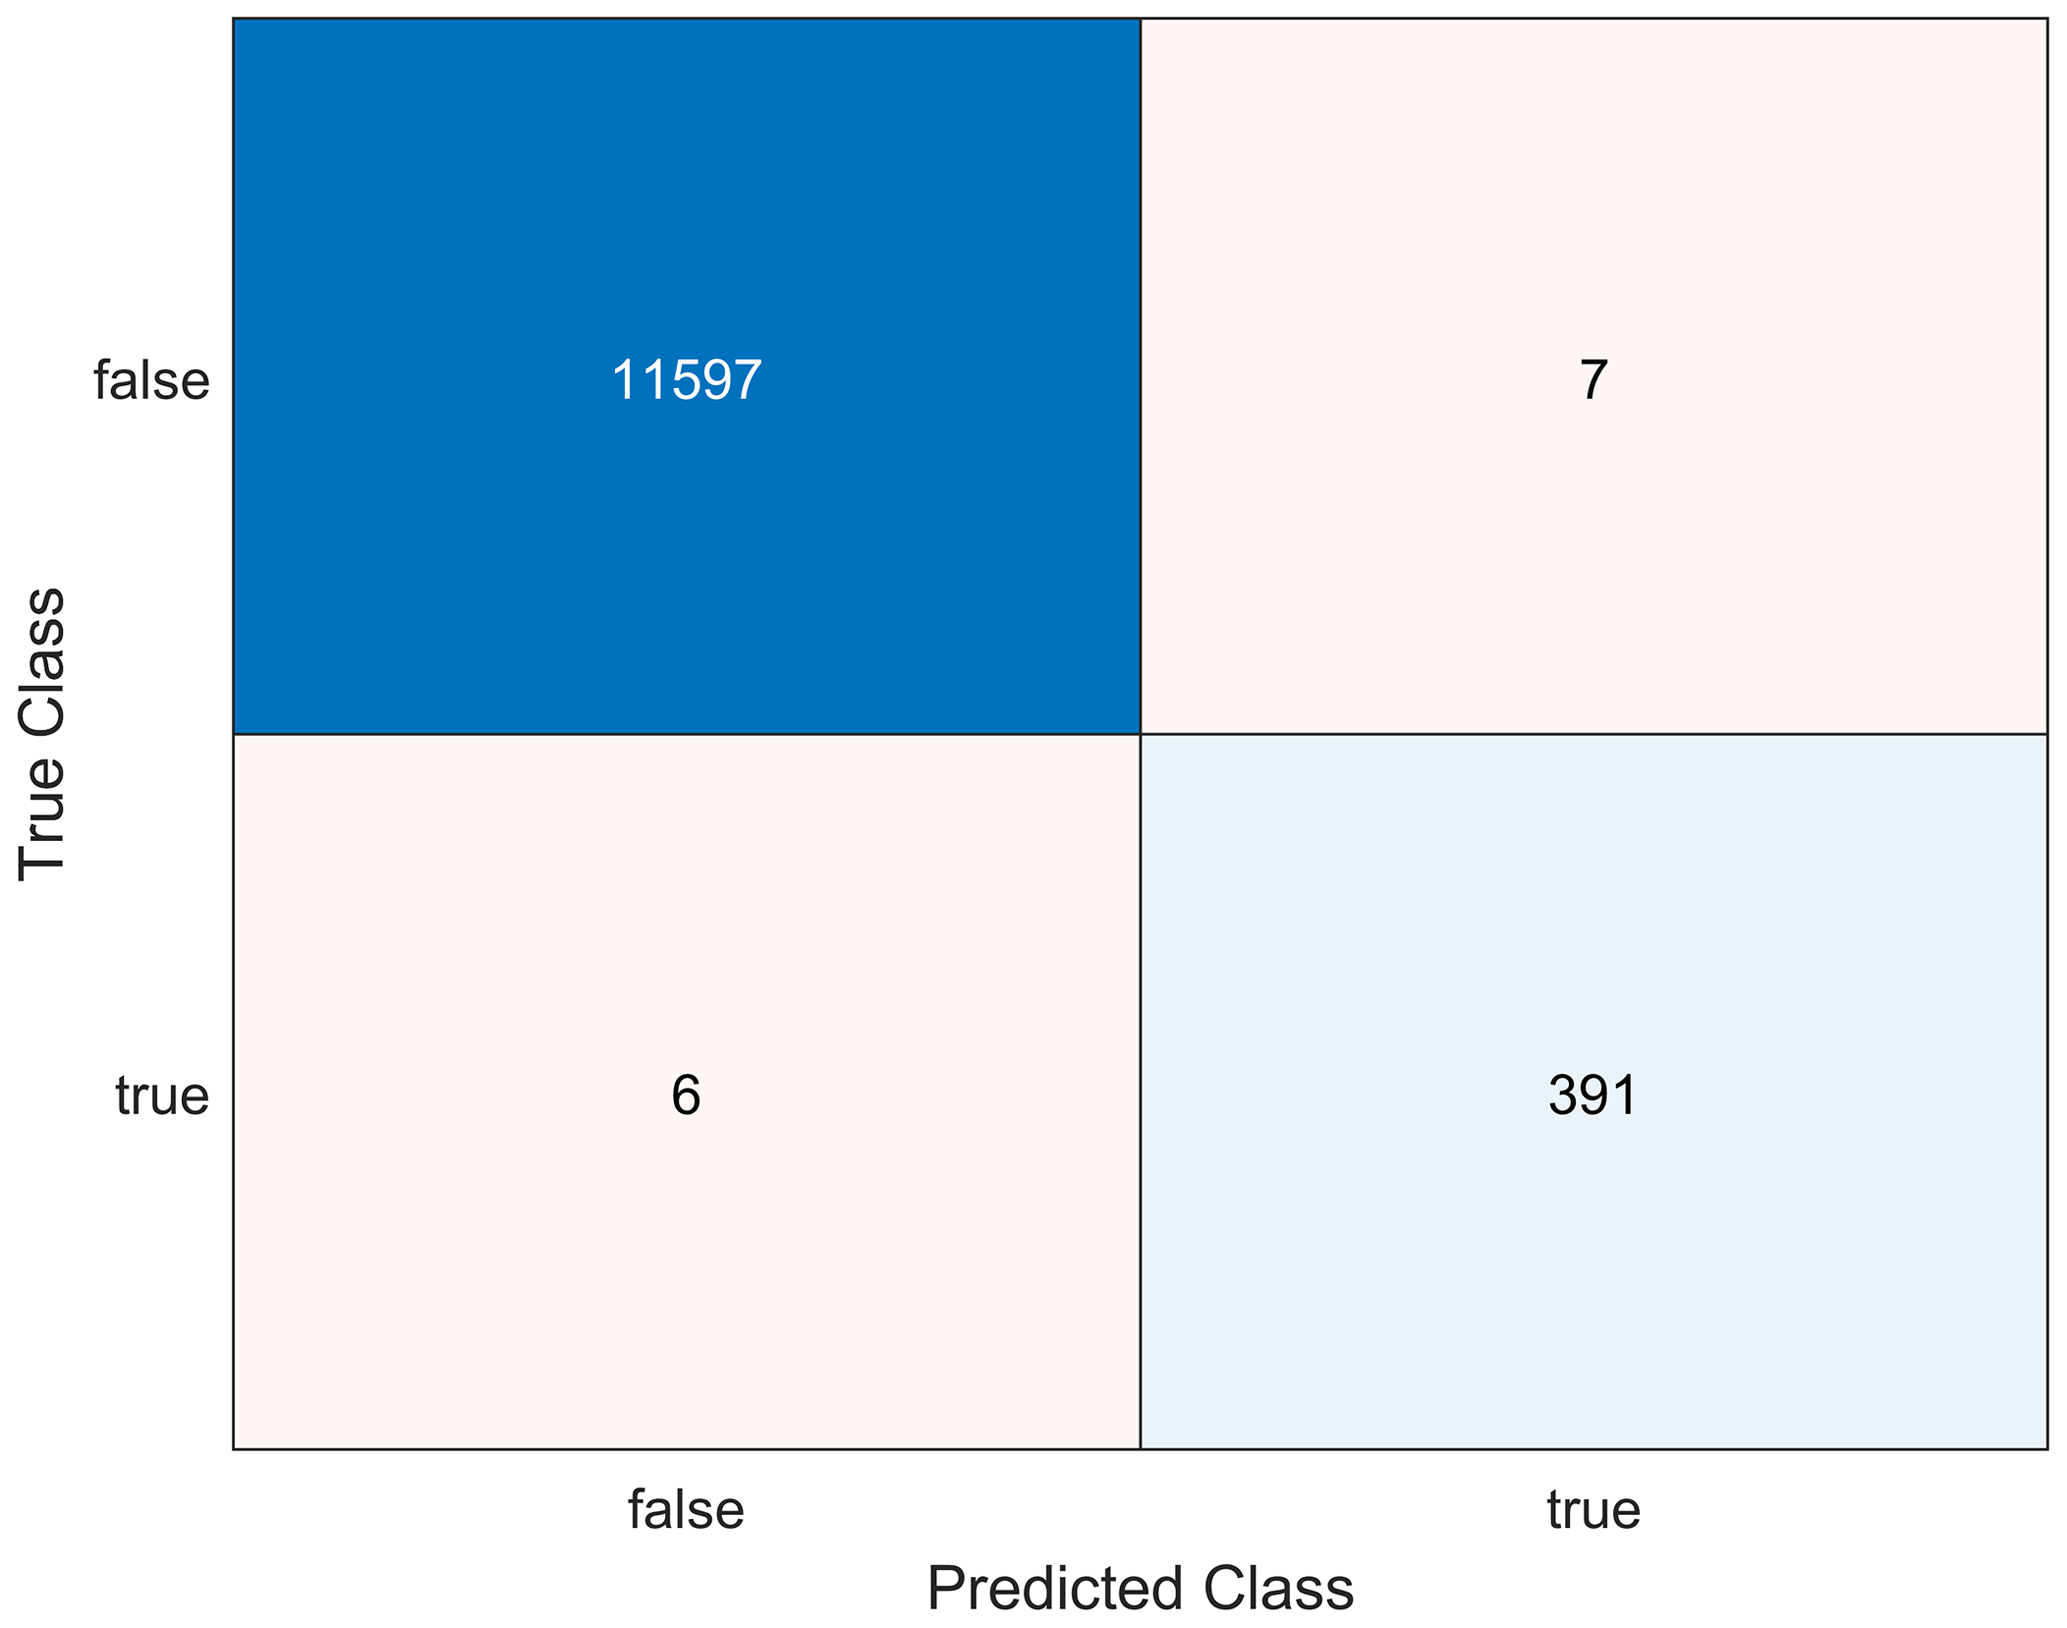
Figure 12Confusion matrix for assessing the prediction accuracy of the point-to-point model by using 20 % test data.
4.2 Utilizing the Decision Tree for the Star Point Network
The already implemented AI model from Sect. 4.1 was used to evaluate the star point network from Fig. 7 to verify the applicability of the decision tree (transfer learning). For this purpose, the training was first implemented with the parameters given in Table 4 using the P2P network.
The assessment results for the star point data set are shown in Fig. 14. The AI model, which was trained on the P2P network, was able to adequately predict SI compliant output signals in the entire data set. Out of 25 curves initially labeled as ideal waveforms, 9 voltage curves were suggested by the implemented anomaly detection (see Fig. 15).
Table 4Parameters of the point-to-point model for the verification of the transferability to the star point network.
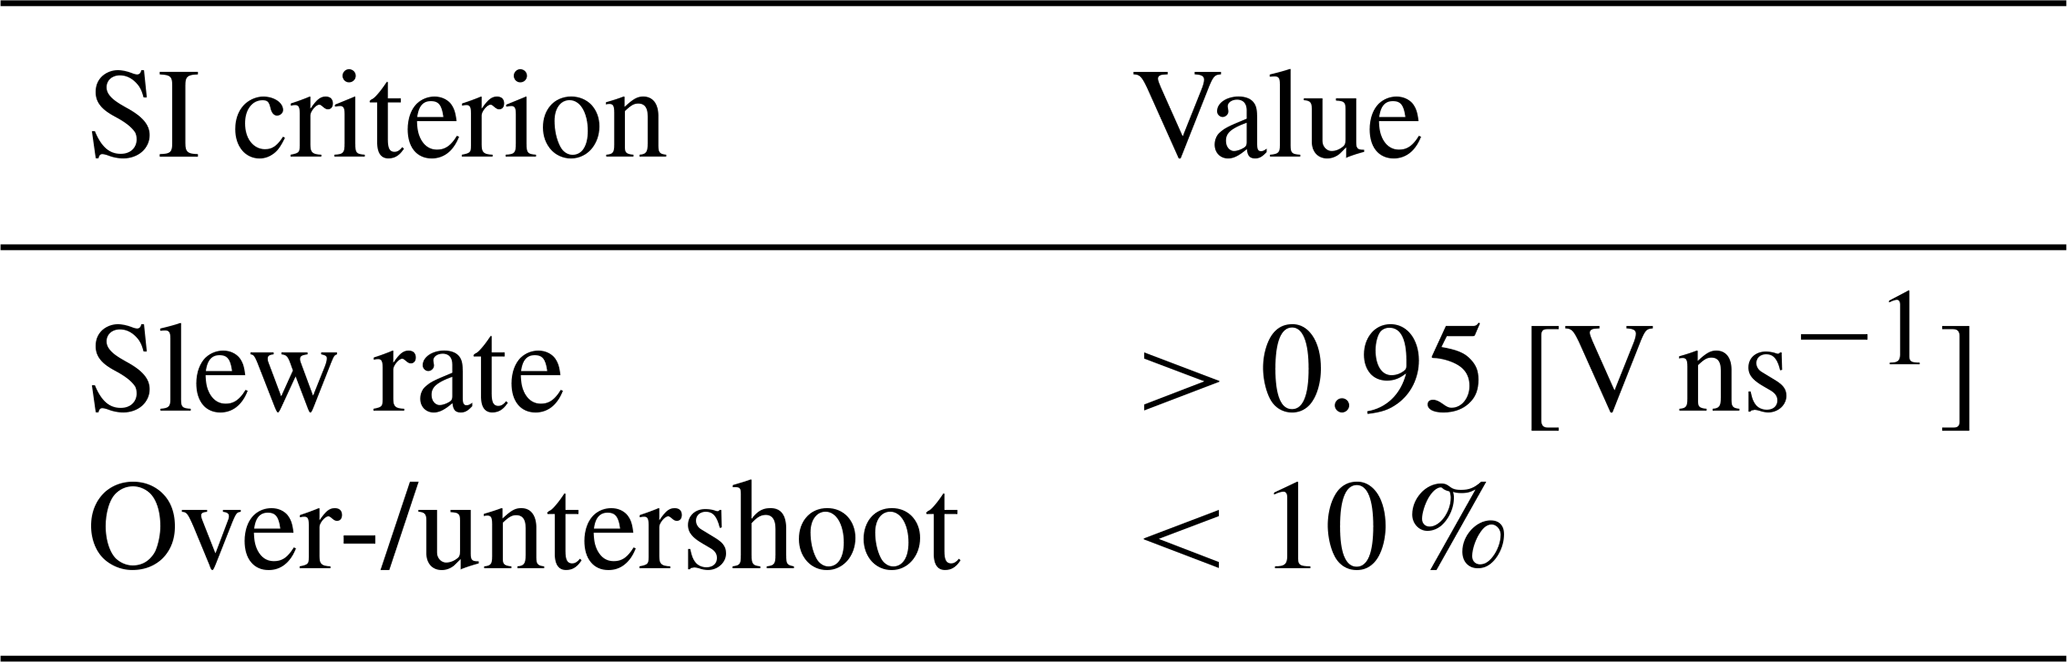
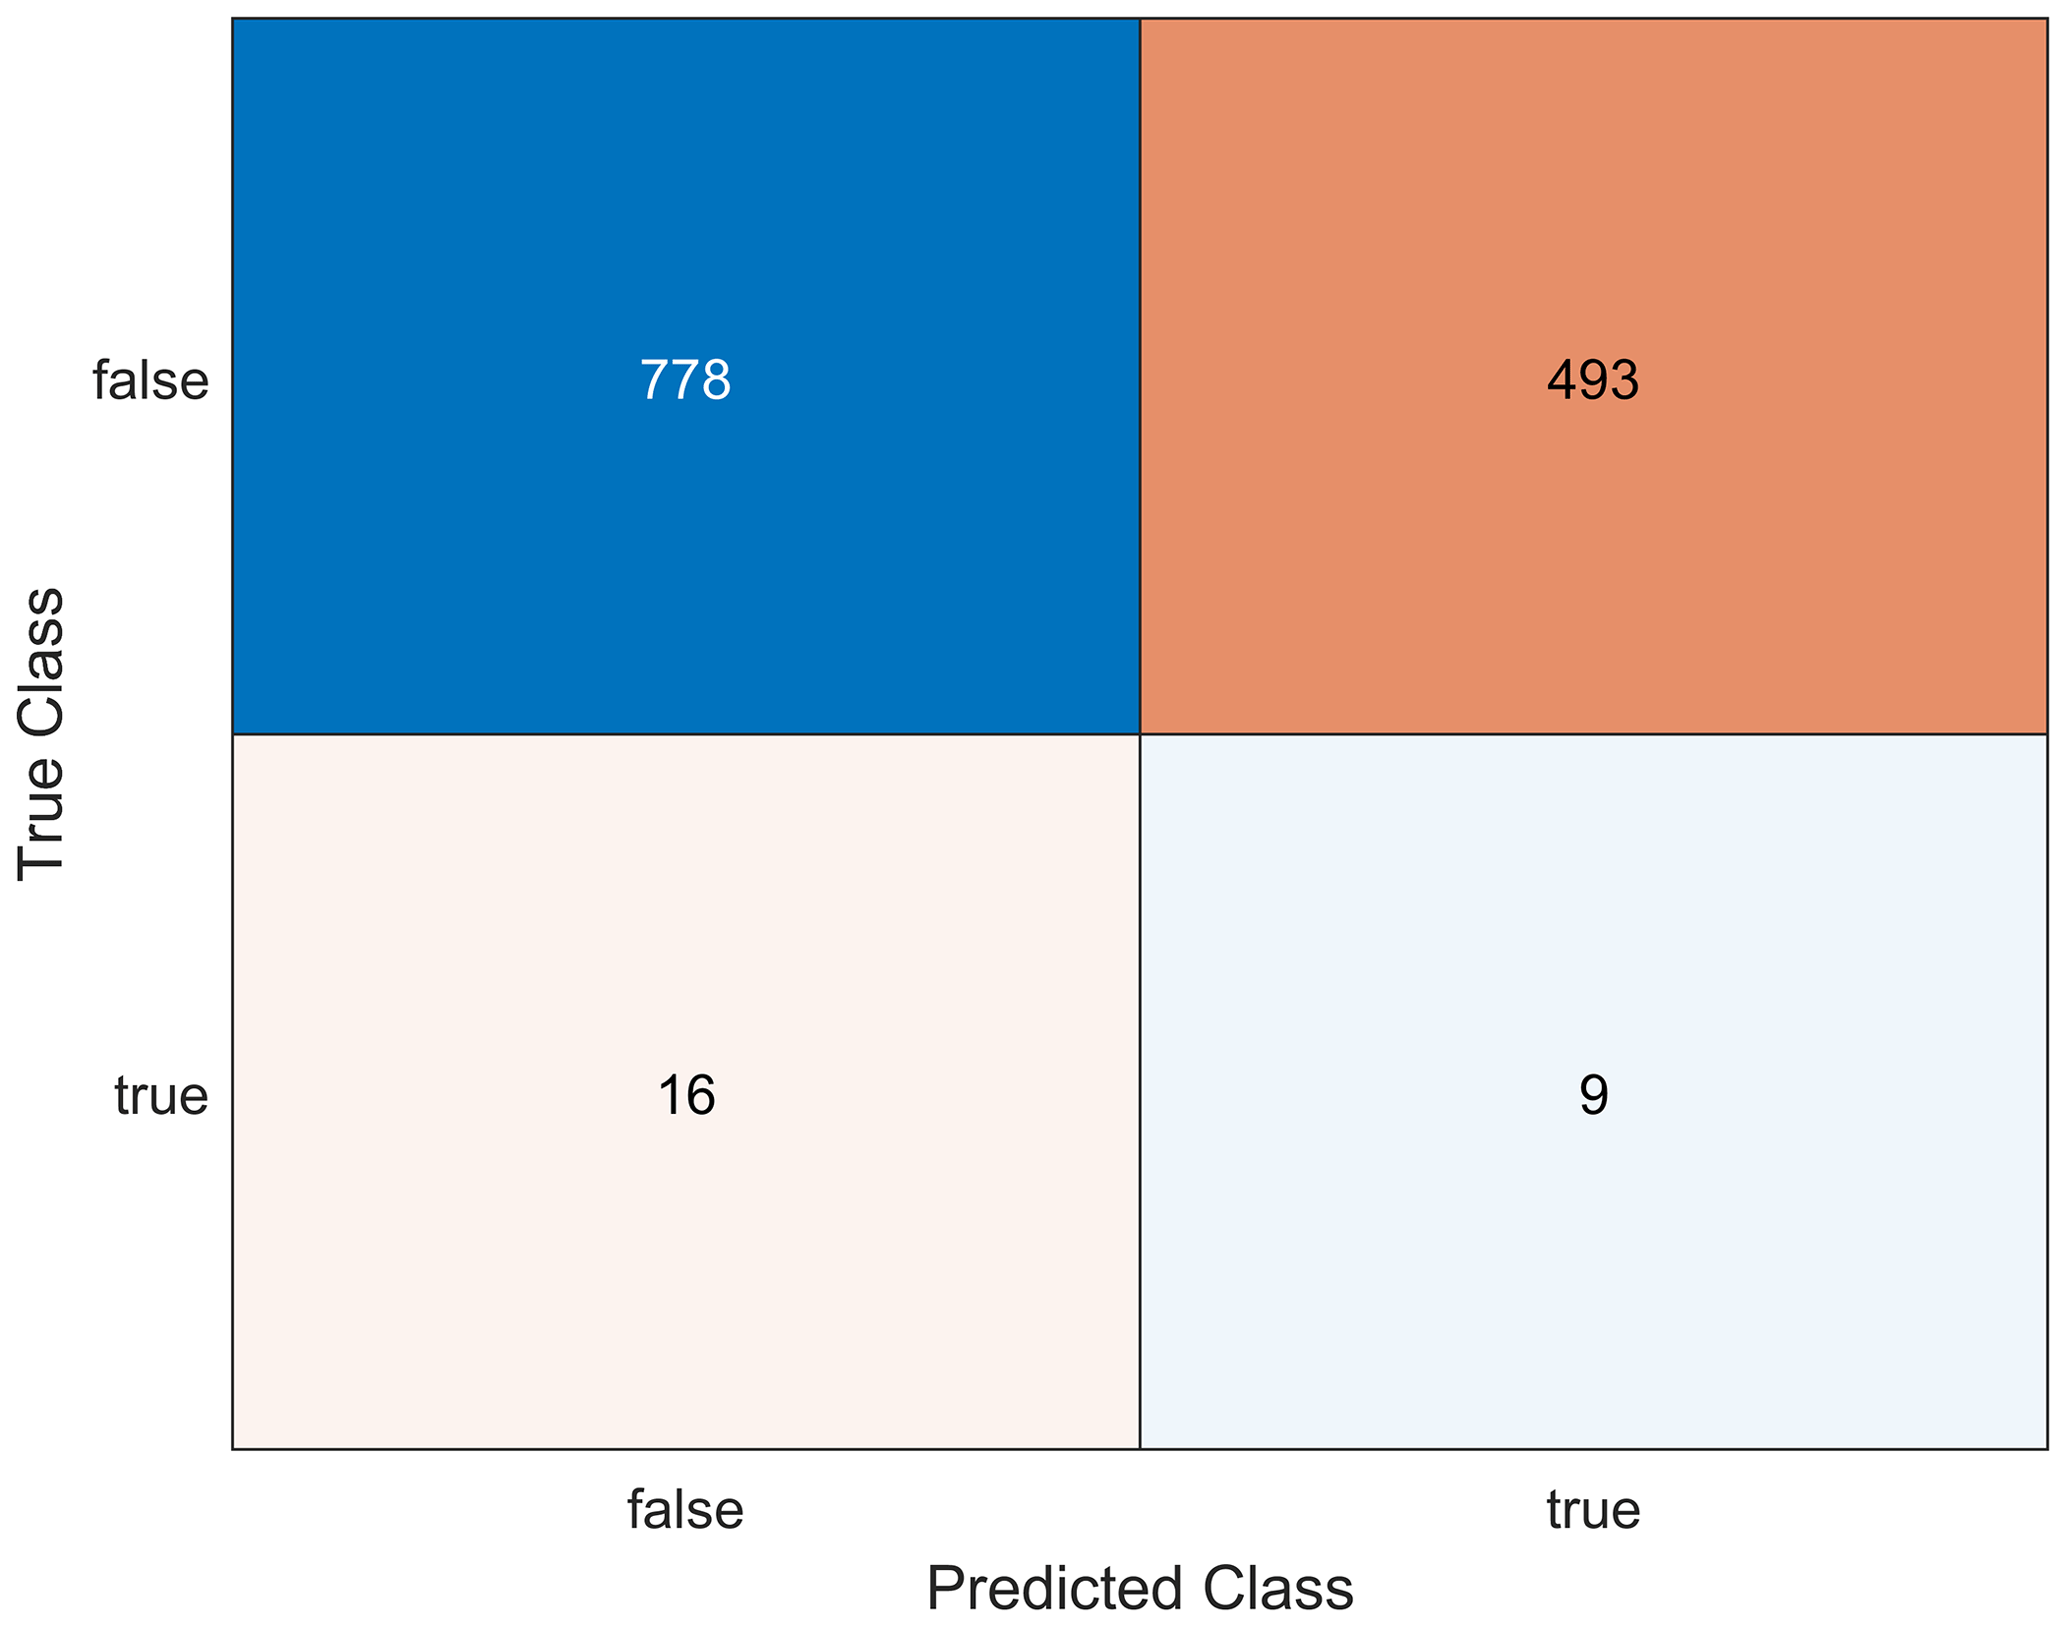
Figure 14Confusion matrix for assessing the prediction accuracy of the star point network by using the entire data set (prediction with the point-to-point model).
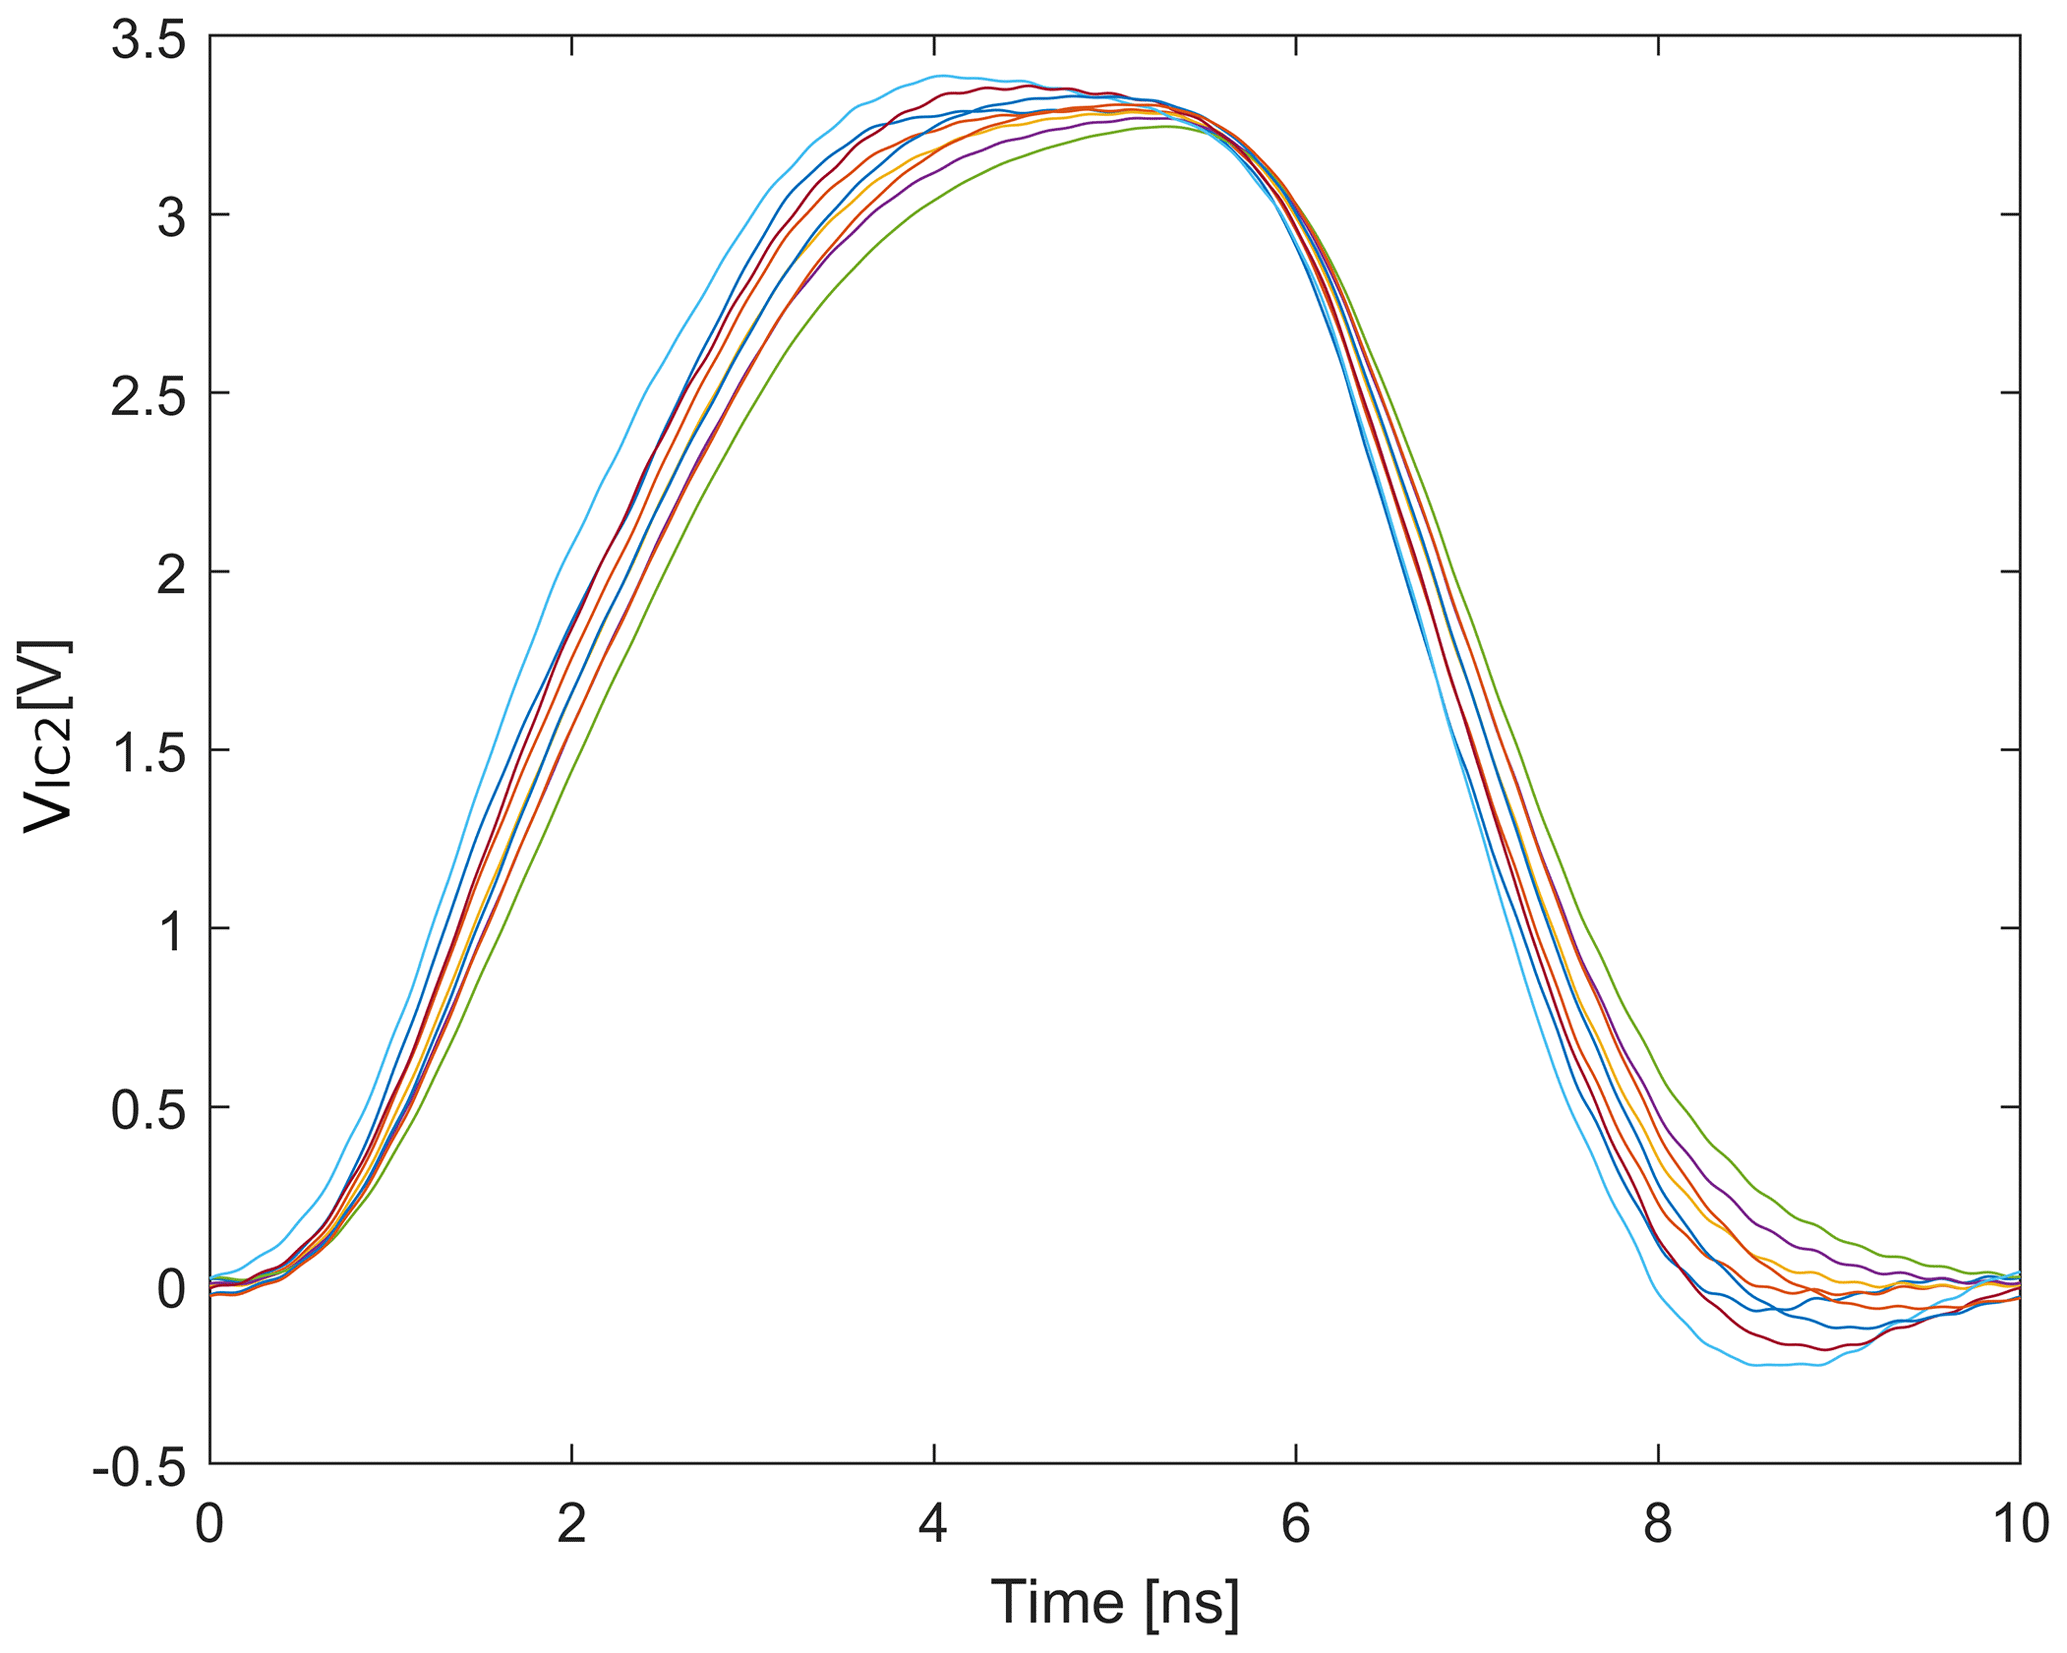
Figure 15Predicted waveforms with ideal characteristics for the star point network (with point-to-point model; 9 curves; see Fig. 14).
However, the prediction with the AI model of the P2P network had a limiting effect. Therefore, this model was extended with the star point network data to increase the prediction accuracy. The implementation of the decision tree was performed again using the parameters from Table 4 with the training data of the networks from Figs. 6 and 7. The high prediction accuracy in the case of AI model extension can be seen in Fig. 16. All voltage curves initially labeled as ideal in the star point network test data were also classified as ideal by the decision tree. The proposed output voltages with ideal characteristics are shown in Fig. 17.
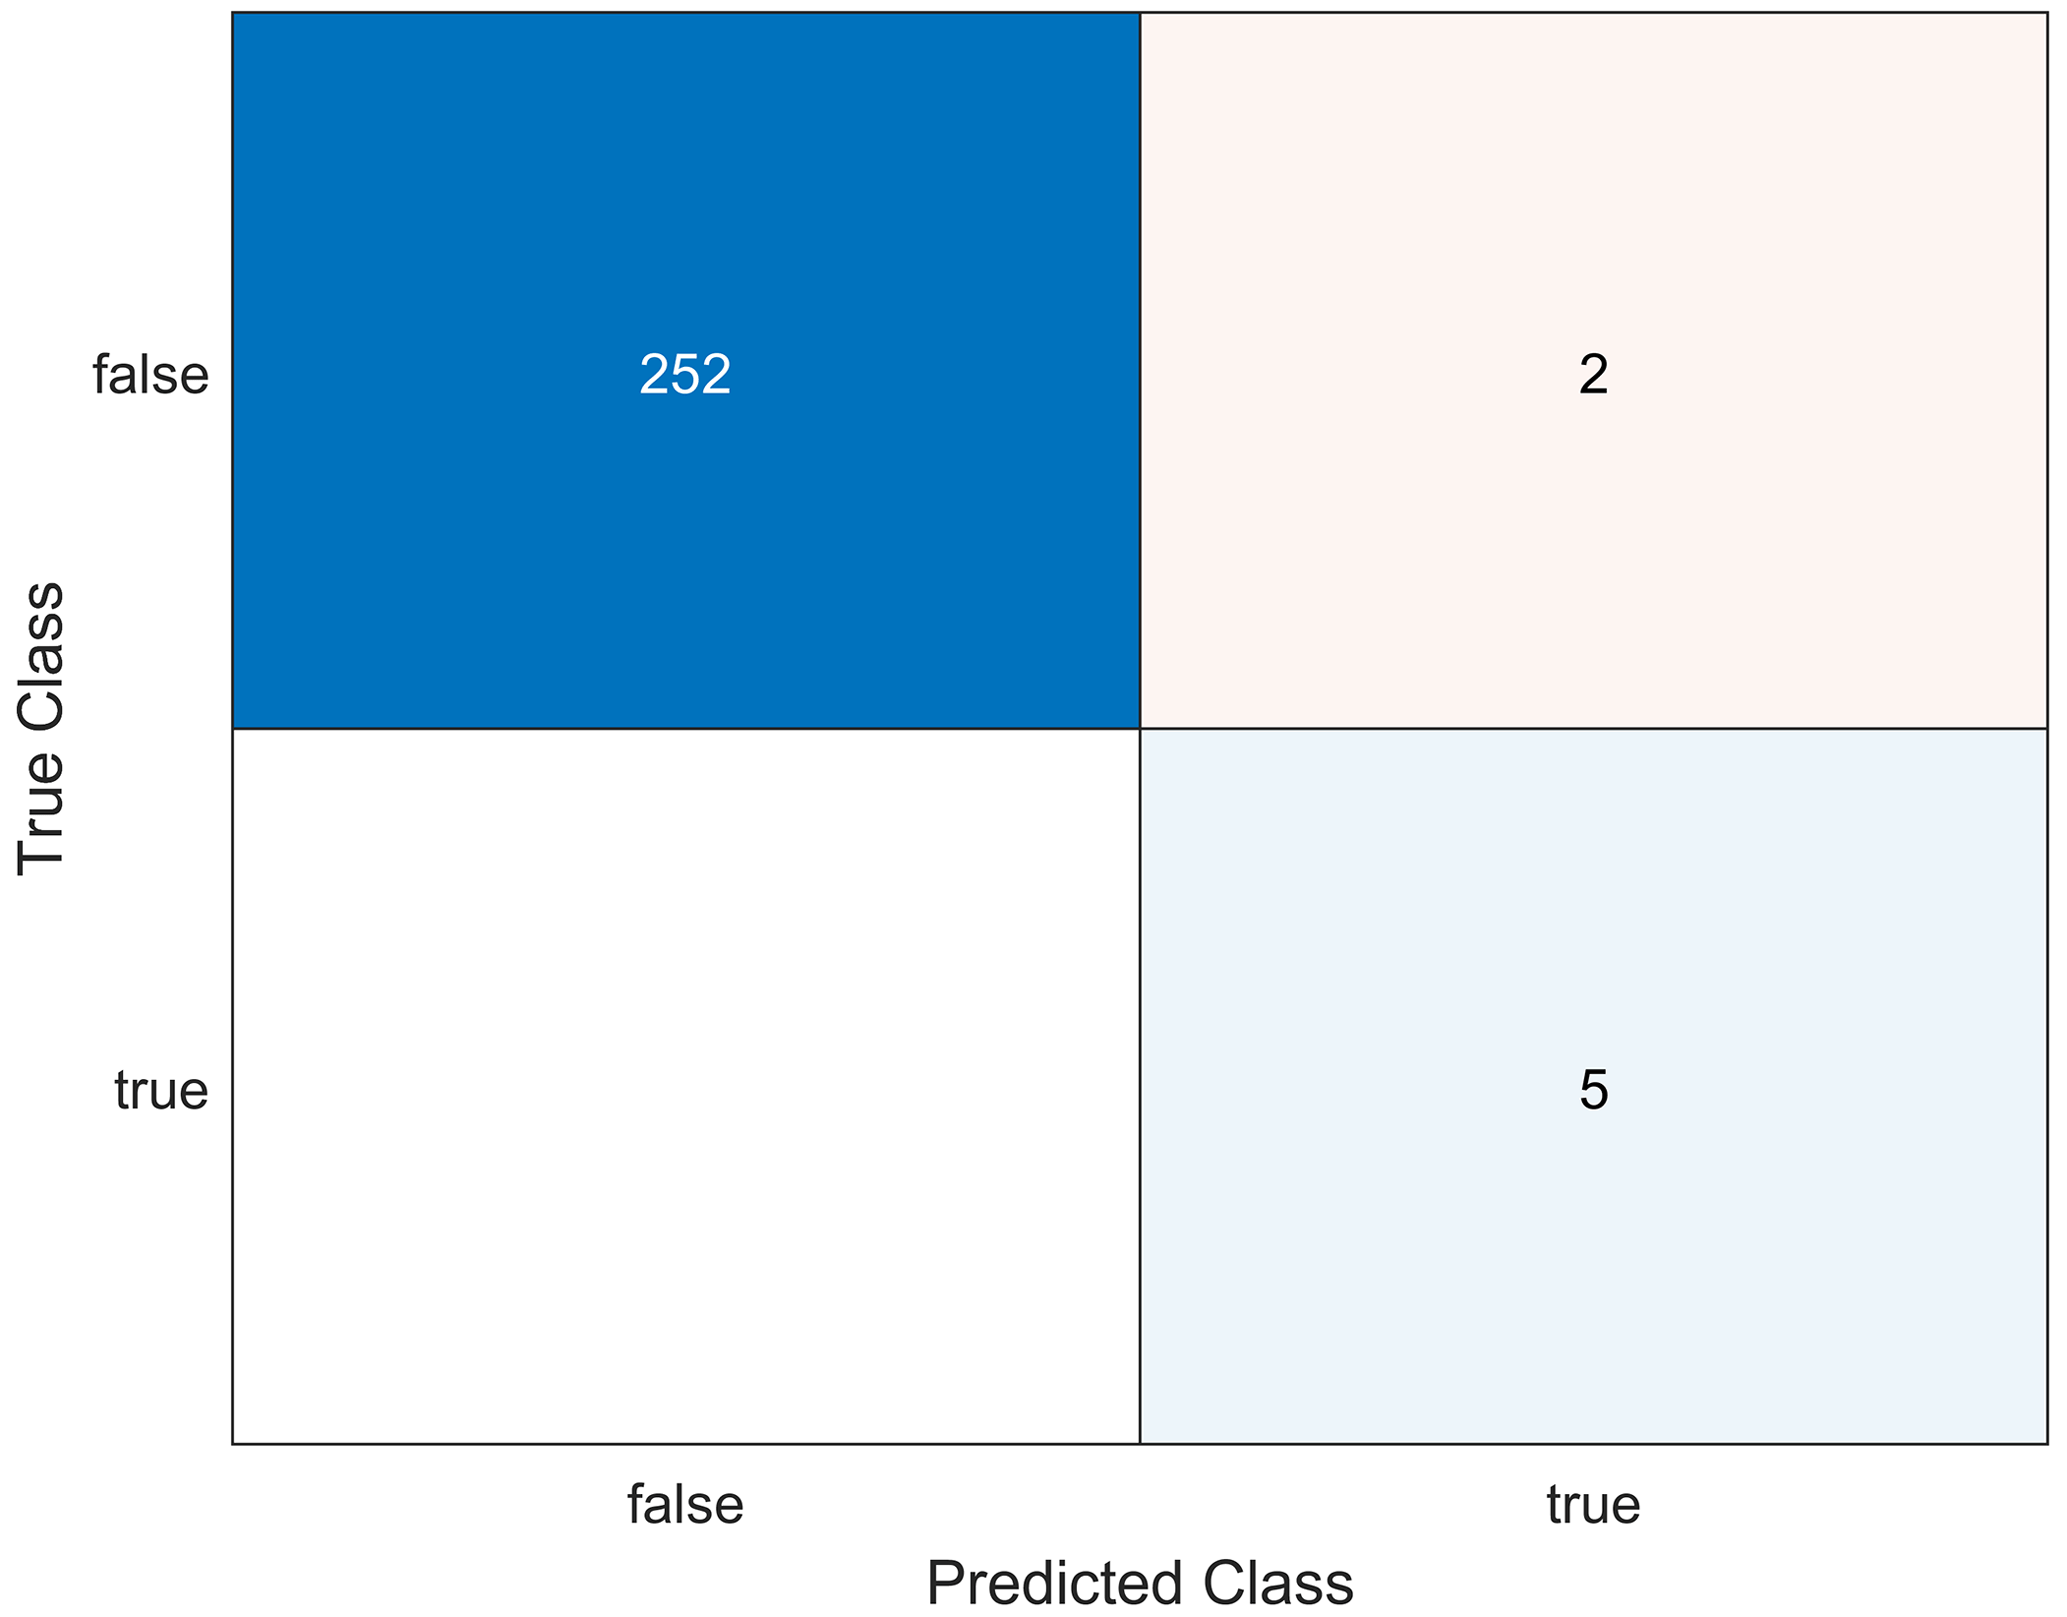
Figure 16Confusion matrix for assessing the prediction accuracy of the star point network by using 20 % test data (prediction with the extended point-to-point model).
The implementation of anomaly detection with a decision tree was investigated with respect to the evaluation of selected SI effects. Using the example of a point-to-point network, the traceability of the decisions made by the implemented AI model was shown. This approach allows the designer to utilize the presented predictions more efficiently compared to other methods such as Bayesian optimization or genetic algorithms. Furthermore, the AI model trained on the point-to-point network was used to evaluate a simple star point network (transfer learning). Output signals from two different networks, which showed SI compliant characteristics, could be predicted with one decision tree by combining the training data. High prediction accuracies were achieved. For an extension of the data set, batch operation for the star point network will be implemented in future work. Furthermore, it should be mentioned that the presented results are only valid for predefined simple transmission networks and comprise an initial investigation of the presented decision tree approach for the assessment of signal integrity effects. Consequently, further topologies have to be analyzed. A Daisy Chain Topology with a bi-directional transmitter and two input memory devices has already been implemented in another work for this purpose (Ecik et al., 2023). The implemented decision trees achieved very good accuracies. However, more complex signal topologies with more than two memory devices must be considered and additional features like pin-to-pin delay times must be included during training in future work. Most important, the validity of the presented anomaly detection with a decision tree has to be verified for various applications in circuit design, which involve a human designer making decisions.
Due to project restrictions, the source codes and datasets are not publicly available. For more information, please contact the main author.
EE elaborated the AI concepts for this part of the research topic, developed the AI models based on decision trees and the training methods. In addition, EE introduced the idea to investigate an AI model (trained on the point-to-point network) for the evaluation of a simple star point network (transfer learning). EE wrote the initial and final manuscript. WJ extended the Process Model to Integrate SI-Constraints into Electronic System Design towards a combined process and phase model in the overall concept to this paper. WJ also contributed to the understanding of the SI knowledge domain and the evaluation of prediction results (e.g., determining and understanding overshoot behavior with sufficient accuracy). He also supported the improvement of AI modules related to SI design aspects and processes. In addition, he supervised the overall research process in the progressivKI project (UseCase#2: SI PCB Design) and contributed to the improvement of the manuscript. JW supported the work on this paper with the results from the application of his developments to a two-stage AI framework. JW, WJ and JG discussed the results, contributed to the final manuscript, and provided editorial input. JG introduced the idea of implementing decision trees into the overall concept. In addition, JG supervised the entire research process at the TU Dortmund (Information Processing Lab) and performed the final review.
The contact author has declared that none of the authors has any competing interests.
Publisher’s note: Copernicus Publications remains neutral with regard to jurisdictional claims made in the text, published maps, institutional affiliations, or any other geographical representation in this paper. While Copernicus Publications makes every effort to include appropriate place names, the final responsibility lies with the authors.
This article is part of the special issue “Kleinheubacher Berichte 2022”. It is a result of the Kleinheubacher Tagung 2022, Miltenberg, Germany, 27–29 September 2022.
We would like to thank Ralf Brüning (EMC Technology Center Paderborn – Zuken GmbH), who supported us during the generation of data with the software eCADSTAR (Zuken Ltd., 2022).
This work is funded as part of the research project progressivKI (https://www.edacentrum.de/projekte/progressivKI, last access: 9 October 2023) in the funding programme NFST by the Bundesministerium für Wirtschaft und Klimaschutz (BMWK) of the Federal Republic of Germany (Grant number 19A21006O). The responsibility for this publication is held by the authors only.
This paper was edited by Thomas Kleine-Ostmann and reviewed by two anonymous referees.
Ambasana, N., Bhatti, O. W., Dolatsara, M. A., Swaminathan, M., Yang, X., Paladhi, P. R., and Becker, W. D.: Invertible Neural Networks for High-Speed Channel Design & Parameter Distribution Estimation, 2021 IEEE 30th Conference on Electrical Performance of Electronic Packaging and Systems (EPEPS), Austin, USA, 17–20 October 2021, 1–3, https://doi.org/10.1109/EPEPS51341.2021.9609225, 2021. a
Bortolazzi, J. and Müller-Glaser, K.D.: Rechnergestützte Spezifikation in einer integrierten Entwurfsumgebung für anwendungsspezifische Systeme, in: Rechnergestützter Entwurf und Architektur mikroelektronischer Systeme, Informatikfachberichte, 255, edited by: Reusch, B., Springer, Berlin, Heidelberg, Germany, 75–90, https://doi.org/10.1007/978-3-642-84304-4_8, 1990. a
Breiman, L., Friedman, J. H., Olshen, R. A., and Stone, C. J.: Classification and Regression Trees, Chapman & Hall/CRC, New York, USA, ISBN 978-0-412-04841-8, 1984. a
Casas, P., Fiadino, P., and D'Alconzo, A.: Machine-Learning Based Approaches for Anomaly Detection and Classification in Cellular Networks, in: Proceedings of the 8th International Workshop on Traffic Monitoring and Analysis, TMA 2016, Louvain la Neuve, Belgium, 7–8 April, ISBN 978-3-901882-92-0, 2016. a, b
Ecik, E., John, W., Withöft, J., Brüning, R., and Götze, J.: Signal Integrity Design of PCB Transmission Paths using a Decision Tree Approach, 2023 International Symposium on Electromagnetic Compatibility – EMC Europe, Krakow, Poland, 1–6, https://doi.org/10.1109/EMCEurope57790.2023.10274174, 2023. a
Hess, S.: https://community.cadence.com/cadence_blogs_8/b/pcb/posts/shift-left-moving-multiphysics-into-the-mainstream (last access: 9 October 2023), 19 July 2022. a
IEC International Electrotechnical Commission: Functional safety of electrical/electronic/programmable electronic safety-related systems, VDE-Verlag, IEC 61508:2010 CMV, VDE Art. No. 217360, 2010. a
JEDEC Solid State Technology Association: DDR3 SDRAM Standard, Standard No. JESD79-3F, 2012. a, b
John, W.: Support of printed circuit board design by an EMC-workbench, in: 10th International Zurich Symposium and Technical Exhibition on Electromagnetic Compatibility, EMC Zurich 93, Zurich, Switzerland, 9–11 March, 35G2, 1993. a, b
John, W.: Electronic Design under EMC Constraints, in: 11th International Zurich Symposium and Technical Exhibition on Electromagnetic Compatibility, EMC Zurich 95, Zurich, Switzerland, 7–9 March, 101P1, 541–548, 1995. a, b
John, W.: EMC of Printed Circuit Boards and Microelectronic Engineering Techniques, in: 13th International Wroclaw Symposium and Technical Exhibition on Electromagnetic Compatibility, EMC Wroclaw 96, Wroclaw, Poland, 25–28 June, 1996. a, b, c, d
John, W., Withöft, J., Ecik, E., Brüning, R., and Götze, J.: A Practical Approach Based on Machine Learning to Support Signal Integrity Design, 2022 International Symposium on Electromagnetic Compatibility – EMC Europe, Gothenburg, Sweden, 5–8 September 2022, 623–628, https://doi.org/10.1109/EMCEurope51680.2022.9901213, 2022. a, b, c, d, e, f, g
Joshi, M. V., Agarwal, R. C., and Kumar, V.: Predicting rare classes: Can boosting make any weak learner strong?, in: Proceedings of the eighth ACM SIGKDD international conference on Knowledge discovery and data mining, KDD02, Edmonton, Canada, 23–26 July, 297–306, https://doi.org/10.1145/775047.775092, 2002. a
Lai, J.-P., Lin, Y.-L., Lin, H.-C., Shih, C.-Y., Wang, Y.-P., and Pai, P.-F: Tree-Based Machine Learning Models with Optuna in Predicting Impedance Values for Circuit Analysis, Micromachines 2023, 14, 265, https://doi.org/10.3390/mi14020265, 2023. a
Li, X.and Hu, Q.: A Machine Learning based Channel Modeling for High-speed Serial Link, 2020 IEEE 6th International Conference on Computer and Communications (ICCC), Chengdu, China, 11–14 December 2020, 1511–1515, https://doi.org/10.1109/ICCC51575.2020.9345183, 2020. a
Lu, T., Sun, J., Wu, K., and Yang, Z.: High-Speed Channel Modeling With Machine Learning Methods for Signal Integrity Analysis, IEEE T. Electromagn. C., 60, 1957–1964, https://doi.org/10.1109/TEMC.2017.2784833, 2018. a, b
Ma, H., Li, E.-P., Cangellaris, A. C., and Chen, X.: Comparison of Machine Learning Techniques for Predictive Modeling of High-Speed Links, 2019 IEEE 28th Conference on Electrical Performance of Electronic Packaging and Systems (EPEPS), Montreal, Canada, 6–9 October 2019, 1–3, https://doi.org/10.1109/EPEPS47316.2019.193199, 2019. a
Marinova, G.: Comparative study of electromagnetic compatibility methods in printed circuit board design tools, in: 3. Japanese-Bulgarian-Macedonian Joint Seminar on Applied Electromagnetics, Ohrid, Macedonia (The Former Yugoslav Republic of), 15–17 September 2000, 248–254, MK0500064, 2002. a
Medico, R., Spina, D., Ginste, D. V., Deschrijver, D., and Dhaene, T.: Machine-Learning-Based Error Detection and Design Optimization in Signal Integrity Applications, IEEE T. Compon. Pack. Man., 9, 1712–1720, https://doi.org/10.1109/TCPMT.2019.2916902, 2019. a
Moura, U. C. de, Ros, F. D., Zibar, D., Brusin, A. M. R., and Carena, A.: Machine learning applied to inverse systems design, International Conference on Optical Network Design and Modeling (ONDM), Warsaw, Poland, 16– 19 May 2022, 1–3, https://doi.org/10.23919/ONDM54585.2022.9782836, 2022. a
Quinlan, J. R.: C4.5: Programs for Machine Learning, Morgan Kaufmann Publishers Inc., Morgan Kaufmann series in machine learning, San Francisco, CA, USA, ISBN 1-55860-238-0, 1993. a
Schefström, D. and van den Broek, G. (Eds.): Tool Integration: Environments and Frameworks, Wiley Series in Software Based Systems, John Wiley & Sons, ISBN 0-471-93554-9, 1993. a
Segal, M. R.: Machine Learning Benchmarks and Random Forest Regression, Center for Bioinformatics and Molecular Biostatistics, University of California, San Francisco, 2004. a
Smola, A. J. and Schölkopf, B.: A tutorial on support vector regression, Stat. Comput., 14, 199–222, https://doi.org/10.1023/B:STCO.0000035301.49549.88, 2004. a
Stoyanov, M.: User manual: Tasmanian sparse grids, Oak Ridge National Laboratory, One Bethel Valley Road, Oak Ridge, ORNL/TM-2015/596, 2015. a
The MathWorks, Inc.: MATLAB (version 2022b), MathWorks [software], https://www.mathworks.com/ (last access: 9 October 2023), 2022. a, b
Torun, H. M., Larbi, M., and Swaminathan, M.: A Bayesian Framework for Optimizing Interconnects in High-Speed Channels, 2018 IEEE MTT-S International Conference on Numerical Electromagnetic and Multiphysics Modeling and Optimization (NEMO), Reykjavik, Iceland, 8–10 August 2018, 1–4, https://doi.org/10.1109/NEMO.2018.8503097, 2018. a, b
Trinchero, R. and Canavero, F.: Machine Learning Regression Techniques for the Modeling of Complex Systems: An Overview, IEEE Electromagnetic Compatibility Magazine, 10, 71–79, https://doi.org/10.1109/MEMC.2021.9705310, 2021. a
Weiss, G. M. and Hirsh, H.: Learning to predict rare events in event sequences, in: Proceedings of the Fourth International Conference on Knowledge Discovery and Data Mining, KDD98, 27–31 August, New York, USA, ISBN 1-57735-070-7, 359–363, 1998. a
Zhang, H. H., Xue, Z. S., Liu, X. Y., Li, P., Jiang, L., and Shi, G. M.: Optimization of High-Speed Channel for Signal Integrity With Deep Genetic Algorithm, IEEE T. Electromagn. C., 64, 1270–1274, https://doi.org/10.1109/TEMC.2022.3161298, 2022. a
Zhang, T., Chen, S., Wei, S., and Chen, J.: A Fast Signal Integrity Design Model of Printed Circuit Board based on Monte-Carlo Tree, 2019 IEEE 13th International Conference on ASIC (ASICON), Chongqing, China, 29 October–1 November 2019, 1–4, https://doi.org/10.1109/ASICON47005.2019.8983610, 2019. a
Zuken Ltd.: CR-5000 Lightning 21.0 Training Manual (TM-HT-969-E-10), Zuken Ltd. [manual], https://www.zuken.com (last access: 9 October 2023), 2021.
Zuken Ltd.: eCADSTAR Electrical Editor (version 2022.0.3.214), Zuken Ltd. [software], https://www.zuken.com (last access: 9 October 2023), 2022. a, b, c, d
- Abstract
- Introduction
- Methodology
- Description of Used Networks and Data Processing
- Training and Deployment of the Decision Trees
- Conclusions
- Code and data availability
- Author contributions
- Competing interests
- Disclaimer
- Special issue statement
- Acknowledgements
- Financial support
- Review statement
- References