 | 26 Mar 2025
Frequency-Dependent Variations of the Antenna Reflection Coefficient Due to Different Wetness Conditions on the Antenna Radome
Christian Chwala
Uwe Siart
Thomas F. Eibert
It is investigated how the antenna reflection coefficient (ARC) of directional radio link antennas changes over time when the antenna radome gets wet and dries off afterwards. A hand sprayer is used to deposit droplets on antenna radomes manually. Next, ARC measurements are performed repeatedly using a vector network analyzer and the ARC variation over time and frequency during the drying process is recorded into consecutive frequency response data sets. These vividly demonstrate a continuous drift from the altered, i.e., wet state back to the initial dry state.
Previous work has shown that the ARC is a very useful reference for determining the wet antenna attenuation (WAA) that occurs during and also after rain events. It did, however, not explain the observed significant differences in the relation between ARC and WAA with different antennas and at individual frequencies.
Inverse Fourier transforms of the recorded frequency domain ARC show a clustered concentration of variations within the unambiguous range in the near vicinity of the antenna. This supports the assumption that the changes in ARC are exclusively caused by moisture on the radome. Our findings match with measurements from previous investigations, reaffirm the expedient value of ARC to support WAA estimates, and explain why different antennas exhibit very different ARC-WAA relations.
- Article
(4262 KB) - Full-text XML
- BibTeX
- EndNote


Among the many applications of opportunistic sensing, rain rate estimation based on path-fading data from commercial microwave links (CMLs) has become established (Graf et al., 2020; Overeem et al., 2021). Captured time series of the measured path loss of a CML are evaluated to determine the rain rate along the link path. This method has been developed into a common procedure for quantitative precipitation estimation (QPE). Supposed that the two antennas of a CML are sufficiently far apart from each other, far-field conditions may be assumed. The well-defined clear sky propagation conditions during dry periods yield an estimate for the path loss baseline. Any additional attenuation above the baseline is induced by actual precipitation and also by water wetting on the surface of the antenna radome (Pastorek et al., 2022). The accuracy of CML-QPE can be significantly deteriorated by the additional contribution to path loss caused by water droplets on the antenna radome. This error source, commonly referred to as wet antenna attenuation (WAA), exists during and also after a precipitation event.
There exist several approaches to estimate and subtract the path loss contribution by WAA in the CML data processing before applying the k-R-relation to estimate the path-averaged rain rate R from the measured specific attenuation k. One approach is to model WAA as an exponentially increasing and decreasing process over time (Schleiss et al., 2013). Another way is to model WAA as a rain-rate-dependent process. This can be done by assuming a continuous flat water film on the antenna radome (Leijnse et al., 2008) with the film thickness depending on the rain rate. Electromagnetic calculations then yield an estimate for WAA. Observations, however, show that water forms small drops or runlets on the radome rather than a homogeneous film. Additional uncertainties of this model stem from the fact that there is a significant impact of radome thickness and the dielectric properties of the radome material, which are typically not known when processing CML data. A simplified rain-rate-dependent model, solely relying on one parameterized relation between rain rate and WAA (Pastorek et al., 2022), can, thus, do a similar or better job. To increase the accuracy of CML-QPE, broadening the understanding of the underlying processes of WAA is needed so that WAA modeling can be improved.
From an electromagnetic point of view, water drops are lossy dielectric scatterers. Drops and runlets can strongly interact with the near field of a reflector antenna when they are located directly on the antenna radome. By dissipating and scattering of the incident electromagnetic near field, they lower the antenna efficiency and also affect the far-field directivity pattern. As a consequence, the effective far-field performance of a CML antenna can be significantly deteriorated by wetness on the radome. This constitutes the WAA effect and contributes to the total observed path loss just like rain attenuation on the path between the antennas.
The multitude of individual effects, such as scattering at individual drops, the electromagnetic interaction of the differently sized drops with each other and the dissipation of radiation within drop volumes makes it very difficult to model and predict WAA quantitatively for a given CML antenna and operating frequency. As another approach to estimate WAA, previous investigations (Tiede et al., 2023) showed a strong correlation between the presence of water residuals on an antenna radome and the antenna reflection coefficient (ARC). These studies were conducted using data from a dedicated field experiment (Moroder et al., 2020) and have demonstrated that ARC data availability could generally allow quantitative in-situ estimation of WAA. However, it was observed that the correlation coefficient between ARC and WAA strongly depends on the frequency and can be with a positive as well as with a negative sign.
In this work, we investigate CML antennas at different degrees of wetness inside an anechoic chamber. Starting from a dry measurement, we apply water manually using a hand sprayer. Afterwards, we observe the drying process in terms of ARC measurements taken at close intervals over the entire specified antenna operating frequency ranges in the K and Ka band. The frequency-dependent drift of the ARC over time and its continuous and consistent return to the initial dry state is clearly visible from these results, which confirm that wetness on the antenna radome can either decrease or increase ARC depending on the operating frequency. Video files are provided in which the temporal change of the measured data during the drying process can be seen.
Three commercially available, dually polarized CML antennas from the manufacturer Ericsson were investigated as antennas under test (AUTs). Table 1 lists the product names and the operating frequency ranges of the used CML antennas. In this paper they are referred to as AUT 1 through AUT 3. These antennas were assembled inside an anechoic chamber and connected to a vector network analyzer (VNA) after conventional thru-open-short-match (TOSM) calibration relative to the coaxial connectors. The antenna main beam directions were aligned at oblique angles relative to the chamber walls to minimize the intensity of any residual wall reflections from the potentially non-ideal truncated absorbers. The VNA ports were connected to the respective feeding waveguides of the two polarizations of the antenna. Figure 1 shows the photograph of an example setup.
Table 1Product names and operating frequency ranges of the AUTs.
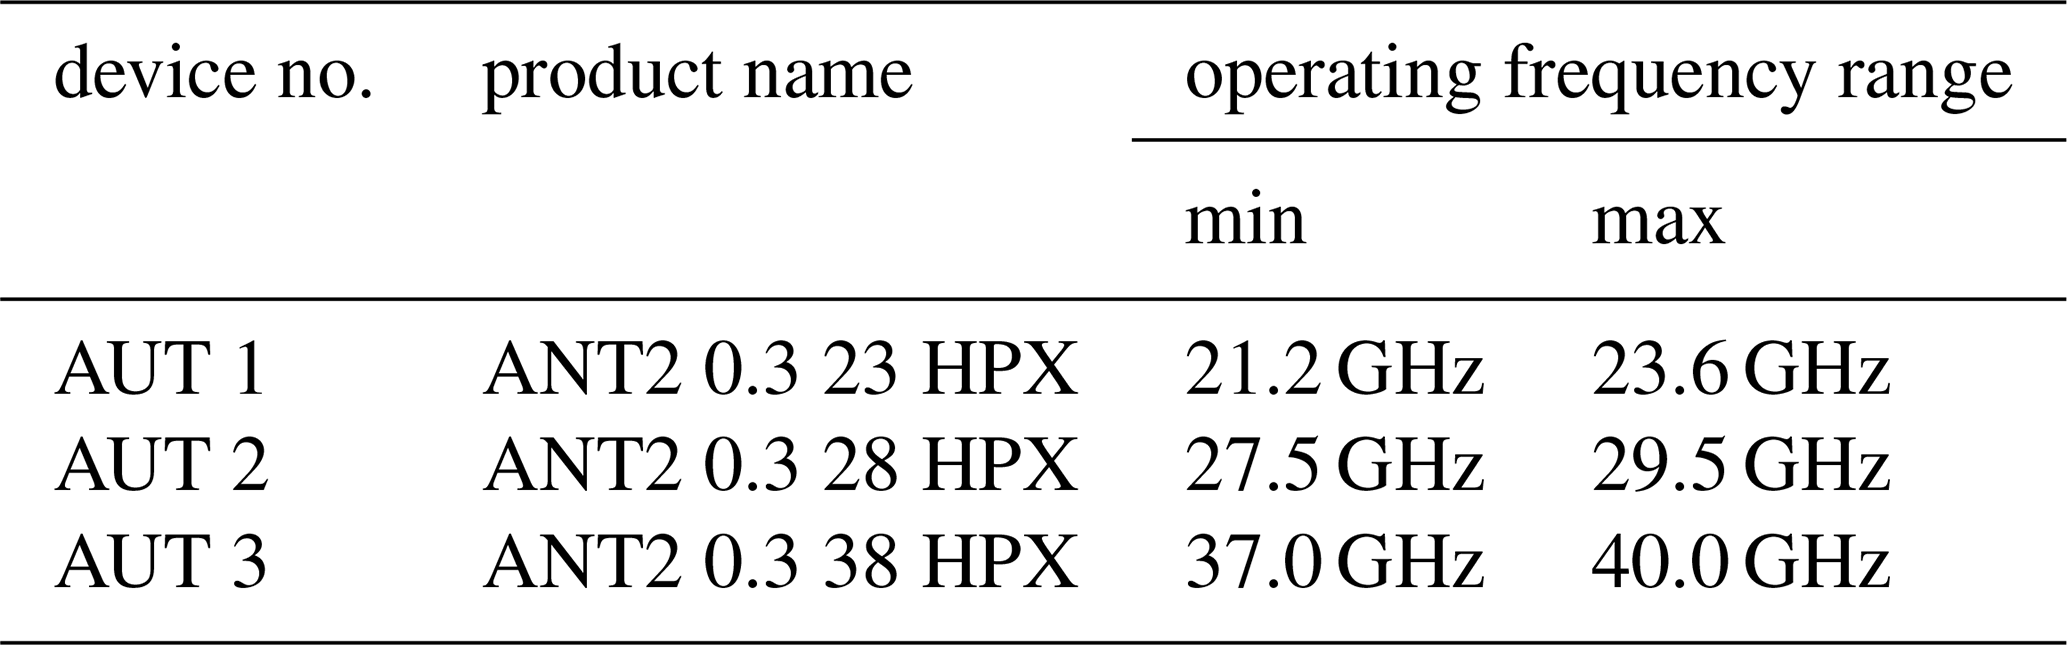
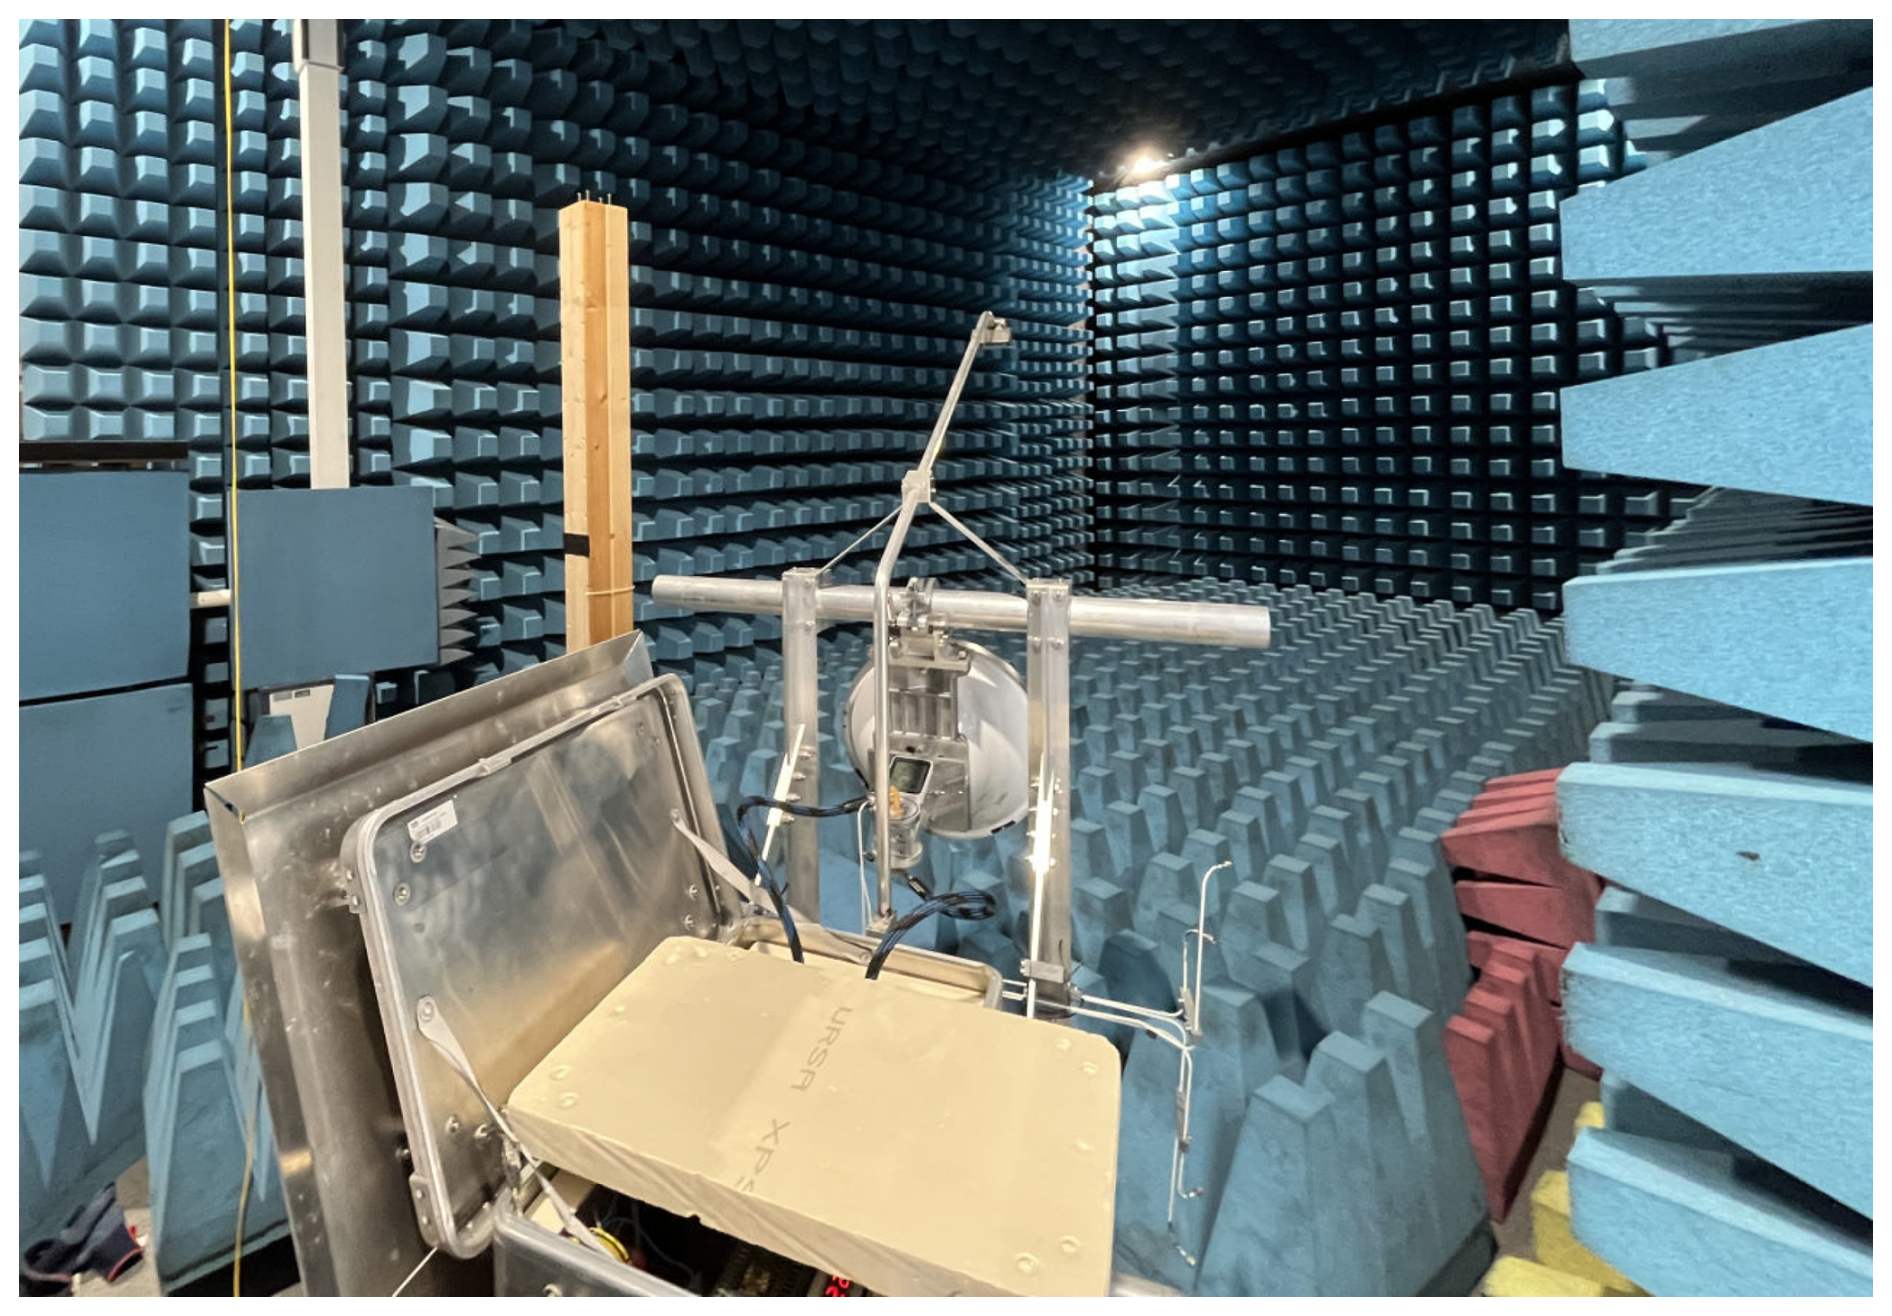
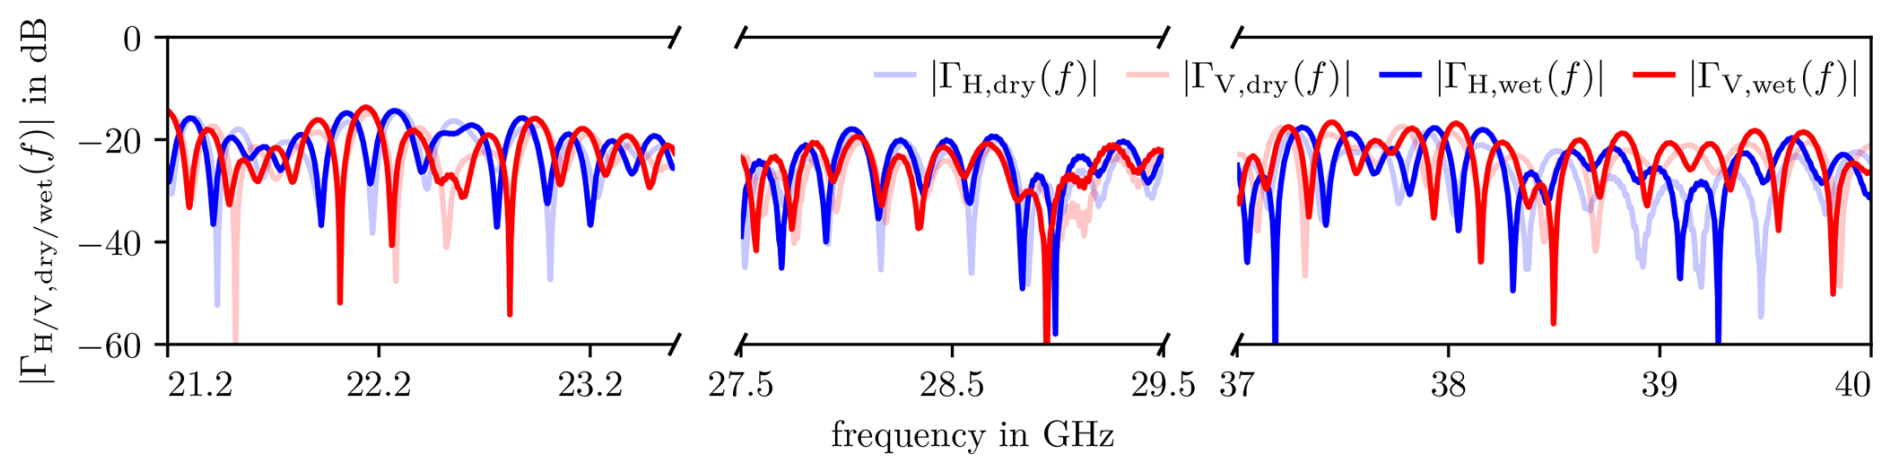
Figure 2Measured ARC magnitudes , for horizontal and vertical polarization under dry and wet conditions of AUT 1, AUT 2 and AUT 3 (left to right). The drying processes can be observed in detail over time in the video supplement.
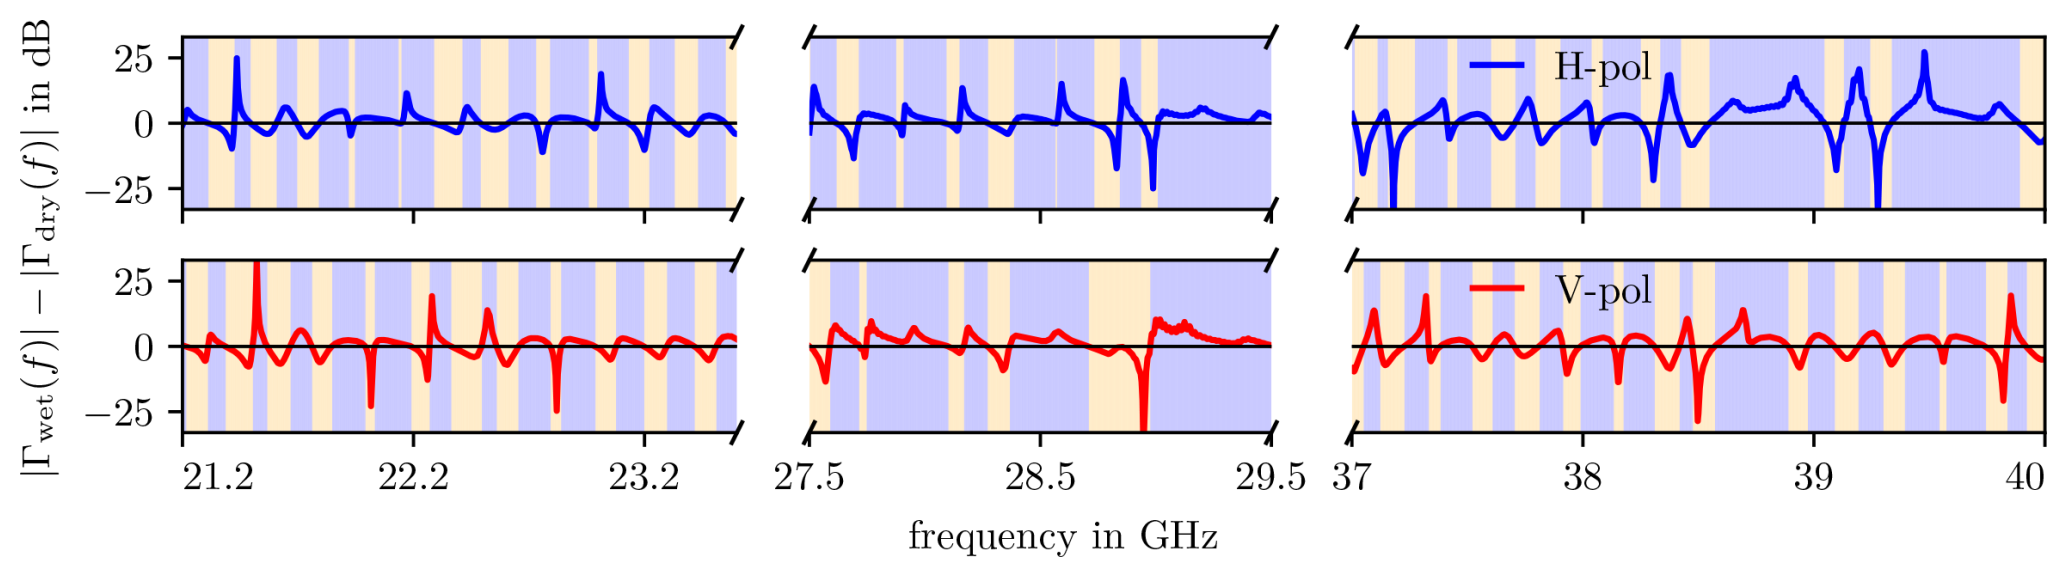
Figure 3Differences between ARC magnitudes for horizontal and vertical polarization under dry and wet conditions of AUT 1, AUT 2 and AUT 3 (left to right). The frequency divisions marked in yellow indicate a lower and the divisions marked in blue indicate a higher ARC magnitude under wet conditions as compared to the dry state.
The ARC of each antenna was first measured under dry conditions in magnitude and phase at 1001 frequency points within the respective operating frequency bands and at both ports, i.e., both polarizations. These results were stored for later reference and comparison. After that, the antenna radomes were intensely moistened with a hand sprayer beyond the point where water drops ran off. In general, the resulting droplet distribution depends on the surface structure and characteristics of the respective radome material. Here, it was assumed that the water formations on the individual radomes would converge to realistic droplet and drop size distributions due to the oversaturation with water, imitating heavy precipitation during operation in the open field or on a radio tower. During the consecutive drying process of typically several hours, the complex ARC was measured and stored every ten seconds in order to track variations over frequency and time for later analysis.
3.1 Frequency responses under dry and wet conditions
Figure 2 shows the frequency-dependent complex ARC, which is also denoted as in the following, versus frequency for the three AUTs in magnitude. Shown are the measurement results under dry conditions alongside the changed curves as they appeared directly after wetting with water. As expected, significant differences can be observed between the dry and wet states for both polarizations. Narrow band regions are recognizable where the ARC magnitude decreases after wetting and also such in which the ARC magnitude increases. These two types of regions are highlighted by two colours in Fig. 3, allowing a comparison with previous observations where the effect of a wetness-caused change in the ARC was exploited to estimate WAA and reproduce local rainfall events qualitatively (Tiede et al., 2023). In the frequency band from 38.425 to 38.575 GHz and for the horizontal polarization which has been considered there, a decrease of the ARC under wet conditions was observed. This is consistent with the present analysis using direct VNA measurements, see Fig. 3.
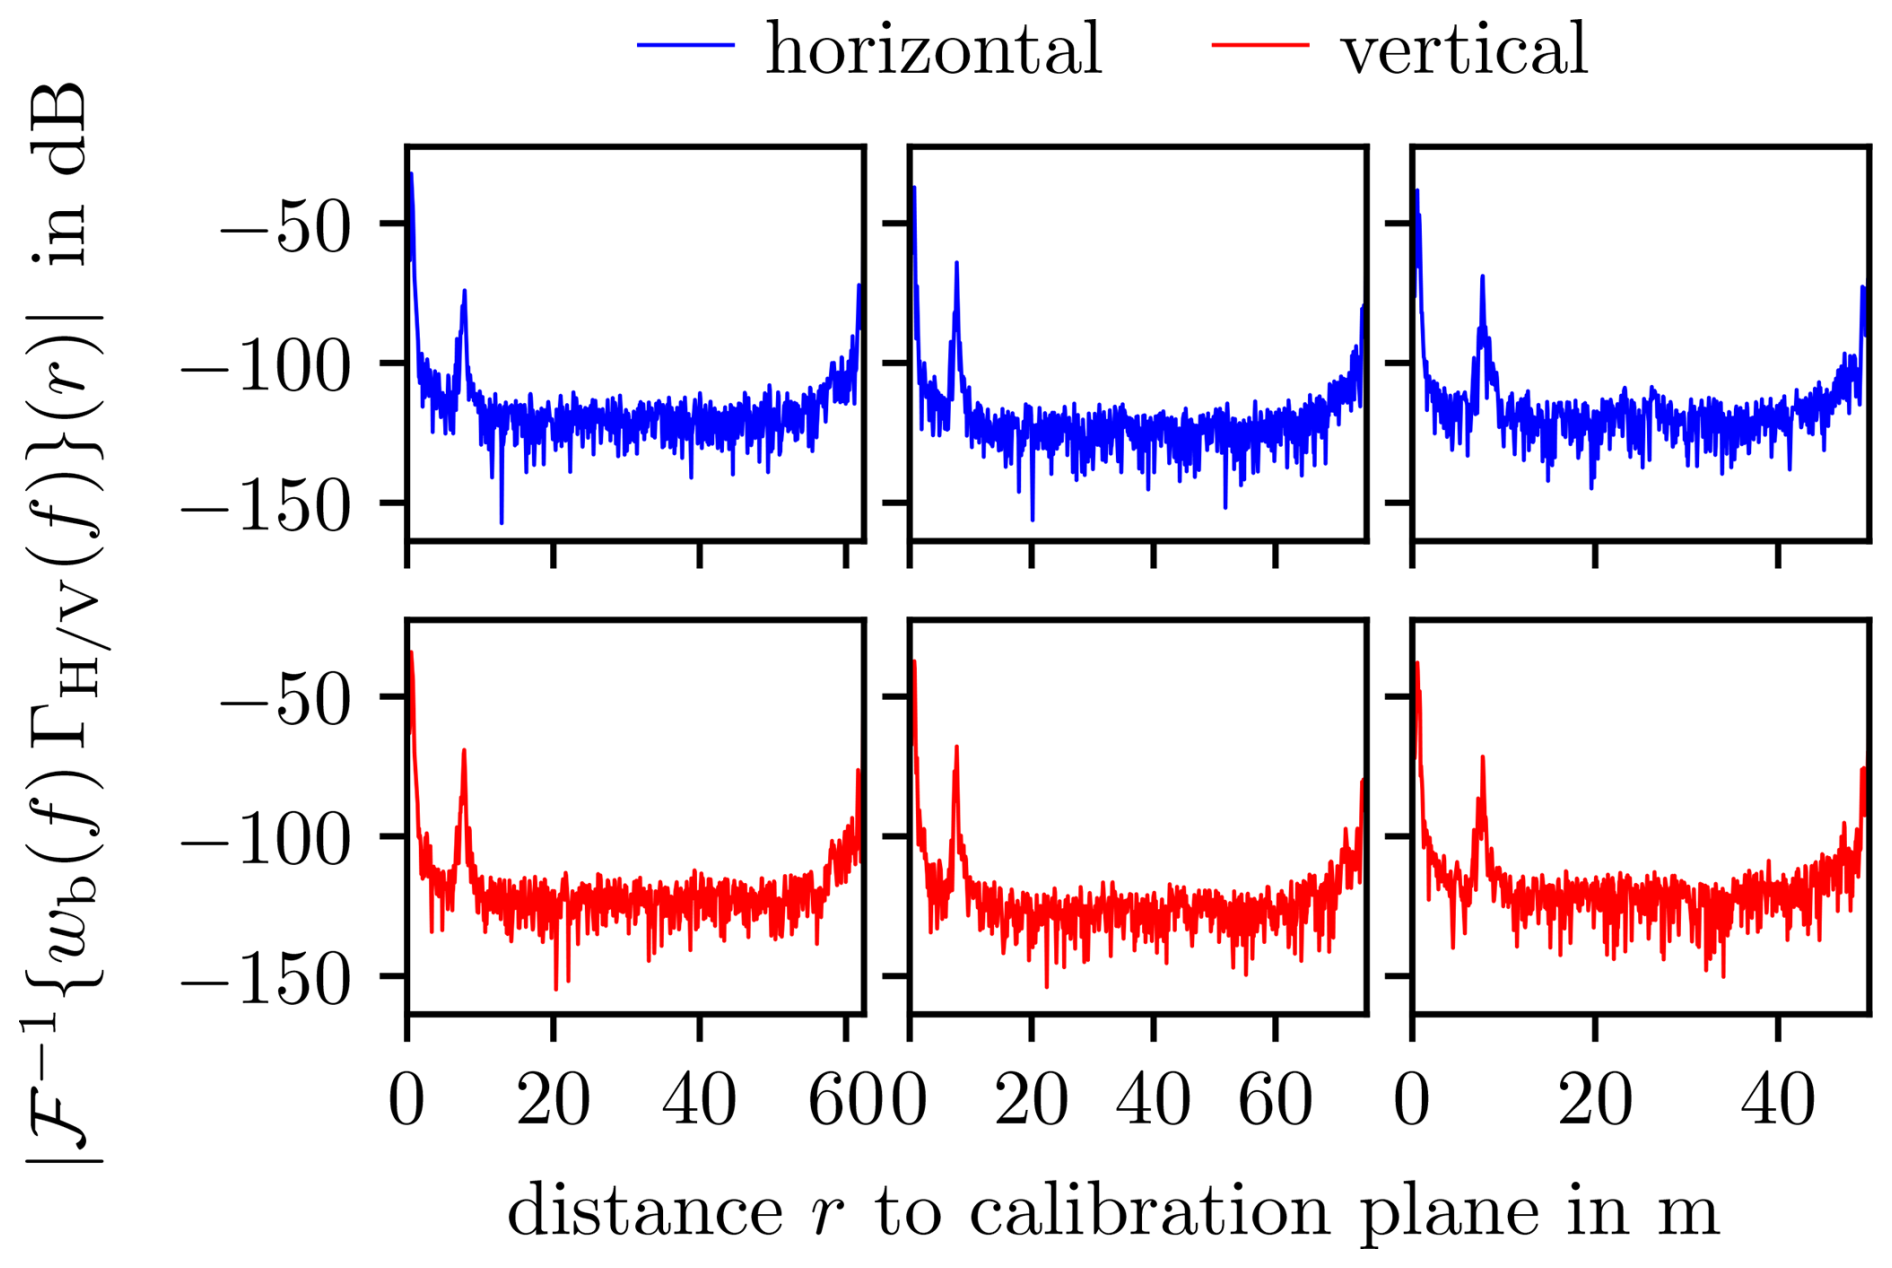
Figure 4Dry range profiles with scaling based on vacuum speed of light. Blackman windowing has been used for spatial sidelobe suppression. Left to right: AUT 1, AUT 2, AUT 3.
Since drop patterns form randomly during the process of moistening the radome, the impact of radome wetness on the ARC was tested with repeated experiments in order to ensure qualitative reproducibility. For this purpose, the spraying procedure was deliberately changed between the individual experiments to strive for maximum randomness in the drop formation processes. The changes in ARC occurring in the repeated experiments were qualitatively very similar, i.e., there were no significant differences in the frequency responses of the ARC in each state of maximum wetness. From this observation, we conclude that the actual drop positions have less impact to the ARC magnitude than the overall water content.
3.2 Range profiles
In order to enable a spatial assignment of the observed changes to individual components of the antennas and localization of changes, all ARC frequency domain data was transformed into time domain by inverse fast Fourier transformation (IFFT). Frequency windowing was performed using a 3-term Blackman window wb(f) in order to reduce sidelobes in the time domain. Mapping of the round-trip delay τ to the distance r was done by
where c0 is the vacuum speed of light. Corresponding to the minimum and maximum frequencies for which the considered AUT is specified according to Table 1, range resolutions from Δr≈5–7.5 cm were achieved. The magnitudes of the resulting full unambiguous range profiles under dry conditions are shown in Fig. 4. At the very beginning, i.e., close to r=0 which corresponds to the calibration plane at the ends of the coaxial cables, there is a first apparent peak spanning over the immediate vicinity of the antenna. The second pronounced peak is significantly lower in magnitude compared to the response from the nearest range bins. Considering its spatial distance of 7.7 m from the calibration plane, it is assigned to residual reflection from the opposite wall of the chamber. Apart from these, no other relevant contributions are observed in the range profiles despite from the peaks at the ends of the individual unambiguous ranges, corresponding to the natural periodicity of IFFT results of band-limited signals.
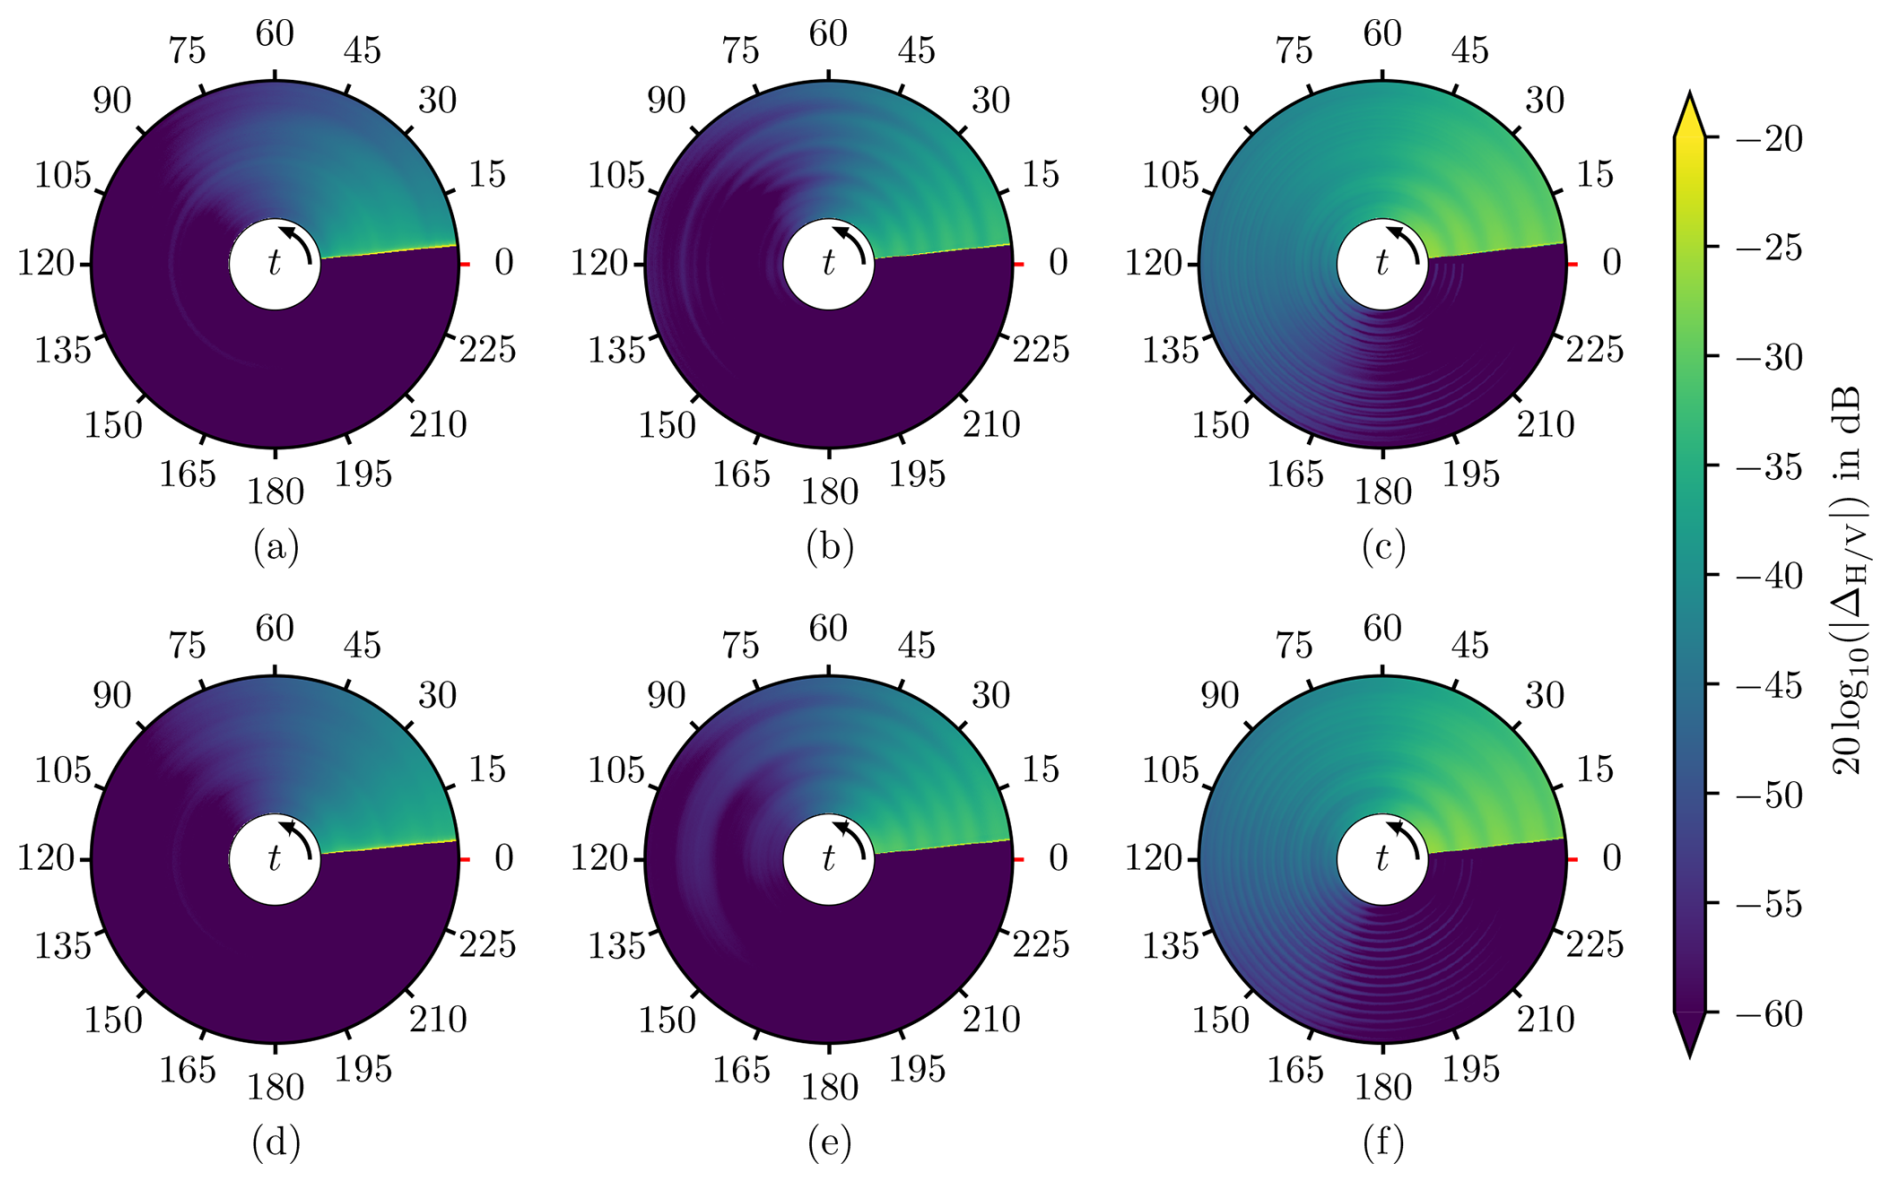
Figure 5Time evolution of the drying process of AUT 1 (a, d), AUT 2 (b, e), and AUT 3 (c, f), represented during a time span of 4 h in polar plots. Radial distance maps to frequency and time in minutes is plotted in azimuth. The magnitude of is color coded. Panels (a)–(c) correspond to horizontal polarization and panels (d)–(f) to vertical polarization. The drying processes can be observed in detail over time in the video supplement.
3.3 Drying process
The recorded datasets from a series of repeated experiments under the same conditions were analyzed together with the associated range profiles obtained by IFFTs of the frequency-domain ARCs. Exemplary drying processes can be observed over frequency and time in Fig. 5 and in even more detail in the video supplement (Tiede et al., 2025). In the color coded polar plots provided here, the radial distance maps to frequency. Time in minutes is represented in azimuth. Color represents the magnitude of
which is the complex difference of the individual ARC frequency responses recorded over time t and the response from the very first measurement at t=0 under dry initial conditions. The index H or V corresponds to the measurement of horizontal or vertical polarization. The clearly noticeable discontinuities at some minutes after the respective starts of the measurements correspond to the time where the antenna was wetted manually, i.e., the start of the drying process. As time goes on and the radome dries off, the ARC returns back to its original dry state over the complete measured frequency range apart from some artifacts with negligible magnitudes of about or below −60 dB. The drying times are almost identical in both polarizations, which is to be expected. There are individual frequency ranges in which the ARC returns to its original state sooner than in other ranges.
In a way similar to Fig. 5, the time evolutions of the magnitude of the corresponding range profiles are shown in Fig. 6, where the radial distance now corresponds to the distance from the calibration plane, i.e., the coaxial connectors. Color represents the magnitude of
where the superscript (w) denotes the result after windowing the ARC according to
with wb(f) denoting the same Blackman window as it was used for Fig. 4. Again, the index H or V corresponds to the results for horizontal or vertical polarization. It was observed that the effects of water wetting and also the changes during the drying process for the most part occur within the first two meters, i.e., within close proximity of the antenna. This is acceptable and justified since the drops are obviously sitting directly on the radome. For this reason, only the first two meters of the distance profiles are shown in order not to clutter the graphical representation with irrelevant data. The wall reflection magnitude also shows slight variations over time which could potentially be considered to constitute WAA and path loss information. However, since the wall is not at far-field distance at all, it is not considered to be meaningful for actual WAA fits as they have been done in Tiede et al. (2023) where a corner reflector at several hundred meters was used. Again, the magnitudes of the complex differences between range profiles during drying and the very first range profile, i.e., under dry conditions, are shown during the time of the drying process and the discontinuities shortly after the start of the respective measurements correspond to the time of wetting the radome. Once more, the drying process is observable from the smooth transition of the end of the drying process into the initial state of dry conditions.
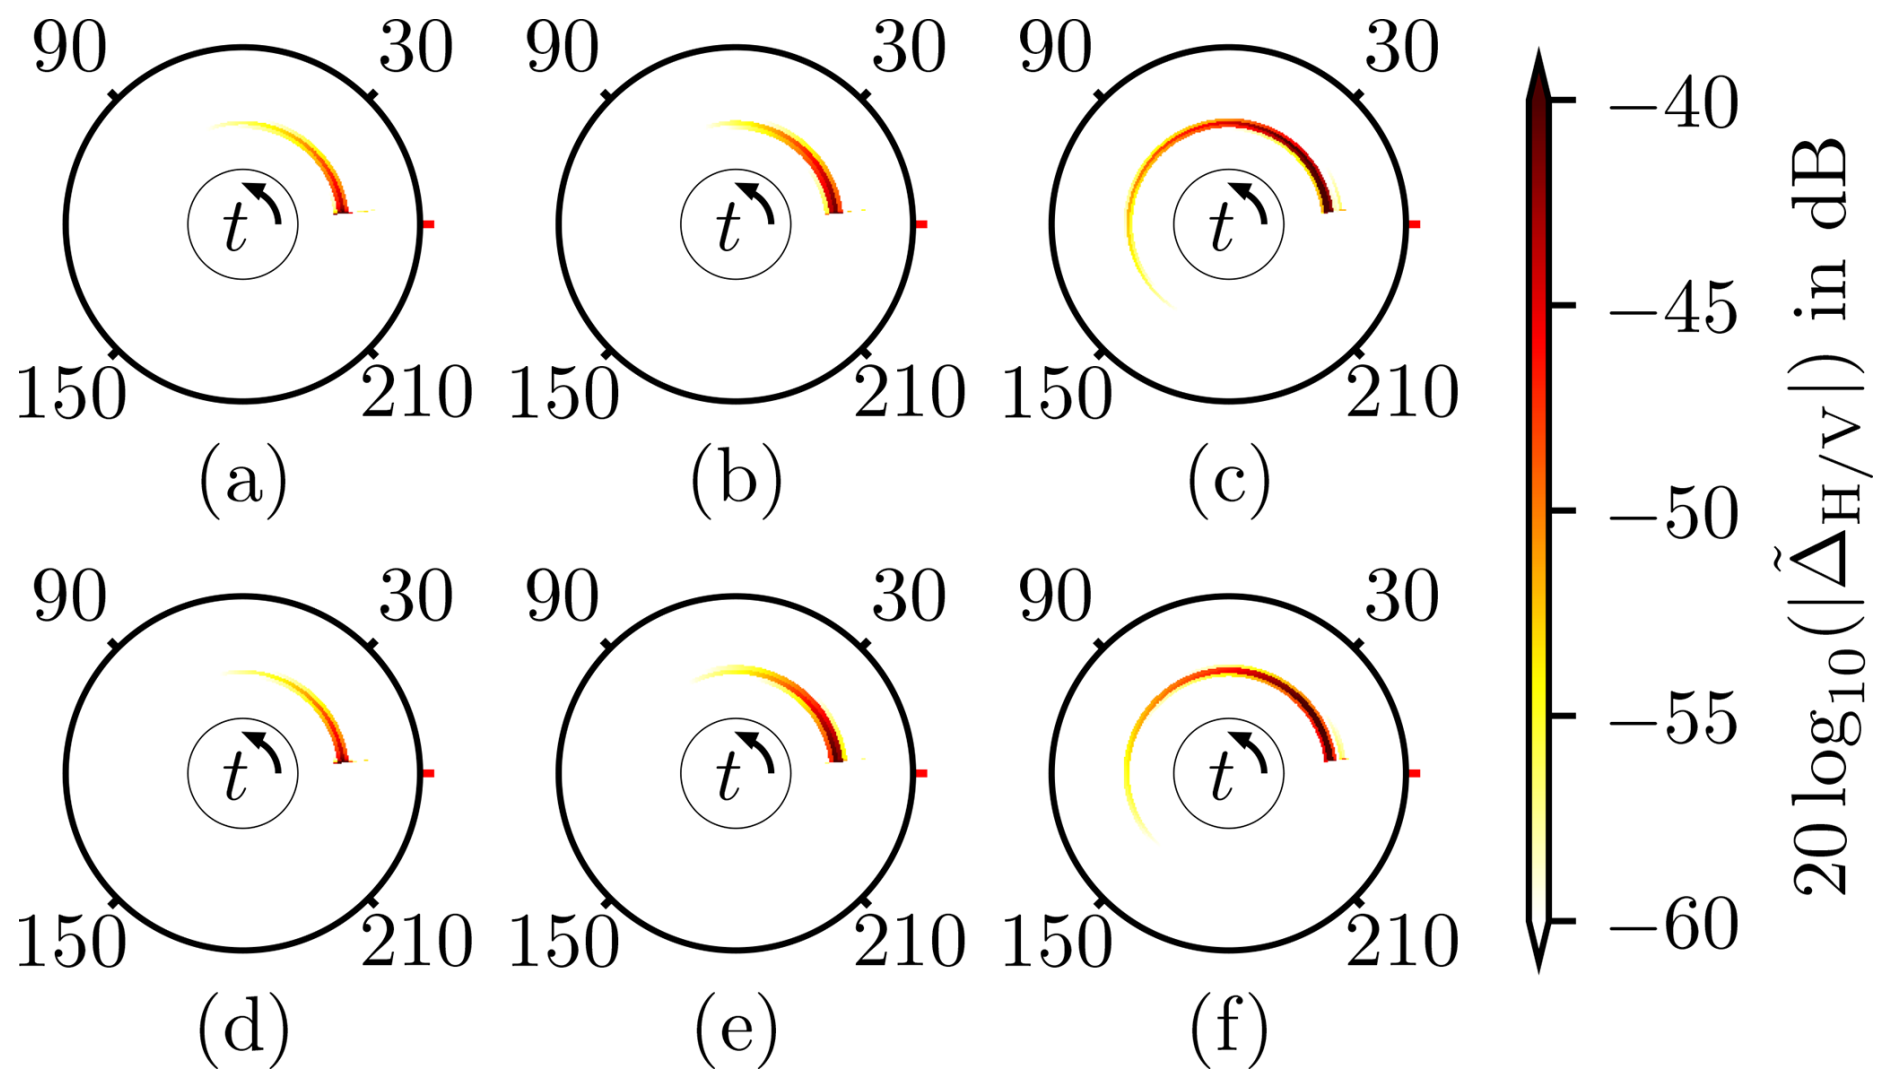
Figure 6Time evolution of ARC during the drying process of AUT 1 (a, d), AUT 2 (b, e), and AUT 3 (c, f) within a time span of 4 h in polar plots. Radial distance maps to distance, starting from the calibration plane at r=0 m and ranging up to r=2 m. Time in minutes is plotted in azimuth. Color coded is the magnitude of , where wb(f) is a 3-term Blackman window. Panels (a)–(c) correspond to horizontal polarization and panels (d)–(f) to vertical polarization.
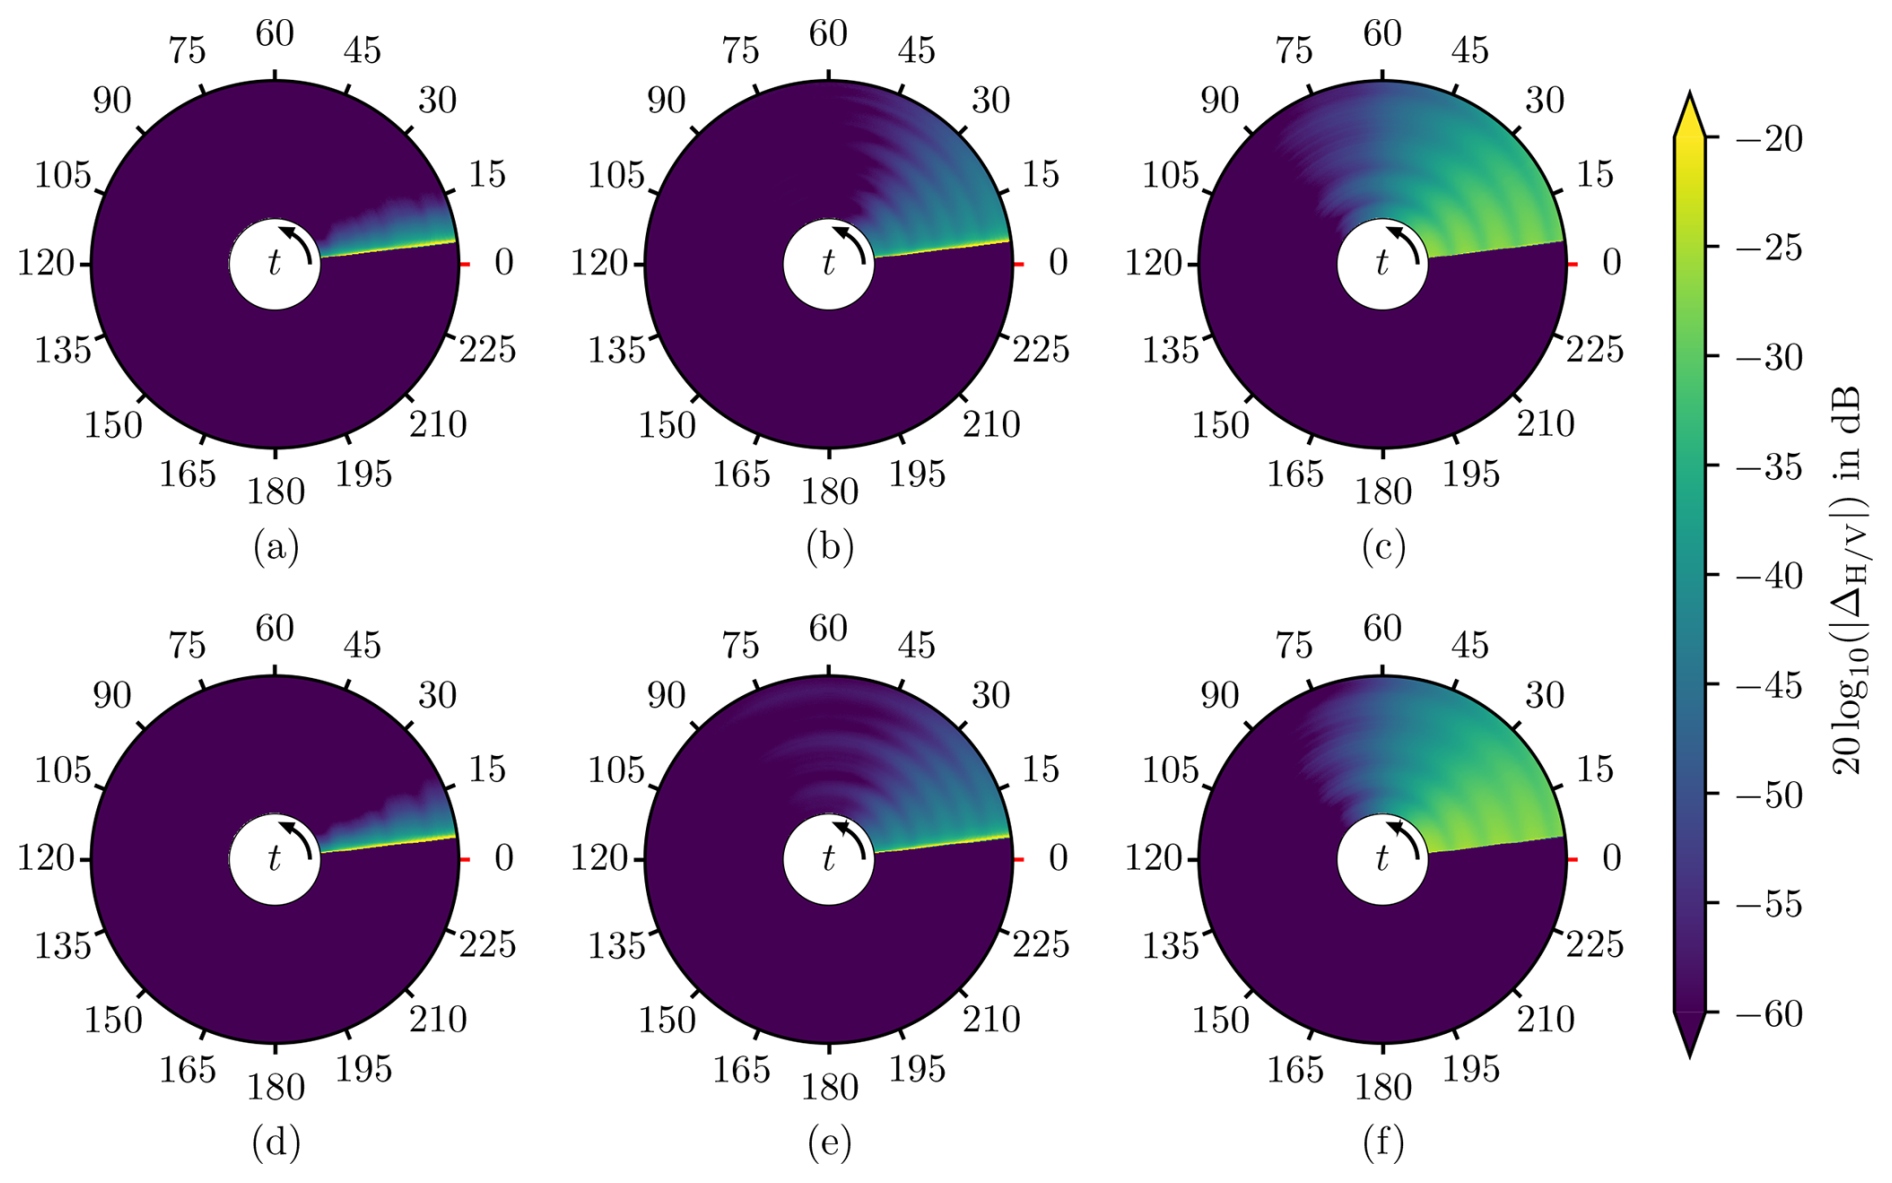
Figure 7Time evolution of the drying process of AUT 1 (a, d), AUT 2 (b, e), and AUT 3 (c, f), represented during a time span of 4 h in polar plots. Radial distance maps to frequency and time in minutes is plotted in azimuth. The magnitude of is color coded. Panels (a)–(c) correspond to horizontal polarization and panels (d)–(f) to vertical polarization. The drying processes can be observed in detail over time in the video supplement.
Since it was not possible to keep all atmospheric parameters such as temperature, relative humidity and air convection constant over a longer period of time in the measurement chamber, the experiments were repeated several times in order to investigate how different environmental conditions and inevitably different drop distributions impact the drying process. While the complex ARC always returned to the initial response under dry condition for the three AUTs during drying, the individual drying processes did not always take the same amount of time. Significantly shorter drying times than in Fig. 5 while using the exact same setup for the individual antennas are demonstrated in Fig. 7. Beyond slight temperature and humidity variations, this is attributed to different particular outcomes of the drop pattern formation processes. Specifically, the effect of drops running off during or immediately after the spraying process can remove different amounts of water before observing the ARC during drying. The impact of this effect ultimately depends on the spraying procedure and the associated drop formation process which is difficult to predict.
The significant differences in the respective drying times in Figs. 5 and 7, however, clearly emphasize that the drying process of a wet CML antenna strongly depends on a manifold of parameters even under laboratory conditions. Operated under real conditions, a CML is exposed to many more and also larger variations of environmental parameters including temperature, humidity and wind speed which all have diverse influences on the drop formation as well as drying processes. It is obvious that predicting or estimating WAA in this situation will, most probably, remain a challenging, if not impossible task to master perfectly. However, with ARC information available, the overall wetness state of an antenna radome can be captured well for the majority of frequencies, even if this could bring the necessity of occasional ARC calibration to account for inevitable drifts of the entire antenna system, e.g., degradation of radome surface constitutions over time.
The impact of water drops, sitting on the radome of highly directive CML reflector antennas, on the ARC was investigated and its frequency dependence was pointed out. Previous observations regarding the rise and fall of the ARC under wet conditions were confirmed within a significantly broader frequency band provided by direct measurements with a VNA. The results demonstrate that the ARC is strongly and systematically influenced by the presence of wetness on the antenna radome. While the ARC always returned back to its initial state under dry conditions after wetting, the experiments also showed that the drying time can vary greatly for the same antenna. Together with the slightly varying atmospheric environment inside the measurement chamber, this is attributed to different drop pattern formations due to the wetting process of the radome. Although the residual water amount resulting from the drop formation process on the radome remains unpredictable in advance, it could potentially be derived from the ARC afterwards. Consequently, with this kind of information available in addition to common CML path loss time series, one could also reproduce the accumulating or drying processes of water on real-world CML antenna radomes during natural precipitation events. Also with regard to previous studies, QPE accuracy can be significantly improved by estimating the actual and momentary water content on the radome from in-situ measurements. As such, the ARC can be considered to be a remarkably valuable source of information regarding the potential presence of water on the radome and associated WAA estimation.
The code is available upon reasonable request.
The data is available upon reasonable request.
The supplemented video files show the variation of the measured frequency-dependent ARC over time for the three AUTs under investigation (https://doi.org/10.5446/s_1877, Tiede et al., 2025).
JT worked out the measurement setup, performed the measurements, analyzed and evaluated the data and wrote the manuscript. CC and US were involved in the writing process. TFE supervised the documentation. All authors read and approved the final manuscript.
The contact author has declared that none of the authors has any competing interests.
Publisher's note: Copernicus Publications remains neutral with regard to jurisdictional claims made in the text, published maps, institutional affiliations, or any other geographical representation in this paper. While Copernicus Publications makes every effort to include appropriate place names, the final responsibility lies with the authors.
This article is part of the special issue “Kleinheubacher Berichte 2024”. It is a result of the Kleinheubacher Tagung 2024, Miltenberg, Germany, 24–26 September 2024.
This research has been supported by the Deutsche Forschungsgemeinschaft (grant nos. CH 1785/2-1 and SI 2034/2-1, project ID 432287169).
This paper was edited by Simon Adrian and reviewed by Tobias Weber and one anonymous referee.
Graf, M., Chwala, C., Polz, J., and Kunstmann, H.: Rainfall estimation from a German-wide commercial microwave link network: optimized processing and validation for 1 year of data, Hydrol. Earth Syst. Sci., 24, 2931–2950, https://doi.org/10.5194/hess-24-2931-2020, 2020. a
Leijnse, H., Uijlenhoet, R., and Stricker, J.: Microwave link rainfall estimation: Effects of link length and frequency, temporal sampling, power resolution, and wet antenna attenuation, Adv. Water Resour., 31, 1481–1493, https://doi.org/10.1016/j.advwatres.2008.03.004, 2008. a
Moroder, C., Siart, U., Chwala, C., and Kunstmann, H.: Microwave Instrument for Simultaneous Wet Antenna Attenuation and Precipitation Measurement, IEEE T. Instrum. Meas., 69, 5853–5861, https://doi.org/10.1109/TIM.2019.2961498, 2020. a
Overeem, A., Leijnse, H., van Leth, T. C., Bogerd, L., Priebe, J., Tricarico, D., Droste, A., and Uijlenhoet, R.: Tropical rainfall monitoring with commercial microwave links in Sri Lanka, Environ. Res. Lett., 16, 074058, https://doi.org/10.1088/1748-9326/ac0fa6, 2021. a
Pastorek, J., Fencl, M., Rieckermann, J., and Bareš, V.: Precipitation Estimates From Commercial Microwave Links: Practical Approaches to Wet-Antenna Correction, IEEE T. Geosci. Remote, 60, 1–9, https://doi.org/10.1109/TGRS.2021.3110004, 2022. a, b
Schleiss, M., Rieckermann, J., and Berne, A.: Quantification and Modeling of Wet-Antenna Attenuation for Commercial Microwave Links, IEEE Geosci. Remote S., 10, 1195–1199, https://doi.org/10.1109/LGRS.2012.2236074, 2013. a
Tiede, J., Chwala, C., and Siart, U.: New Insights Into the Dynamics of Wet Antenna Attenuation Based on In Situ Estimations Provided by the Dedicated Field Experiment ATTRRA2, IEEE Geosci. Remote S., 20, 1–5, https://doi.org/10.1109/LGRS.2023.3320755, 2023. a, b, c
Tiede, J., Chwala, C., Siart, U., and Eibert, T. F.: Supplementary Videos for Publication: J. Tiede et al., Frequency-Dependent Variations of the Antenna Reflection Coefficient Due to Different Wetness Conditions on the Antenna Radome, TIB AV-Portal [video], https://doi.org/10.5446/s_1877, 2025. a, b