 | 01 Jul 2026
Possible solar cycle influence on midlatitude mesosphere/lower thermosphere horizontal winds over Germany
Ales Kuchar
Manfred Ern
Toralf Renkwitz
Ralph Latteck
Jorge L. Chau
At Collm (51.3° N, 13.0° E) mesosphere/lower thermosphere (MLT) zonal and meridional winds have been measured for more than four decades using low-frequency spaced receiver measurements on 177, 225, and 270 kHz, and very high frequency meteor radar observations on 36.2 MHz. We analyse the combined time series of monthly mean horizontal winds at 90 km height from 1979 to 2024 with respect to long-term changes, and in particular to the effect of the 11-year solar cycle (SC). In the 1980s and 1990s there is a negative correlation with solar extreme ultraviolet proxies in spring and early summer, with a weaker jet in the lower thermosphere during solar maximum. This correspondence weakens after the year 2000. In winter, there is a weak positive effect towards stronger westerly winds during solar maximum. Together, the results suggest that solar forcing remains an important, season-dependent driver of mid-latitude MLT dynamics, but its expression is modulated by the recently weakened SCs 24–25, or modified by changing trends of forcing from below. These results are largely in agreement with partial reflection radar observations of mesospheric winds over Juliusruh (54.6° N, 13.4° E) at 3.18 MHz. We also compare them with decadal variations of gravity wave proxies, but these results are partly inconclusive.
- Article
(5525 KB) - Full-text XML
- BibTeX
- EndNote


Long-term changes of mesosphere/lower thermosphere (MLT) winds have frequently been analysed in the past, mainly based on radar observations (Noble et al., 2024; Ramesh et al., 2024; Jacobi et al., 2023) or modelling (Qian et al., 2019; Kumar et al., 2025). However, when considering long-term trends it must be kept in mind that there exist periodicities at decadal or very long timescales. One of them is the 11-year solar cycle (SC). Its influence on the MLT dynamics was investigated in the past, among others, by Sprenger and Schminder (1969a), Greisiger et al. (1987), Bremer et al. (1997), Middleton et al. (2002), and Jacobi and Kürschner (2006).
The SC studies, however, were partly contradictory. From low-frequency (LF), closely spaced receiver (D1) measurements in northern and eastern Germany, Sprenger and Schminder (1969a) found a strong positive correlation of both zonal (positive eastward) and meridional (positive northward) prevailing wind in winter, which was confirmed by Portnyagin et al. (1977) using additional D1 data and also meteor radar (MR) data from Obninsk, Russia (55° N). Another study was carried out by Dartt et al. (1983), who, using data from different stations at northern middle latitudes, qualitatively confirmed the findings of Sprenger and Schminder (1969a), and also reported a positive SC effect during summer. However, in contrast to the earlier results Greisiger et al. (1987) found negative correlation of solar flux and zonal prevailing wind in winter as well as in summer. Bremer et al. (1997) analysed more than 30 years of mesopause region wind data, and reported positive correlation of the zonal as well as of the meridional mean wind with the solar flux in winter, and negative correlation in summer, although their results were not statistically significant. Jacobi et al. (1997) and Jacobi and Kürschner (2006) confirmed the negative summer mean wind correlation and a weaker positive correlation in winter. Using partial reflection (PR) measurements over Juliusruh, Germany, Keuer et al. (2007) also found the positive/negative SC effect in winter/summer, which in winter was particularly strong near the mesospheric wind jet, but weaker near the mesopause, which confirmed the results from LF and MR observations. Observations over Castle Eaton, UK (52° N), however, revealed contrasting results (Middleton et al., 2002).
Using the extended UK Meteorological Office stratosphere mesosphere model, Arnold and Robinson (1998, 2000) reported enhanced high-latitude zonal winds during solar maximum winters. This was partly due to a latitudinal shift of the zonal wind jet, and the effect decreased above the mesosphere, which is supported by observations (Keuer et al., 2007). Arnold and Robinson (2001) also reported enhancement of the winter zonal middle atmosphere winds after geomagnetic activity. Since the latter is connected with the SC, this effect may also lead to stronger westerly winter winds in the middle atmosphere during high solar activity.
Already earlier observations until the 1990s showed that a possible SC effect is not necessarily stable with time. Analyses of the Obninsk long-term MR measurements were also presented by D'yachenko et al. (1986), who pointed out that oscillations with a period of 11 years were present in the time series of the prevailing wind. However, they also reported a long-term change at the bidecadal-year time scale they attributed to a possible effect of the 22-year solar Hale cycle. Jacobi et al. (1997) also reported a change of solar influence, but mainly seen in the semidiurnal tidal amplitude and not in the zonal prevailing wind.
In the late 1990s and after the turn of the millenium, more long-term observations became available using meteor radars at different latitudes. While Ramesh et al. (2024) essentially showed a positive SC effect on the winter mean wind at a high northern hemisphere (NH) latitude (Esrange, 68° N), Noble et al. (2024) reported a negative zonal wind effect of the SC over Rothera (68° S), and confirmed this with WACCM-X global circulation model results. On the other hand, their SC effect in summer was positive, while Wilhelm et al. (2019) and Ramesh et al. (2024) found effects changing with height. At midlatitudes, Wilhelm et al. (2019) reported a SC effect of the zonal wind during winter and summer, but at different altitudes for Europe and North America. Also satellite observations have been analysed with respect to a SC effect (Liu et al., 2023), revealing mostly positive SC dependence of balanced zonal winds at low and middle latitudes. WACCM-X model results by Qian et al. (2019) at about 90 km showed mainly a positive SC effect in both NH and southern hemisphere (SH) higher latitudes.
Generally, the results of SC analyses of winds observed since the 2000s are partly inconclusive and not always agree with those from earlier observations. This may again be interpreted as a possible influence of changes or periodicities at the interdecadal time scale. Actually, linear trends in the MLT have been found to change with time (Portnyagin et al., 2006; Merzlyakov et al., 2009; Jacobi et al., 2015). Recently, Kumar et al. (2025) reported a change in winter MLT zonal mean wind trend similar as in Jacobi et al. (2023), connected with a change of the Northern Annular Mode trend and planetary wave propagation trends in the NH winter. Finally, trends may even have a different sign across longitudes (Jacobi et al., 2012), which may also affect a possible SC signature (Wilhelm et al., 2019).
To conclude, it is not clear whether there is a real SC effect on MLT winds, and if so, whether and how this changes with time. To contribute to the database regarding a possible SC effect on the MLT, we here present observations from two radar sites in Germany, namely Collm (51.3° N, 13.0° E, Jacobi and Kürschner, 2006; Jacobi et al., 2015) and Juliusruh (54.6° N, 13.4° E, Keuer et al., 2007; Jaen et al., 2022). Owing to the different observation methods in Collm and Juliusruh, their data refer to slightly different heights around the MLT. We analyse long-term changes, with a focus on the possible influence of the 11-year cycle. A possible effect of the 11-year SC has also been found in gravity wave (GW) proxies (e.g., Jacobi, 2014; Perminov et al., 2024), so we also compare the SC effect in winds with GW activity in the following.
At Collm, MLT winds had been measured from 1979 to 2008 by the LF D1 method using the sky wave of three commercial radio transmitters (Schminder and Kürschner, 1994) with frequencies of 177, 225, and 270 kHz. The total reflection of the LF radio wave in the lower E region has been used by this method. Therefore, the reference height was changing during the day, i.e. strongly decreasing/increasing in the morning/evening, so that mean wind values over more than half an hour could not be obtained. Therefore, monthly median half-hourly winds have been calculated by combining the three respective wind measurements in each direction using weighting factors based on the “chaotic velocity” (Sprenger and Schminder, 1969b). Note that LF wind observations at Collm have started earlier (Sprenger and Schminder, 1967), but using single LF transmitters only, so that data from 1979 are more reliable. The half-hourly means have already been used to calculate monthly mean zonal and meridional prevailing winds and tidal parameters (Jacobi and Kürschner, 2006). The data are attributed to the mean nighttime reflection height of LF radio waves of about 90 km (Jacobi et al., 2025). LF reflection heights have been observed since 1983 (with half-hourly resolution since 1984) until 2007 by phase comparisons of the ground wave and the sky wave in a modulation frequency band near 1.8 kHz (Kürschner et al., 1987). Due to group retardation the estimated virtual heights are too large, and have been corrected here using an empirical height-dependent reduction factor based on phase comparisons of the solar semidiurnal tide derived from LF and very high frequency (VHF) MR observations (Jacobi, 2011). Note that the reflection heights are changing during the day, so that observations at higher altitudes around 90 km were only possible during nighttime. During daylight hours, the reflection height decreases to about 82 km, however, due to LF radio wave absorption in the ionospheric D region particularly in the summer mesosphere, the daytime measurements were only possible during winter.
Since 2004, VHF MR observations have been performed at Collm on 36.2 MHz (Jacobi et al., 2015, 2023). An upgrade of the radar was made in 2015/2016, including the replacement of the Yagi antennas by crossed Yagi antennas and peak power increase, which resulted in a more regular azimuth distribution of registered meteors, an extended height range, and a higher meteor count rate. The observations are now also synchronized with other systems in northern Germany, which allows multistatic observations (Stober et al., 2018; Charuvil et al., 2022). Details of the radar configuration can be found, e.g., in Stober et al. (2021). The radar now delivers wind observations in the approximate height range of 75–105 km. Meteor heights are provided by an interferometer (Jacobi et al., 2015). 21-year mean monthly mean winds in the height range 82–97 km are shown in Fig. 1. The data used for Fig. 1 is based on monthly means calculated in 3 km height gates, except for the upper height gate, which is 5 km wide (Jacobi, 2012). Therefore, the actual height range covered is 80.5–100.5 km. At very high and low altitudes, data gaps appear especially during the late afternoon hours due to low meteor rates then, in particular, before the upgrade. Therefore, and since in the following we analyse wind mainly around 90 km, in Fig. 1 we only show winds in the height range where considerably large count rates were obtained.
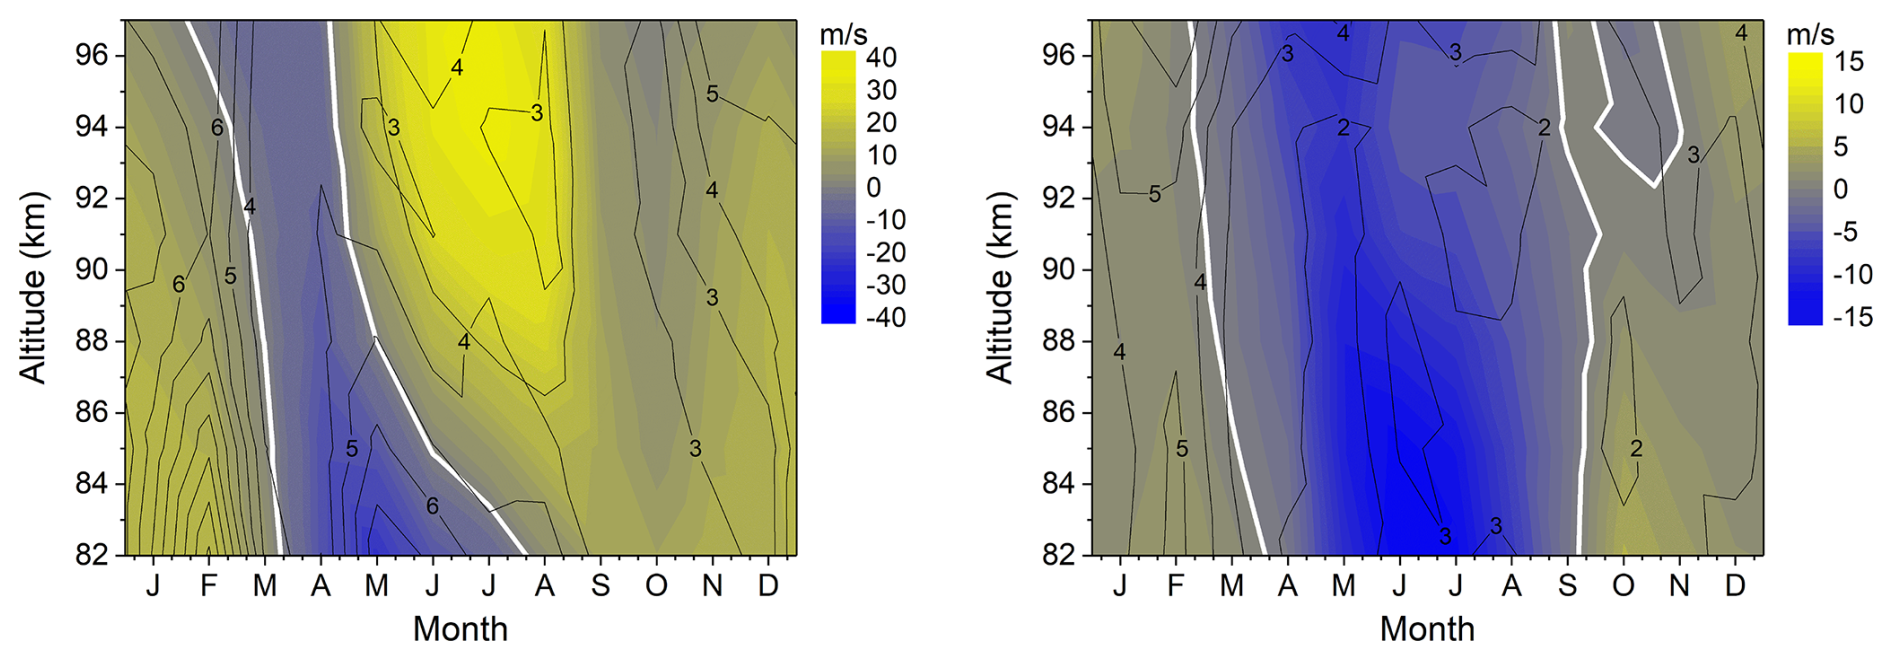
Figure 1August 2004 through July 2025 monthly mean zonal (left panel) and meridional (right panel) winds over Collm observed by VHF radar (color coding). The respective zero wind lines are added as solid white contours. Black contours show standard deviations based on individual monthly means (updated from Jacobi et al., 2023).
However, in the following, we do not use the height information to analyse the mean winds at the mean height of the LF measurements. The LF and VHF winds have been combined using a seasonally dependent correction for the meridional winds as described in Jacobi et al. (2015). Comparison of overlapping observations during 2004–2006 presented in Jacobi et al. (2015) had shown that, when neglecting height finding, zonal winds observed by LF and MR agree, while meridional winds observed by the spaced receiver method usually underestimate the real winds. The seasonal cycle of meridional winds therefore led to a difference that depends on season. The combined dataset has been used in Qian et al. (2019) and Jacobi et al. (2023). Here we present an updated dataset of monthly mean zonal and meridional winds.
From 1990 to 2003 a PR radar was in operation in Juliusruh working with the FMCW (Frequency Modulated Continuous Waves) method at 3.18 MHz (Keuer et al., 2007). This radar has been replaced in spring 2003 by a new modular transmission and reception system (Hoffmann et al., 2010) with distributed power and a new so-called Mills-Cross-Antenna. Now the radar is working with a peak pulse power of 64 kW. Other technical parameters are: 27 µs pulse width, single pulse or 4 bit complementary code, 18° 3 dB beam width, and sampling resolution 1 km. Here we use observations obtained at 84 km in a 2 km height window. We analyse monthly winds from 1990 to 2024, with missing data in the year 2000 as well as in May 2005 and January/February 2027. Medium Frequency/PR radar observations above 85 km tend to be affected by group velocity retardation. This is why heights there are generally called virtual heights like in the case of ionosondes. One would need to know the actual electron density profile, which is not available, to correctly calculate the offset. Therefore, 84 km is regarded the height level closest to the Collm reference height that can be considered real.
The following analysis is based on observations from 1979 to 2024 for Collm data, and 1990 to 2024 for Juliusruh winds for comparison. We use monthly means calculated from the daily PR data for Juliusruh. For Collm LF D1 observations, we calculated monthly median winds for each half-hourly time interval of a day. These, but excluding daytime LF winds to avoid effects of the low reflection heights during daylight hours, were used in a regression analysis. This regression included the mean wind and the circularly polarised component of the semidiurnal tide (Jacobi et al., 2015), to account for the quasi-regular daytime data gaps of the LF observations (e.g., Jacobi, 1998):
where u,v represent the zonal and meridional half-hourly winds, respectively, u0 and v0 are the mean horizontal winds, ω is the angular frequency of the semidiurnal tide, t is time in hours, and a1 and a2 are coefficients describing the tidal amplitude and phase, which are not used here. u0, v0, a1 and a2 are determined by minimizing ϵ. The diurnal tide is not considered in this analysis, because the regular daily data gaps would lead to large errors.
Since our MR observations do not suffer from regular daily data gaps, assuming circular polarisation is not necessary for analysing the data, and also the diurnal tide can be taken into account (e.g., Jacobi et al., 2005, their Eqs. 1 and 2):
with ω1 and ω2 now as the angular frequencies of the semidiurnal and diurnal tide, respectively.
In the Collm time series a few short data gaps of up to a few days appear, but no monthly means are missing. So these gaps do not affect the analysis of trends in the time series.
3.1 Mean winds at Collm
Monthly zonal and meridional mean winds at approx. 90 km over Collm are shown in Fig. 2. During the first half of the observations, until about the late 1990s, from visual inspection and earlier analyses (Jacobi et al., 2015, 2023) a positive linear trend towards more eastward/less westward winds is visible in the zonal winds in most of the year. The meridional winds show a possible decreasing trend in magnitude, so that their linear trend in summer is positive, while it is negative in winter. After the 1990s, there is no clear trend visible any more and there are indications for a breakpoint of linear trends around 1990–2000 (see Jacobi et al., 2015, 2023). A possible 11-year solar signature is also visible in the first half of the time series, e.g., showing strong negative zonal and meridional winds in spring during the maxima of SCs 21 and 22 around 1980 and 1990/1992. After the turn of the millenium, the SC amplitudes in Collm winds seem to decrease strongly.
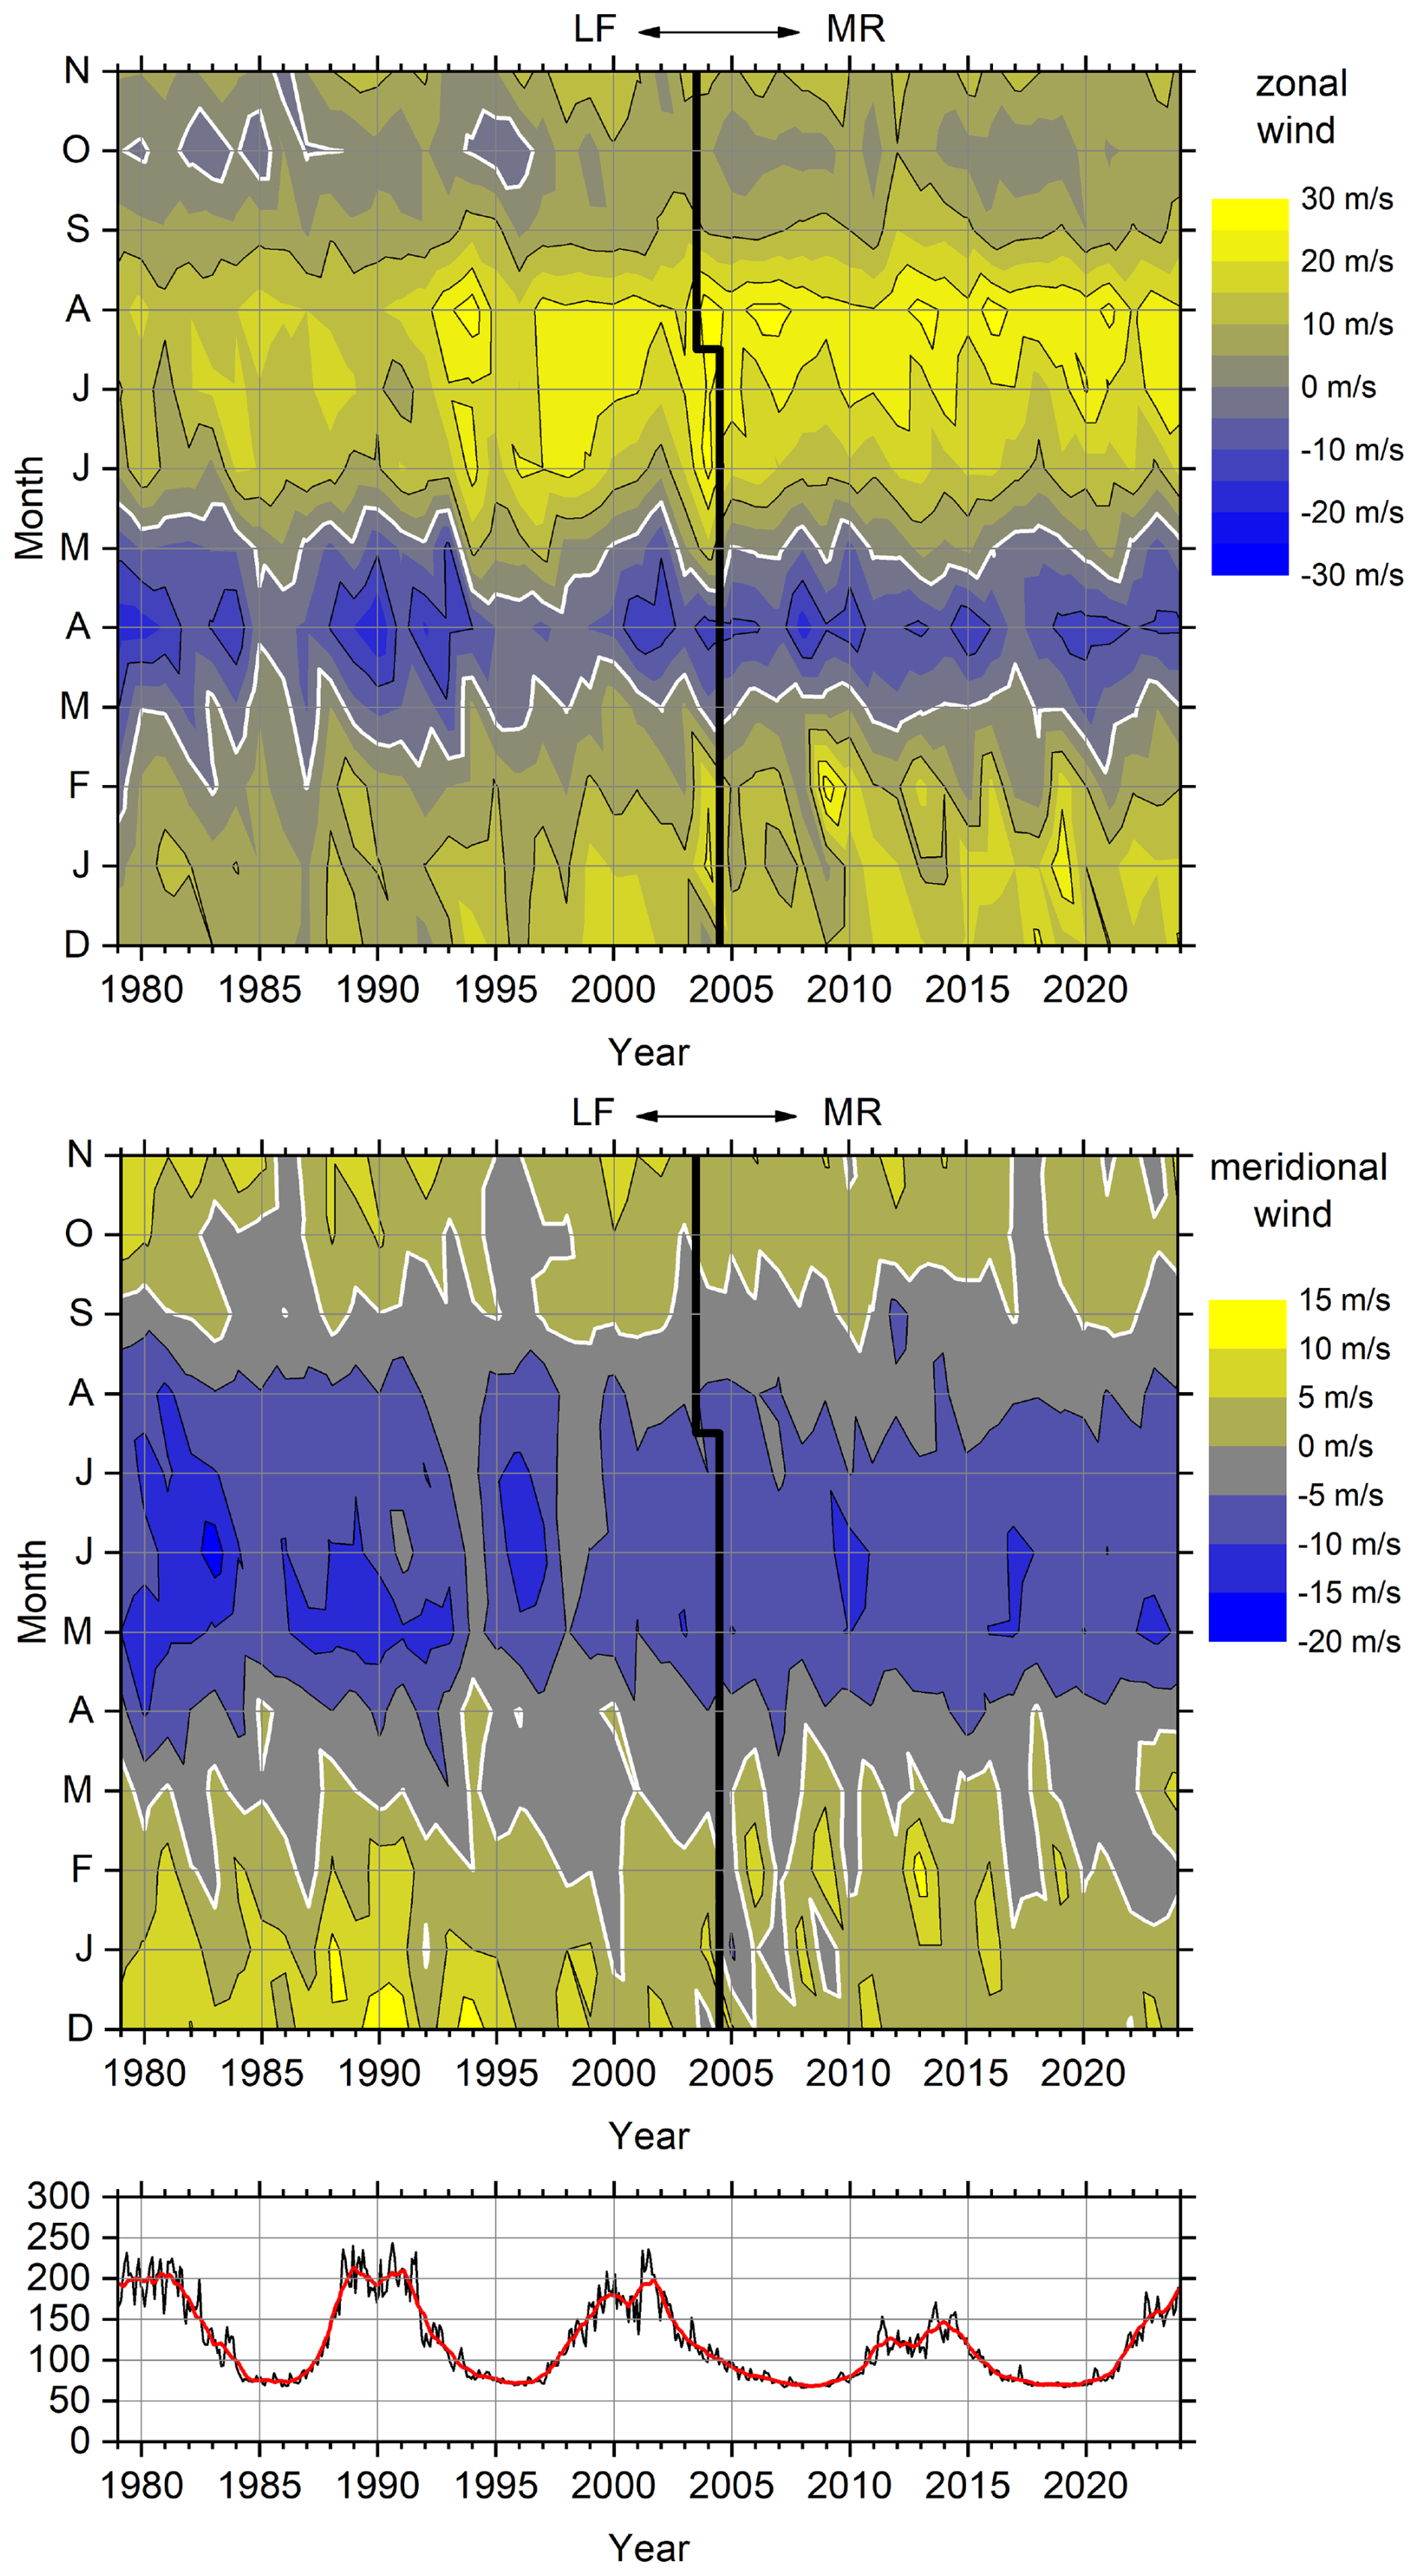
Figure 2Monthly zonal (upper panel) and meridional (middle panel) mean winds at about 90 km height over Collm. The December values refer to the previous year. Zero wind winds are indicated as solid white lines. Note the different colour scaling of the panels. Solid black lines indicate the change from LF to VHF observations. In the lower panel, the monthly F10.7 solar EUV proxies, given in solar flux units (sfu) are shown.
To investigate the possible SC effect in the presence of long-term changes, the monthly mean winds for each month of the year have been analysed using a multiple linear regression analysis:
where V represents the zonal or meridional mean wind, respectively, a is a constant offset, t is time in years, and F10.7 is the solar EUV proxy given in solar flux units (sfu). Minimizing ϵ delivers the linear trend b and the SC effect c for each month. Furthermore, we use the Lindeman–Merenda–Gold measure (LMG; Lindemann et al., 1980) as in Karagodin-Doyennel et al. (2021) to decompose R2 (coefficient of determination) and to determine explained variance by the trend and SC for the zonal and meridional wind over Collm (Fig. A2 in Appendix A).
The linear trends in Collm winds are shown in Fig. 3 for the full time series 1979–2024, and for the earlier (until 2001) and later (from 2002) part of it. The individual trends have been calculated from separate linear fits here, so that the overall trend, e.g., of the zonal winds in January, April, or September, does not necessarily have to lie between the individual ones, in particular if the trends are weak and/or insignificant. Note that Jacobi and Kürschner (2006) used the LF winds from 1979 to 2004 for their analysis, so that their results are very similar to those obtained here for the first part of the time series.
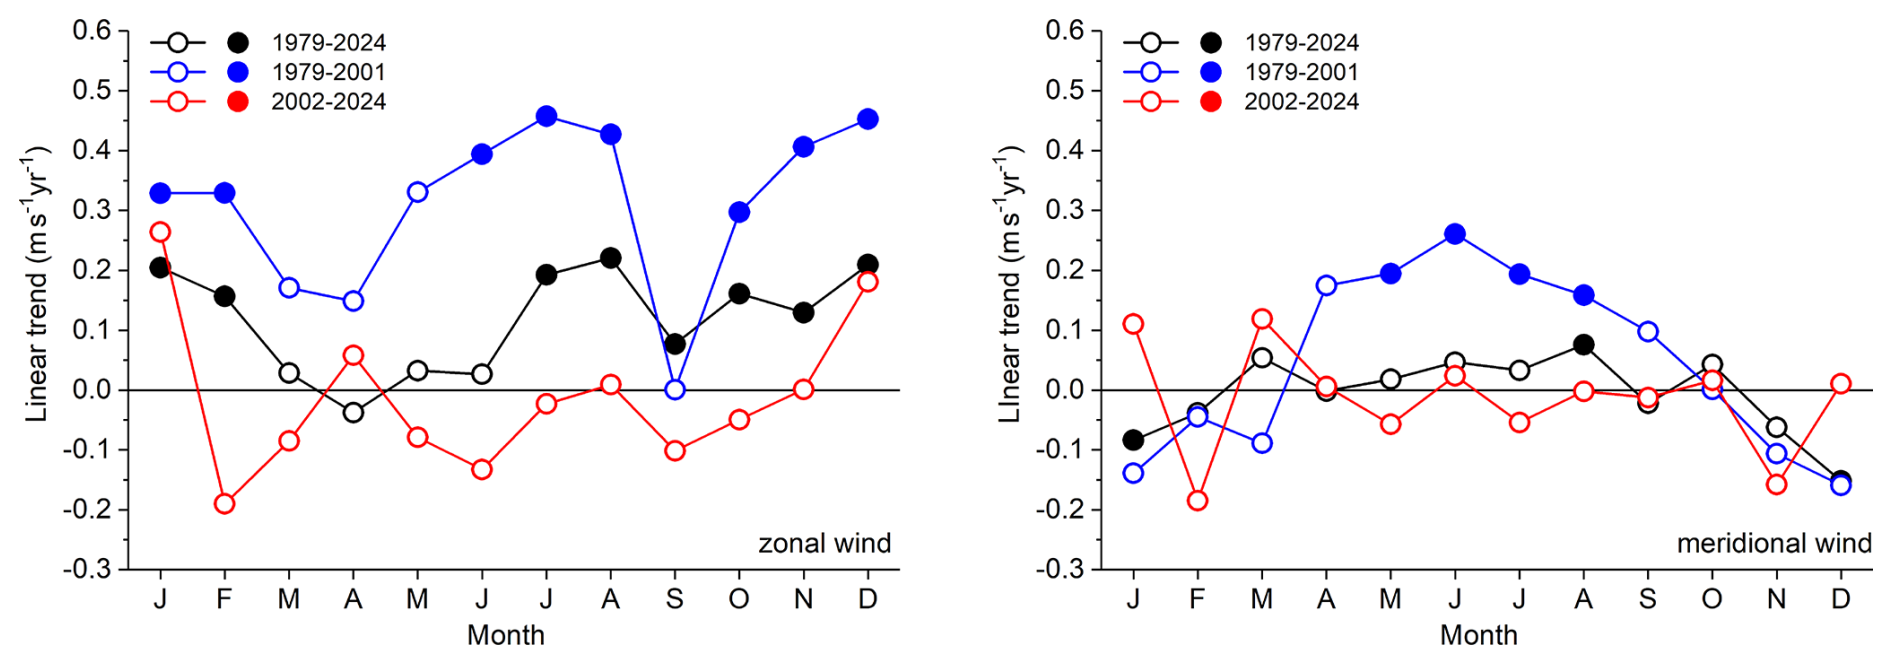
Figure 3Linear trend coefficients b from Eq. (3) in m s−1 yr−1 of the zonal (left panel) and meridional (right panel) mean winds at about 90 km height over Collm. Solid symbols indicate significant trends at the 95 % level according to a t-test considering autocorrelation, while open symbols show insignificant trends. The data refer to the full time series (1979–2024, black), as well as the first part (1979–2001, blue) and the second part (2002–2024, red).
The positive trends of the zonal wind that are visible during most of the year when analysing the whole time interval (left panel of Fig. 3, black symbols) are mainly due to those changes during the first half of the time interval (blue symbols), while the trend is inconclusive and not significant for the years after 2002 (open red symbols). Similarly, the positive/negative meridional wind trends in summer/winter are owing to partly significant trends obtained from the time interval 1979–2001 (blue symbols), but after 2002 there is no significant trend visible any more (open red symbols). This indicates a change in MLT dynamics after the 1990s that has already been described by Jacobi et al. (2015, 2023).
One possible reason for this change in linear trend is the ozone turnaround (Jacobi et al., 2015). In addition, Kumar et al. (2025) found a trend towards a weakened stratospheric polar vortex from 1980 until the early 2000s using Modern Era Retrospective Research analysis for Research and Application-2 (MERRA-2) reanalysis data, but a strengthening trend after the 2000s, which they attributed to Arctic surface changes. The corresponding change in Northern Annular Mode (NAM) trend was also accompanied by a change in winter northern midlatitude mesosphere zonal wind trends from positive to weakly negative as simulated by the Specified Dynamics Whole Atmosphere Community Climate Model with thermosphere-ionosphere eXtension (SD-WACCM-X). Their findings qualitatively agree with our results in the left panel of Fig. 3.
The solar effect coefficients c (in m s−1 sfu−1) of the Collm zonal and meridional winds at about 90 km are shown in Fig. 4. Again, as in Fig. 3 we show the analysis using the complete time series (black), and the earlier (blue) and later years (red). In the first part of the time series there is a negative SC effect during spring and a positive one in autumn/early winter (blue solid symbols), which has also been shown by Jacobi and Kürschner (2006) who analysed the Collm LF time series for 1979–2004. This SC effect is consistent with a stronger mesospheric easterly/westerly jet in summer/winter (see Keuer et al., 2007). This is partly seen in model results. Extended UK Meteorological Office stratosphere mesosphere model results by Arnold and Robinson (1998, 2000) showed stronger zonal wind in the high-latitude winter mesosphere for increased solar flux. Also, WACCM-X model results by Qian et al. (2019) show stronger zonal winds during solar maximum in winter. However, the negative connection between zonal wind and F10.7 in NH midlatitudes in spring and summer is not reproduced by WACCM-X at 90 km. A possible reason for this discrepancy is that the used model version predicted a too low winter wind reversal at higher midlatitudes.
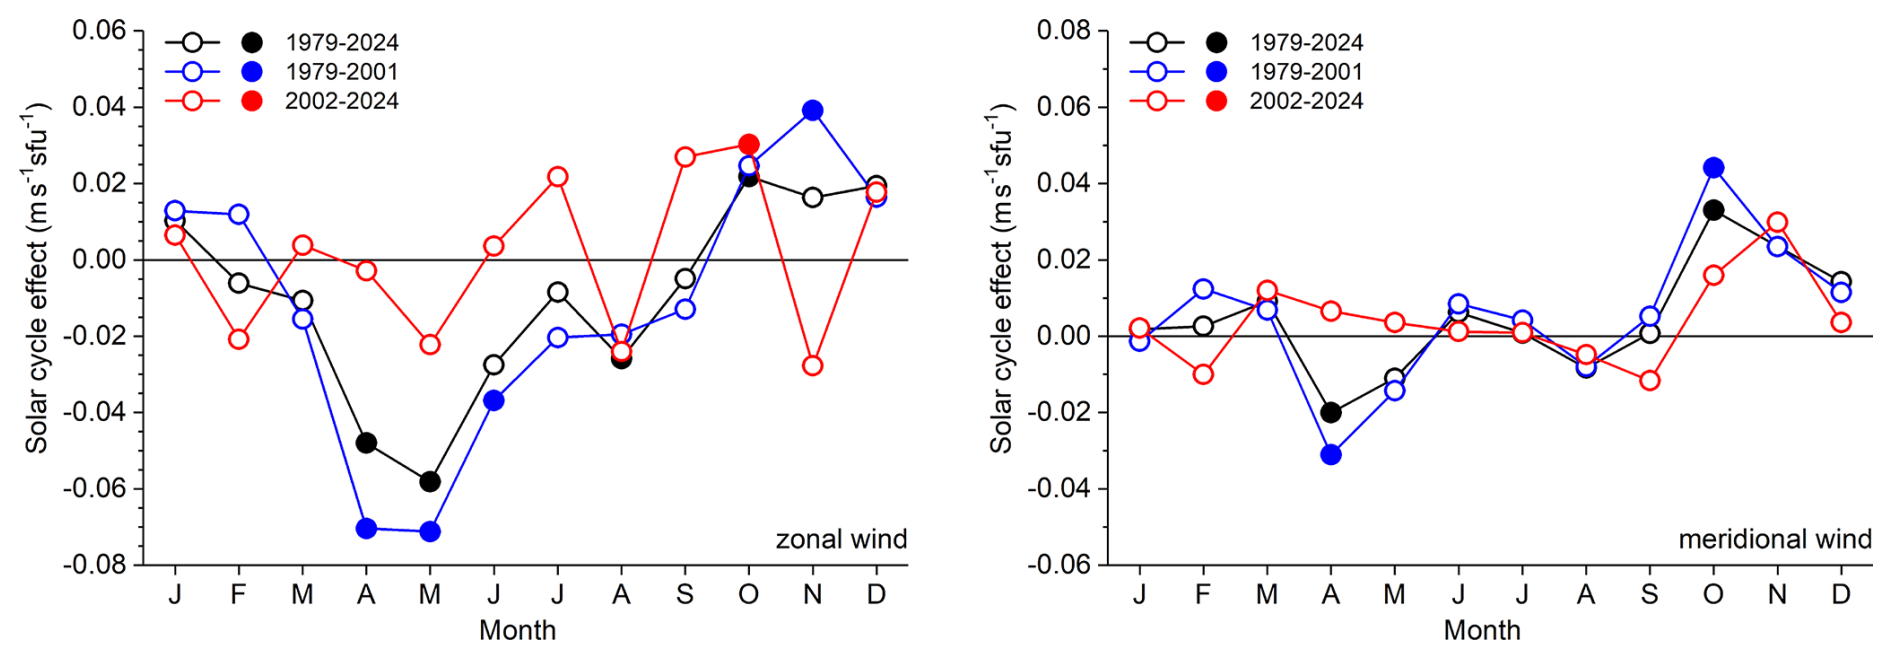
Similar to the linear trend, there is a change in the 2nd half of the time interval. The change of wind regime with respect to solar influence is also shown in running correlations in Appendix A (Fig. A1). They show a relatively stable SC effect until about year 2000, but after the turn of the millenium, except for early winter, the relationship changes with time and is insignificant for most months.
The strong SC signal in spring especially in the zonal wind component is not visible any more after the year 2002. Balanced winds calculated from SABER observations (Liu et al., 2023) show, from a multiple linear regression, positive coefficients of zonal winds to F10.7 near the mesopause (80–90 km altitude) at 50° N during most of the year. This correlation is significant in late autumn, which is also seen in Collm winds after 2002 (Fig. 4, left panel). In the meridional and zonal winds over Collm, after 2002 a positive signal remains in some months of autumn/early winter. Wilhelm et al. (2019) showed that the possible SC signature for observations starting 2002 strongly varies with altitude in the 80–100 km height range. Also from this, a significant signal at 90 km over Collm is not expected. The high-latitude results by Ramesh et al. (2024) of the zonal wind SC effect over Esrange differ from those obtained from the Collm observations. Ramesh et al. (2024), from observations during 1999–2022, found a negative correspondence of zonal winds and solar flux during autumn at 90 km, in contrast to Fig. 4, left panel. However, their positive SC coefficients for the meridional wind in early winter broadly agree with Collm results, although these are not significant. It has to be taken into account, however, that midlatitude and high-latitude wind changes may differ and comparisons have to be made with caution. During other months, there is no significant SC effect visible for Collm winds after 2002. The SH results by Noble et al. (2024) show different seasonal distributions than the ones over Esrange and Collm. This may hint to hemispheric differences of the solar influence on the MLT dynamics.
The change of trend and SC effect in the second half of the time series is also visible in their explained variance, shown in Fig. A2 in Appendix A. The linear trend and SC effect together explain up to 60 % of the variance in some months during the first half of the observations, but with few exceptions it is much lower for the data after the year 2001. In some autumn months, however, the total explained variance remains considerably large, for example, for the meridional wind in November or the zonal wind in October.
Earlier analyses of the SC effect using only part of the LF D1 observations (Jacobi, 1998) but including height finding indicated that the relatively strong zonal wind response in summer decreased with height, possibly through GW mean wind interaction. Also Keuer et al. (2007) showed a maximum SC effect at 85 km, but decreasing above. Therefore, it appears possible that in a shrinking middle atmosphere the SC effect only extends to lower altitudes due to a potential decrease in the height of wind systems.
Actually both the LF reflection heights and the mean meteor heights decrease with time due to the shrinking of the middle atmosphere (e.g., Kürschner and Jacobi, 2003; Dawkins et al., 2023). Therefore, when not using the height observations, we refer to a height that is slowly decreasing with time. This is, to a certain degree, equivalent to an analysis on constant pressure levels, with the wind systems also decreasing with height (e.g., Vincent et al., 2019, their Fig. 5). Compared to an analysis at fixed altitudes, this would give different trends in the case of vertical wind gradients in the MLT. In particular, in summer the positive mean zonal wind shear will potentially lead to a positive trend at a fixed level. Similarly, one may speculate that the lower mean LF reflection heights connected with stronger ionospheric D and lower E region ionisation during solar maximum (Kürschner and Jacobi, 2003) might lead to an apparent negative SC effect of zonal winds in summer. Both the positive trend and the negative SC effect are visible in the Collm winds before 2021. However, analyses of Collm winds with height finding at a fixed altitude showed similar trends and also qualitative correspondence with Saskatoon (52° N) PR observations (Jacobi et al., 2001). We may conclude that reference height changes of Collm winds may indeed lead to an apparent wind trend, but this does not lead to a qualitative difference to winds at fixed altitudes.
3.2 Comparison of Collm LF/MR and Juliusruh Partial Reflection radar winds
The best and most reliable coverage of PR radars is in the mesosphere. Therefore, given the limitations of LF observations below 85 km and of PR height determination above 84 km we compare Collm and Juliusruh SC signals at slightly different altitudes, namely about 90 km at Collm and 84 km at Juliusruh. This means that especially in late spring/early summer the observations refer to different wind systems, namely the mesospheric easterlies and the lower thermospheric westerly jet (see Fig. 1). From this, on the one hand some differences in long-term behaviour are expected, but since the mesosphere and lower thermosphere are dynamically coupled, at least qualitative correspondence is possible. The horizontal distance between the two sites amounts to about 400 km, so that, although individual hourly winds may differ by more than 20 m s−1 due to GWs and tides, only small latitudinal mean wind differences of less than 3 m s−1 at heights below 90 km are expected (Jacobi et al., 2019). The respective SC coefficients c (in m s−1 sfu−1) of the Collm and Juliusruh zonal and meridional wind are shown in Fig. 5. The analysed time interval is 1990–2024, so that the Collm results differ quantitatively from those shown in Fig. 4. The seasonal cycle of the Collm zonal wind solar effect (see the black symbols in the left panel of Fig. 4) is still visible, despite the shorter time interval analysed. The Juliusruh results, although from lower altitudes, show similar tendencies in most months, although they are not significant in nearly each month of the year. The SC effect seen in meridional winds, although qualitatively still similar to the black curve in Fig. 4, right panel, is insignificant except for autumn/early winter over Collm. However, the seasonal distribution of the SC coefficients is qualitatively similar for Collm and Juliusruh, indicating similar tendencies at the two different altitudes.
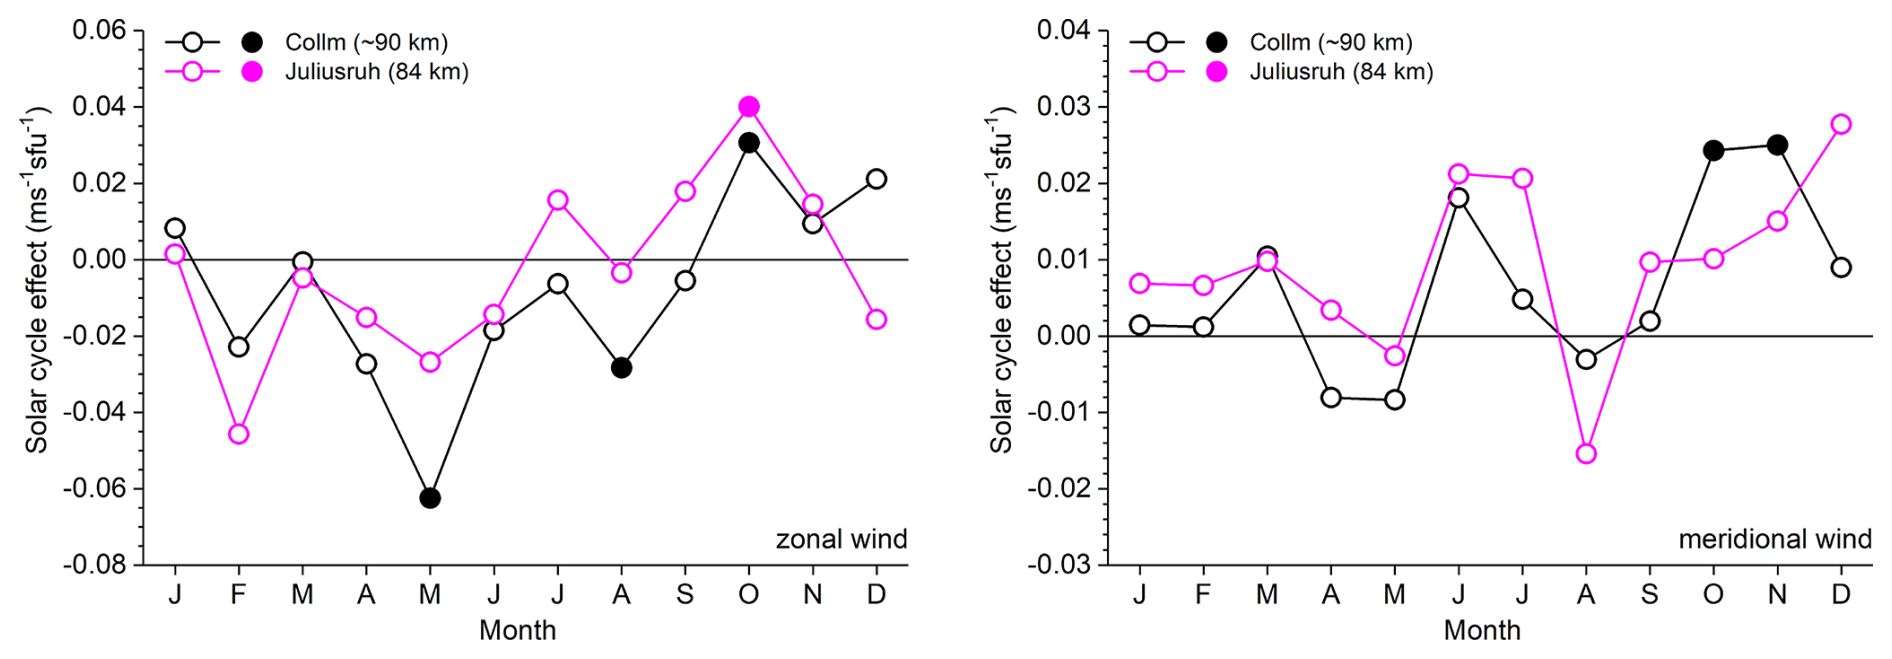
Figure 5SC effect (coefficients c from Eq. 3) in m s−1 sfu−1 of the zonal (left panel) and meridional (right panel) mean winds over Collm (black) and Juliusruh (magenta). Solid symbols indicate significant SC effects at the 95 % level according to a t-test. Time interval is 1990–2024.
From MR observations at Juliusruh 2002–2018, Wilhelm et al. (2019) reported no significant SC effect on meridional winds at 84 km altitude, similar to our results from the PR winds 1990–2024 in Fig. 5 or the Collm MR winds 2002–2024 in Fig. 4. However, they reported significant zonal wind amplitudes at the solar cycle time scale in winter and partly summer, which were not seen in the Juliusruh PR winds 1990–2024 in Fig. 5. This disagreement may be a result of the different periods analysed.
The mesosphere and lower thermosphere are dynamically coupled through GWs that are filtered in the mesospheric jet and force the zonal mean wind reversal above. Therefore, modulations of the mesospheric zonal wind jet, e.g. through the 11 year SC, potentially modulate GW amplitudes at the same time scales and also modulate the GW drag in the lower thermosphere. It is therefore of interest to analyse a possible SC effect in GW records that could give hints to the forcing mechanisms of the SC effect in the MLT.
To estimate GW proxies from Collm wind observations with height finding since 1984, deviations u′, v′ of the LF half-hourly means have been determined according to Gavrilov et al. (2001, 2002) and Jacobi et al. (2025). These deviations have been calculated as the differences of subsequent half-hourly mean winds, and variances have been analysed. Using half-hourly means is equivalent to a filter passing periods of about 0.7–2 h with a maximum near 1 h. The wind differences are not included in the further analysis, if the height changes by more than Δh=2 km from one half-hourly mean to another. For the VHF observations since 2004, the same method was applied using meteors from a 3 km height gate centered at 88 km.
3-monthly mean gravity wave proxies over Collm at an altitude of 88 km for summer (June–August, JJA, red) and winter (December–February, DJF, blue), taken from Jacobi et al. (2025), are shown in Fig. A3 in Appendix A. Jacobi (2014) has reported a strong quasi-decadal variation of GW proxies from LF observations until 2007, and this is also visible in the first part of the time series shown in Fig. A3. Later, as with the background wind, this signature disappears. Analysing the SC effect c according to Eq. (3) in Fig. 6 shows significant positive values for the full dataset (1984–2024), except for December, February and March when the effect is still positive, but insignificant. But this is only owing to the first part of the time series. After 2002, there is no significant SC effect visible any more (mostly open red symbols in Fig. 6), except for November. Thus, as for the mean winds, this indicates a possible change after the 1990s. The seasonal cycle of the c coefficients for GW proxies in the time interval 2002–2024 is qualitatively similar to the one of the meridional mean wind (red curve in Fig. 4), but the GW values are not statistically significant.
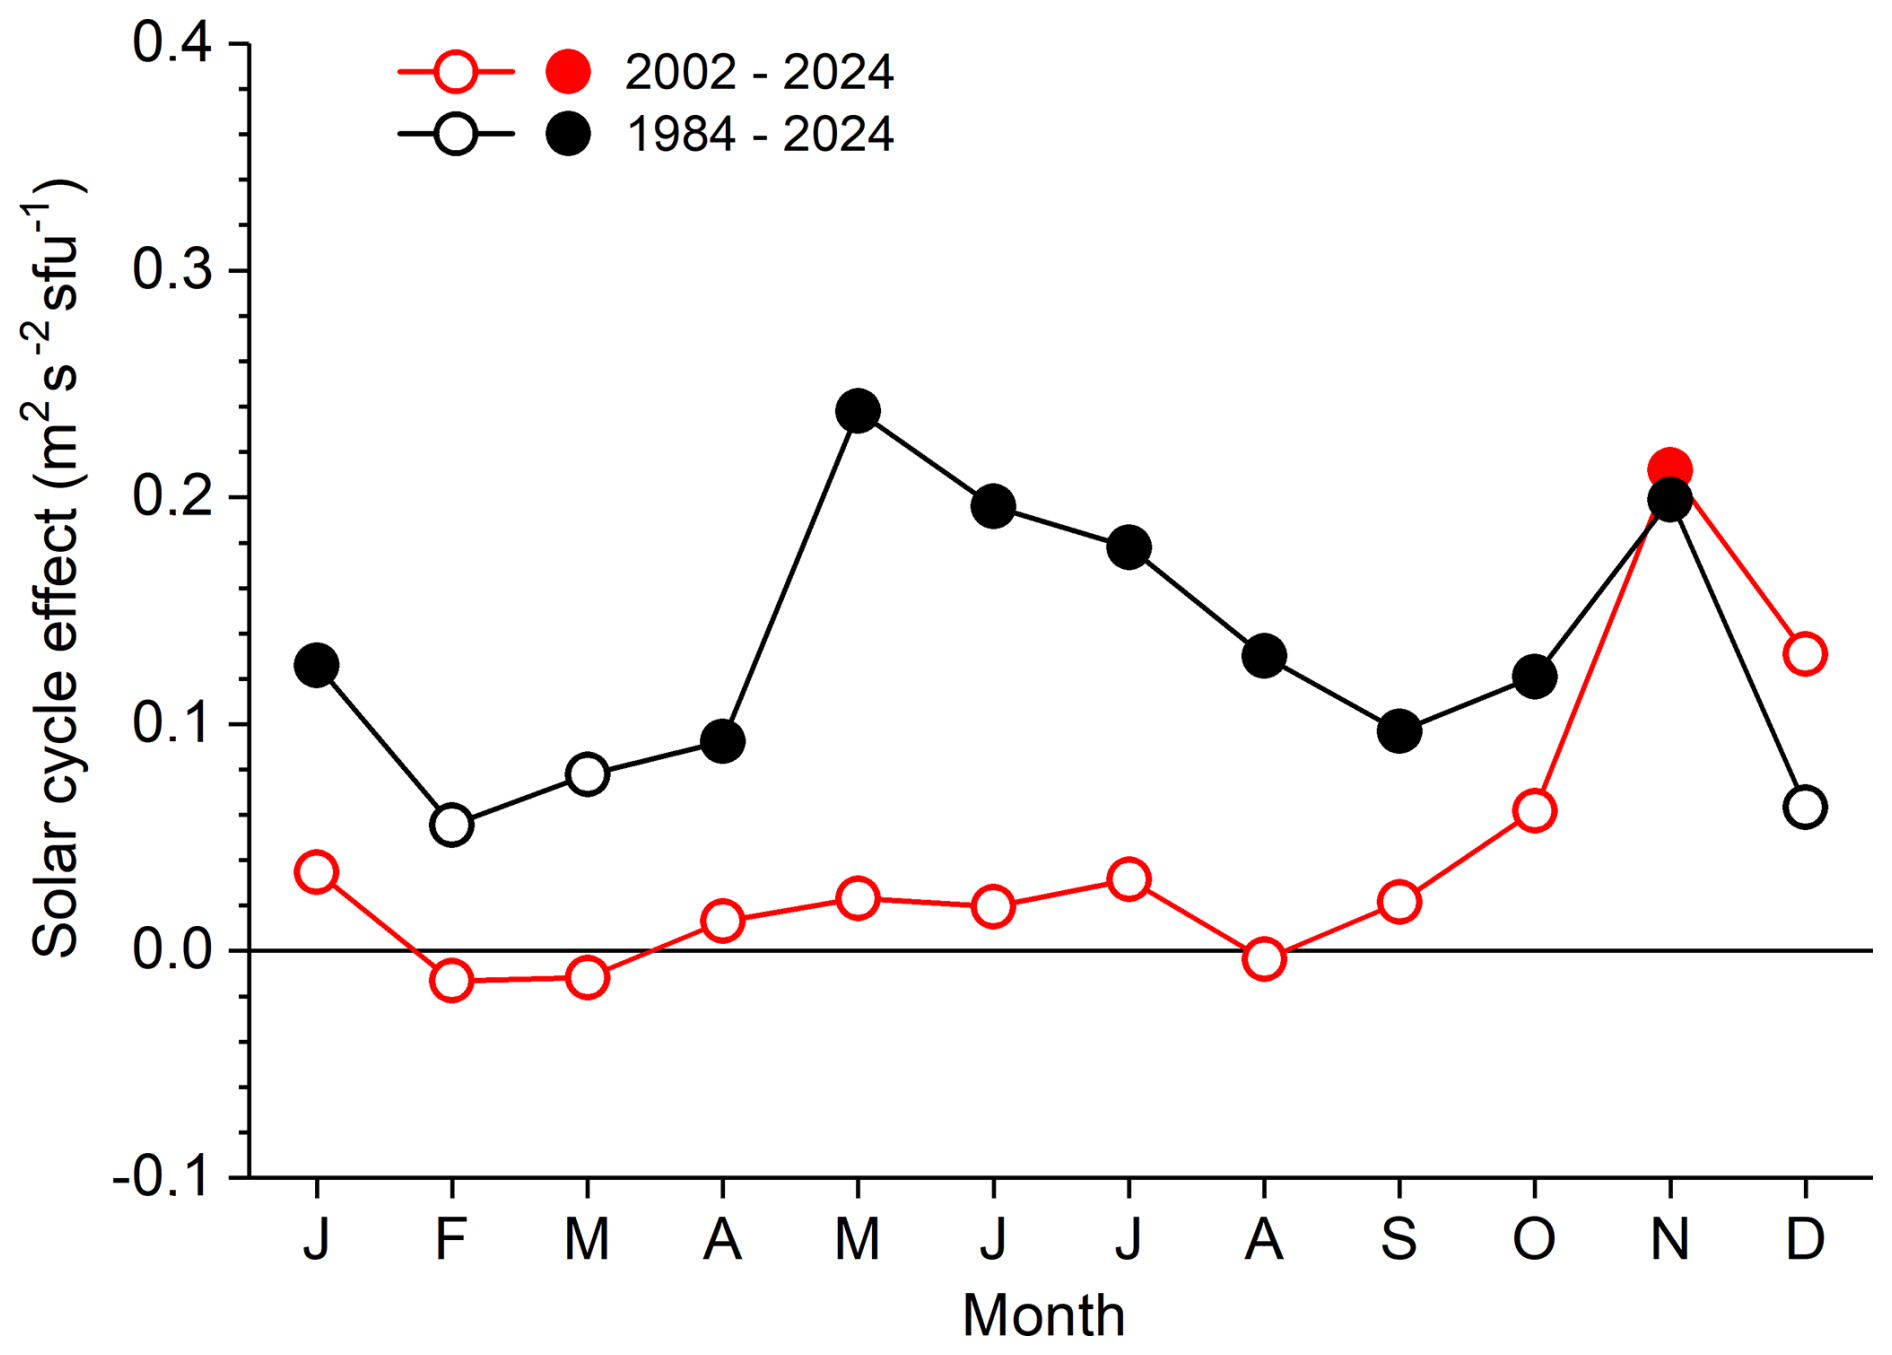
Figure 6SC effect (coefficients c from Eq. 3) of the total variance as a GW proxy over Collm for the time intervals 1984–2024 (black) and 2002–2024 (red). Solid symbols indicate significant SC effects at the 95 % level according to a t-test.
Perminov et al. (2024) analysed hydroxyl nightglow emissions over Zvenigorod (55.7° N, 36.8° E) during 2002–2024 and found a strong positive SC for temperature oscillations with the same period range as used here. Thus, given that GW kinetic and potential energy is connected, their results are qualitatively similar to our ones for 1984–2001, however, we cannot confirm their results for the observations after the turn of the millenium. Hydroxyl emissions are observed without height finding. Often, their height and full width at half maximum are given as 87 and 8 km, respectively, but they may change due to dynamics (e.g., Wüst et al., 2023). Thus, it is possible that the nightglow GW analyses are contaminated by a SC in background dynamics. On the other hand, our LF height observations may also be affected by a possibly more variable lower E region ionosphere during solar maximum and the large SC effect observed by LF might not be exclusively due to neutral wind dynamics.
For comparison, we also analysed TIMED/SABER GW potential energy per volume (Epot,V, Ern et al., 2018). Since GWs are strongly intermittent, a sufficient number of data points is needed for obtaining robust averages (see also Ern et al., 2022). Therefore, we averaged over 30° longitude and 12° latitude over the Collm area (see Jacobi et al., 2025) for years 2002–2022. However, the seasonal distribution of SC coefficients is different from the one for Collm GW proxies, or meridional mean winds (see Fig. B1 in Appendix B). Earlier analyses Jacobi et al. (2025) have shown qualitatively similar long-term linear trends of Epot,V and Collm variances, but this correspondence obviously only holds for the long-term linear trend and is not visible at decadal time scales. Differences may be due to (i) the different parameters analysed; (ii) the different wavelength ranges seen by radar and satellite (Wright et al., 2016); (iii) the spatial averaging of the satellite observations, so that regional effects are possible. One explanation for the insignificant SABER response could be that SABER is more sensitive to longer intrinsic wave periods, i.e., slower intrinsic phase speeds (Alexander et al., 2010, their Fig. 8b). This means that SABER GW activity should be more susceptible to short-term variability of the atmospheric background by global-scale waves which could mask longer-term variations. Such short-term variability has been found, for example, for planetary waves at mid and high latitudes (e.g., Matthias and Ern, 2018), or for tides at low latitudes (e.g., Ern et al., 2021; Forbes et al., 2022).
Analyses of more than four decades (1979–2024) of Collm MLT wind measurements show long-term trends and SC effects. Similar tendencies of the seasonal distribution of the MLT wind response to solar EUV changes are visible in most months from Juliusruh PR observations 1990–2024. Together, the results suggest that solar forcing remains an important, season-dependent driver of mid-latitude MLT dynamics. After the 1990s, linear trends and the SC effect changed and strongly weakened. A possible SC effect after the year 2000 remains only in early winter, which is also seen in satellite balanced winds (Liu et al., 2023). The overall solar signal after the year 2000 seems to be weak and partly inconclusive. This indicates a change of MLT dynamics after the 1990s, possibly due to changes in trends of the NH circulation (Kumar et al., 2025), the ozone turnaround in the stratosphere, or the recently weakened SCs 24 and 25. Since the SC effect, particularly in summer, decreases with altitude in the MLT (Jacobi, 1998) it is possible that the change in mean wind and consequently in the height of GW mean wind interaction modulates the height up to which the SC effect is visible. Thejll et al. (2003) showed varying influence of the SC on stratospheric dynamics which they attributed to varying SC strength. However, one has to take into account a long-term decrease in measuring height as well (e.g., Kürschner and Jacobi, 2003; Dawkins et al., 2023). It is also possible that simply the weaker recent SCs are not strong enough any more to produce a significant effect. And finally, we cannot rule out artefacts because the LF reflection heights decrease with increasing solar flux due to the strengthening of the ionospheric D and E layers (Kürschner and Jacobi, 2003).
GW proxies from the Collm winds show a SC variability until the end of the 1990s, but this strongly decreases in the following decades, in most months, except for autumn. GW proxies in the 21st century still show a possible correspondence of the GW SC effect with mean wind variations in autumn, however, GW proxies from SABER potential energy do not show a clear correspondence of the SC effect with the one seen in winds. The latter may be due to the different parameters analysed, the spatial averaging of satellite observations, or the different and hardly overlapping observational filters of VHF radar and SABER observations.
Apart from a solar influence, there are other (potential) drivers of NH MLT wind variability such as the equatorial Quasi-Biennial Oscillation (QBO), El Niño-Southern Oscillation (ENSO), or North Atlantic Oscillation (NAO). These drivers generally show a clear dynamical signature in the winter NH stratosphere. Their possible contribution to MLT dynamics has been analysed, e.g., by Ramesh et al. (2024) or Noble et al. (2024). While Ramesh et al. (2024) found a positive response of the QBO at 30 hPa on NH high-latitude zonal winds in the upper mesosphere, the effect in the SH as observed by Noble et al. (2024) was strongest in summer. In both cases the QBO and ENSO influence decreases with height. However, reanalyses and model results showed that the QBO effect on mesospheric winds changes between middle and high latitudes, and in parts of the higher midlatitudes it is therefore weak (Koval et al., 2022). Furthermore, the QBO effect changes sign with altitude. For example, Jaen et al. (2022) did not find a conclusive QBO effect on MLT summer wind analyses at European mid and high latitudes, and only some indications for oscillations at QBO and ENSO periods in midlatitude mesospheric winds. Earlier analyses of Collm winds (Jacobi et al., 1996) only showed a weak QBO effect on MLT winds observed by LF at about 90 km in winter. Similarly, only weak signatures of ENSO (Jacobi and Kürschner, 2002) in Collm LF winds at 90 km were found and later analyses using height resolved MR observations revealed that the possible ENSO effect on the MLT is strongly height dependent, changes sign with height, and is actually weak at 90 km, which was also reproduced by numerical modelling (Jacobi et al., 2017; Ermakova et al., 2019). Also, earlier analyses of LF Collm winds have shown a positive NAO signature in zonal winds 1979–1996 (Jacobi and Beckmann, 1999), but this connection was not stable when including later years into the analysis.
We conclude that, since the signature of QBO, ENSO and NAO is strong in the stratosphere but changes sign in the upper middle atmosphere, observations at 90 km are not well suited to capture their dynamical effects in the MLT. Further analyses of winds below and above that height might help to more clearly identify the influence of QBO, ENSO and NAO on the MLT, and may also show whether these potential influences change with time as the solar forcing does.
Here, we only analysed monthly mean winds and included the effect of tides in Eqs. (1) and (2) only to avoid biases due to daily data gaps. Earlier publications (Greisiger et al., 1987; Bremer et al., 1997; Jacobi et al., 1997) from observations and tidal amplitude analyses since the 1960s relied of analyses of time series obtained by one method. They show decreasing tidal amplitude trends, but these trends were not uniform, and decadal and interdecadal variations are visible in the time series. Analyses of a possible SC effect revealed results that change with time (Jacobi et al., 1997). Moreover, at different locations the semidiurnal tidal trends differ substantially (Jacobi et al., 2012), which suggests the rather regional character of these trends, possibly due to the influence of nonmigrating tides. In principle, trend analyses of tidal amplitudes from a combination of Collm LF D1 and MR observations would be of interest. But comparison of LF D1 and MR wind analyses has shown that LF spaced receiver measurements strongly underestimate tidal amplitudes (Jacobi, 2011). Therefore, so far we have not yet tried to combine the LF D1 and MR tide observations into one time series.
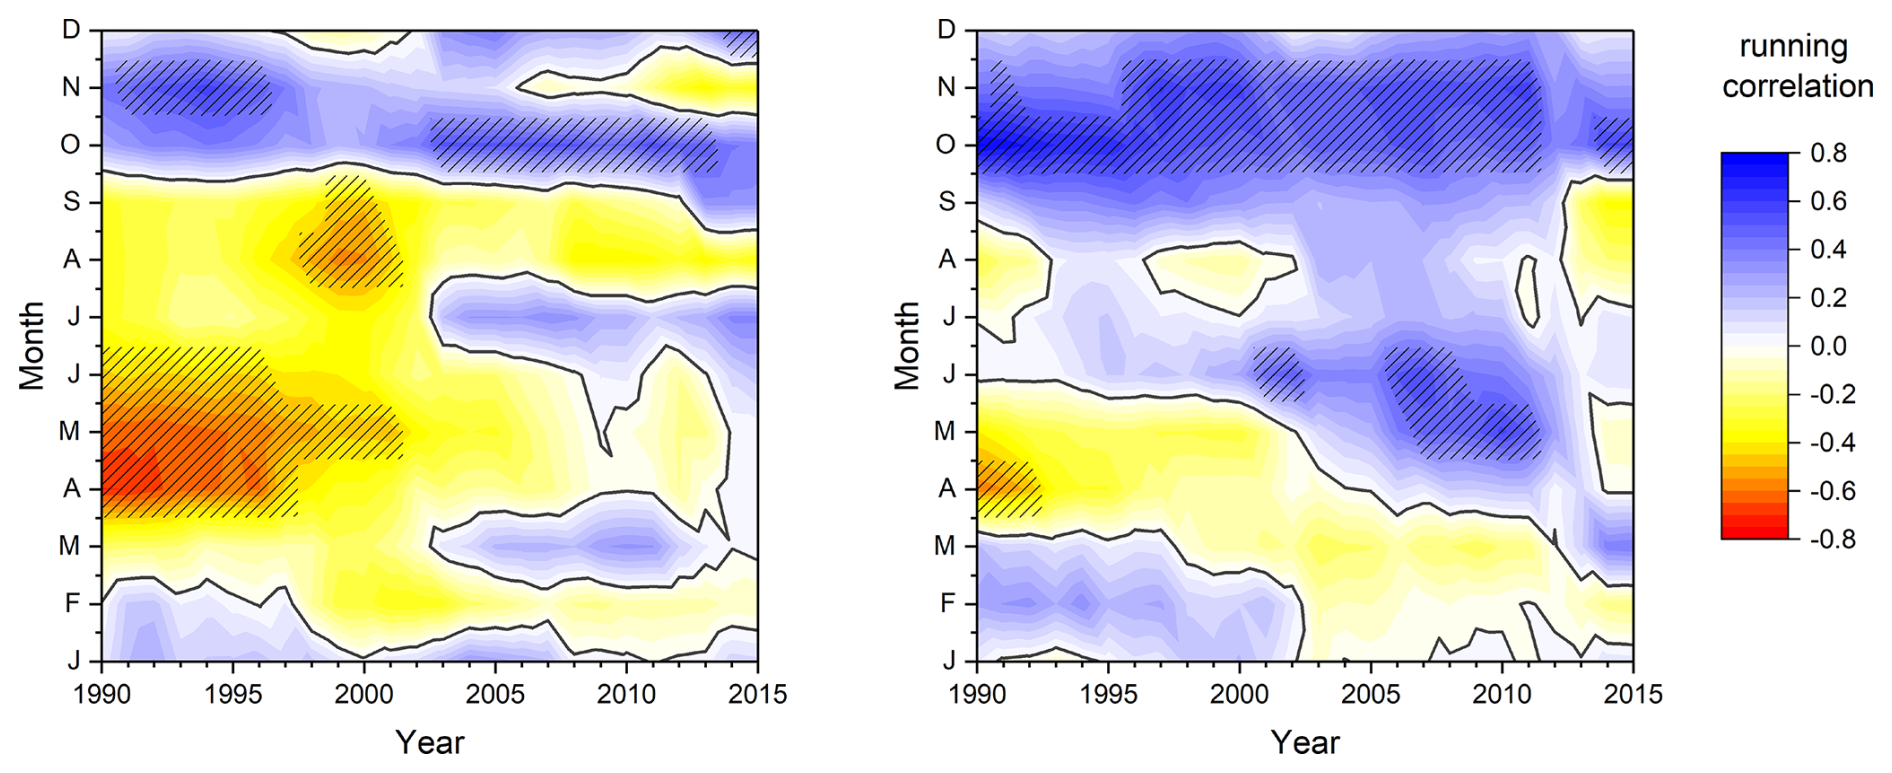
Figure A1Running correlation coefficients of F10.7 with Collm zonal wind (left panel) and meridional wind (right panel), each based of 23 years of monthly mean data. Years on the abscissa indicate the center of the respective time interval. Significant correlations according to a t-test considering autocorrelation (Eq. A4 in Metz, 1991) are hatched.
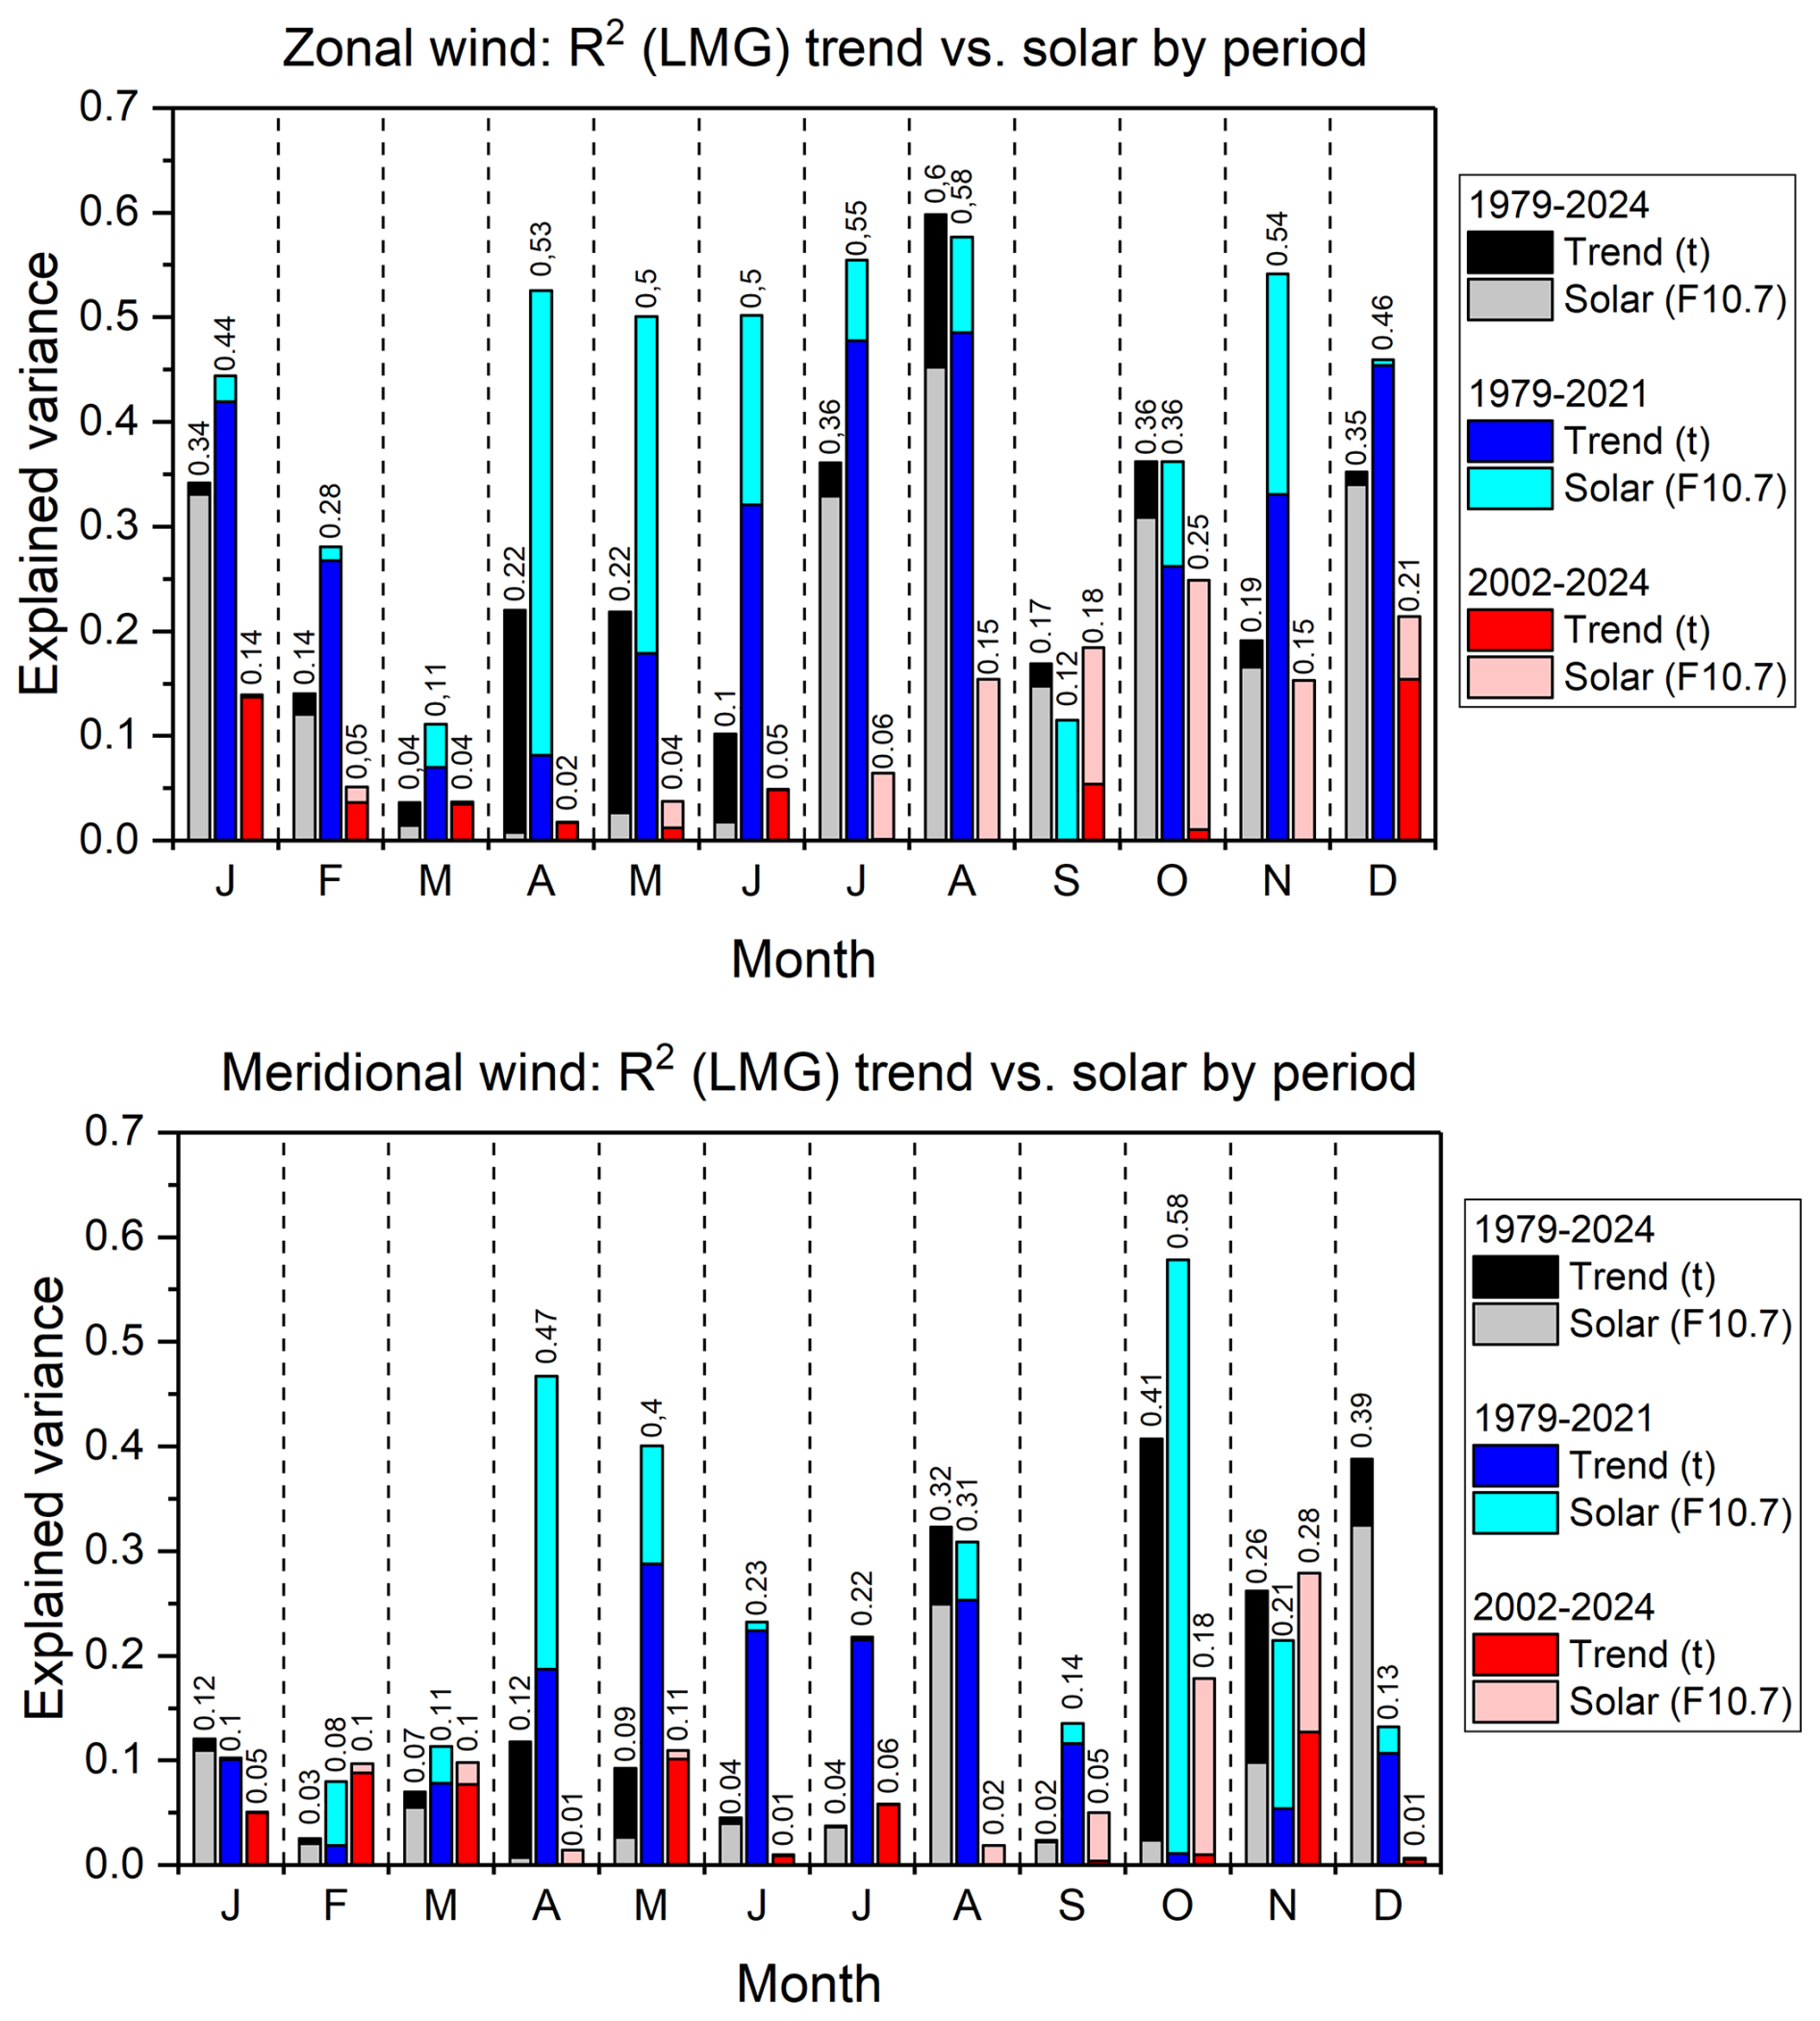
Figure A2Decomposed R2 (coefficient of determination) by the trend and SC effect for the zonal (upper panel) and meridional (lower panel) wind over Collm for each month, according to Lindemann et al. (1980, LMG). The data refer to the full time series (1979–2024, black/grey), the first part (1979–2001, blue) and the second part (2002–2024, red). The numbers over the bars show the total explained variance.
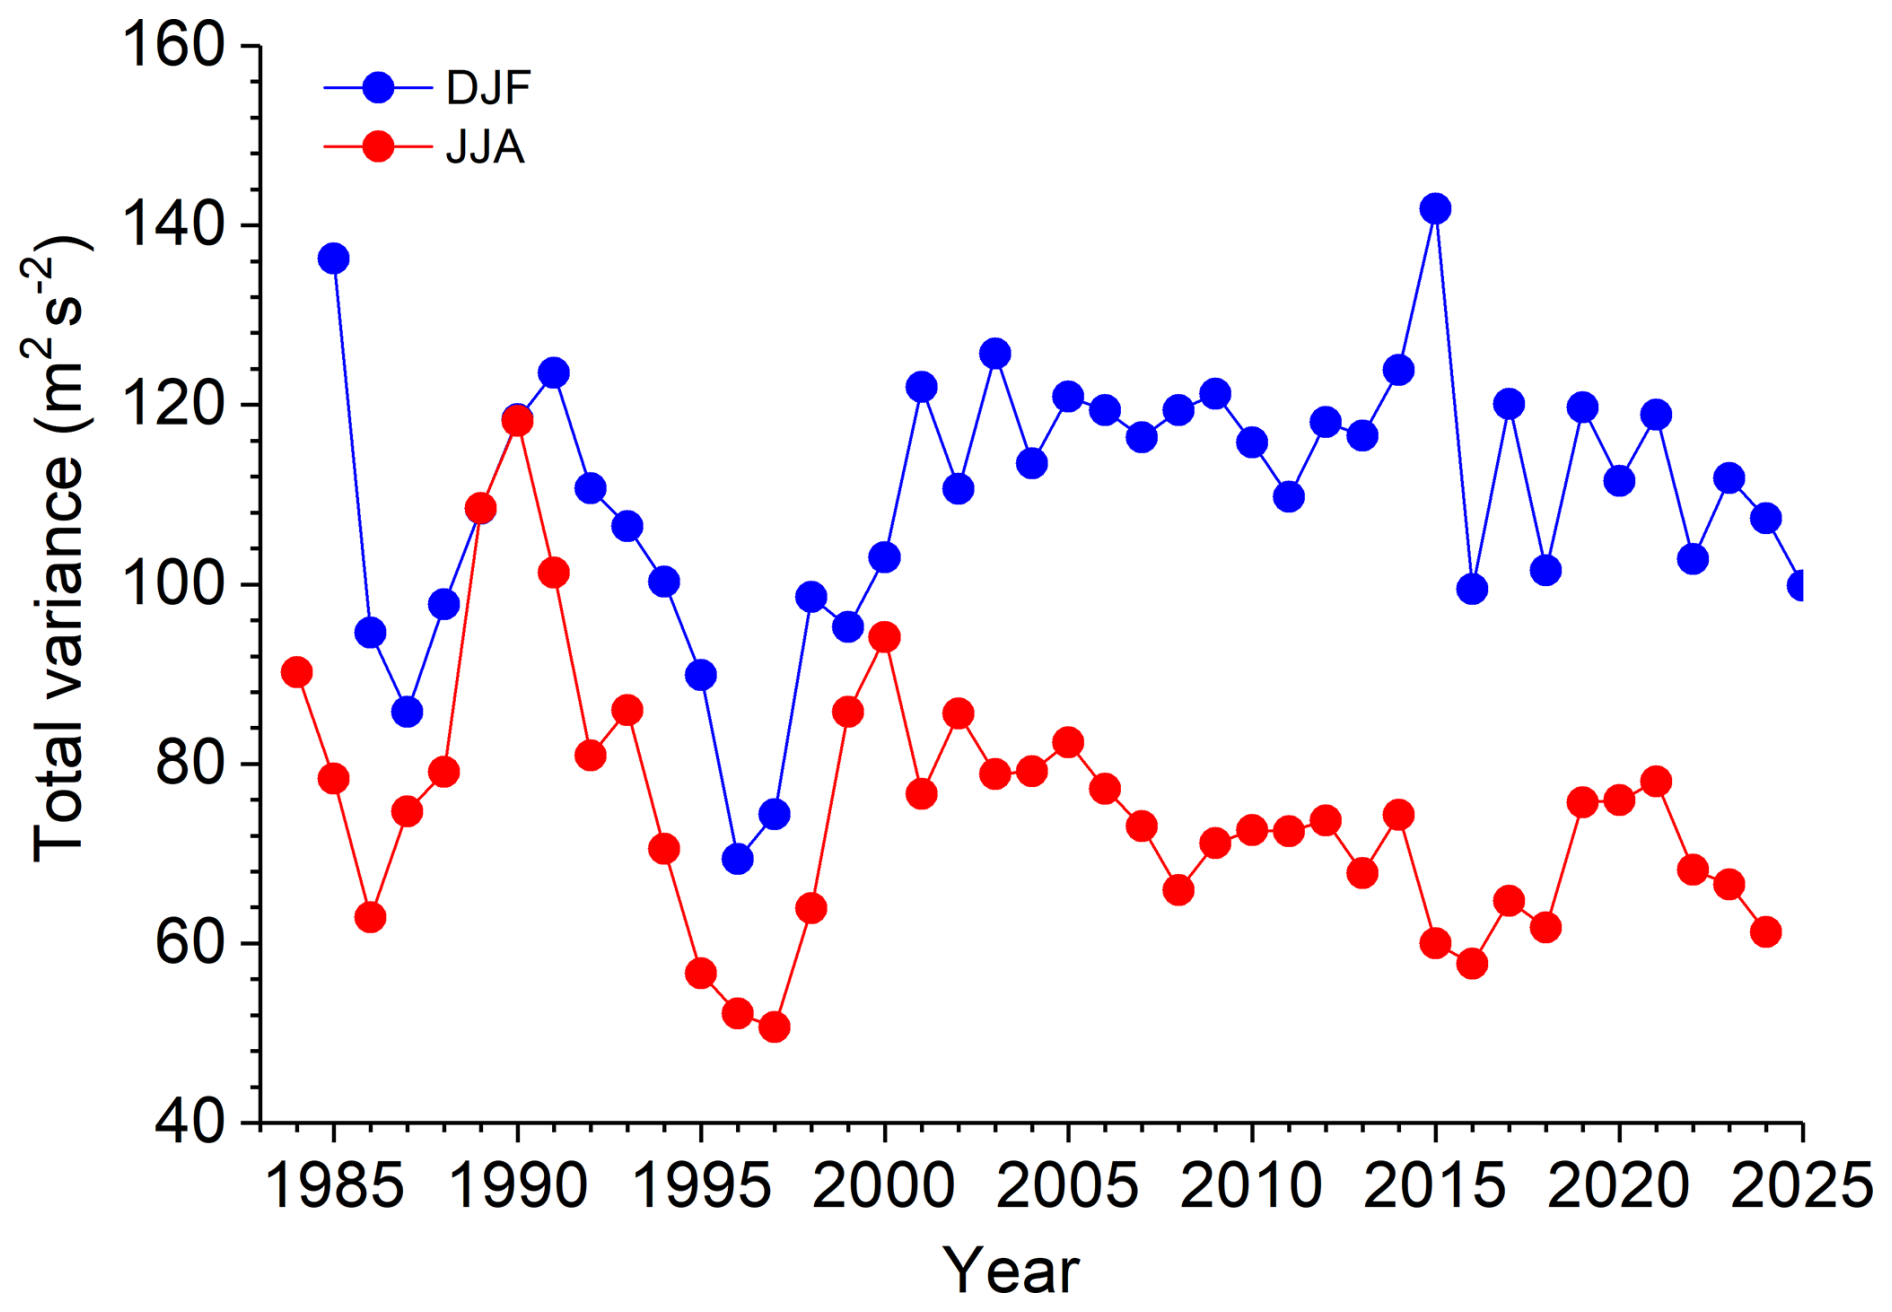
Figure A33-monthly mean gravity wave proxies for summer (JJA, red) and winter (DJF, blue). These data have already been shown in Jacobi et al. (2025, their Fig. 4).
We use SABER GW potential energy per volume (Epot,V) given in J m−3. If a considered GW does not dissipate and GW wavelengths do not change, Epot,V should be a conserved quantity like GW momentum flux (Strelnikova et al., 2021). The TIMED satellite performs yaw manoeuvres every about 60 d, and the SABER latitude coverage changes accordingly. For northward-viewing periods the SABER latitude coverage is about 50° S–82° N, and 82° S–50° N for southward-viewing periods. The time interval analysed is 2002–2022, and linear trends compared with Collm GW proxies have already been presented by Jacobi et al. (2025).
SC coefficients of Collm and SABER GW proxies are shown in Fig. B1. To be able to compare the observations, we show analyses based only on observations from 2002 through 2022. We also added the coefficients for the meridional mean wind over Collm at approx. 90 km. The seasonal distribution of the Collm coefficients (black symbols) shows some correspondence with the effect in the meridional wind; in particular, there is a positive correspondence in early winter (see Fig. 4). The SC effect coefficients of the Epot,V from SABER in Fig. 6 do not show a correspondence with the Collm ones.
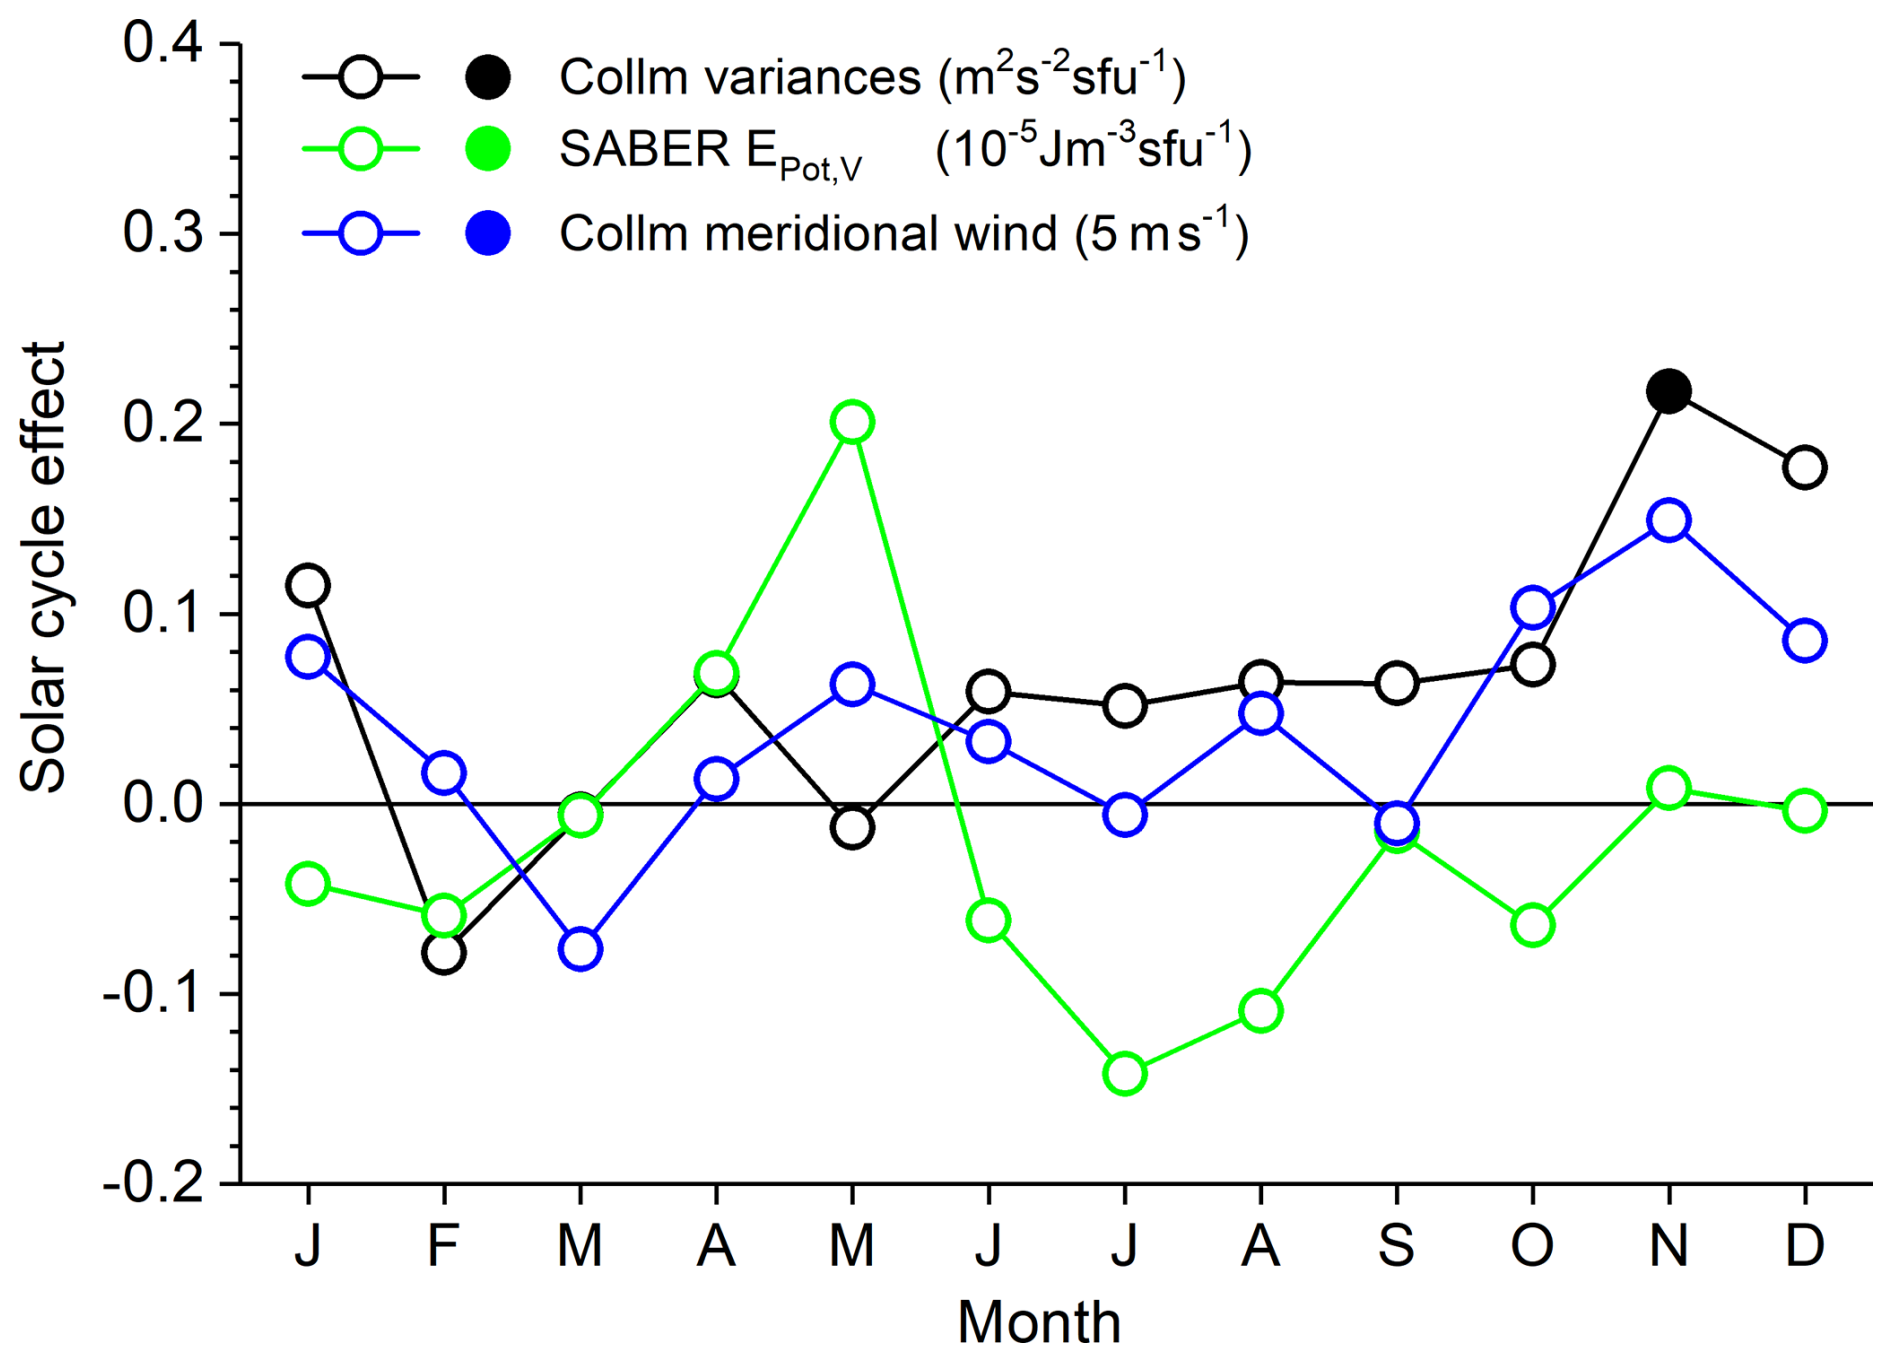
Figure B1SC effect (coefficients c from Eq. 3) based on 2002–2022 data at 88 km of the total variance over Collm (black) and SABER GW potential energy per volume (Epot,V, green). Collm meridional mean wind coefficients are added in blue color. Solid symbols indicate significant SC effects at the 95 % level according to a t-test.
Collm wind data are available on request by C. Jacobi. Juliusruh wind data are available on request by T. Renkwitz (renkwitz@iap-kborn.de). F10.7 solar radio flux data have been provided by Space Weather Canada, Government of Canada, on https://www.spaceweather.gc.ca/ (last access: 8 August 2025). SABER data are available open access from GATS Inc. at https://saber.gats-inc.com/browse_data.php (GATS, 2024).
C. Jacobi initiated the study, provided the Collm wind data and prepared the first draft of the paper. A. Kuchar contributed to the trend and SC analysis. M. Ern provided SABER satellite data. T. Renkwitz, R. Latteck and J. L. Chau provided the Juliusruh wind data. All authors actively contributed to the writing of the final version.
At least one of the (co-)authors is a guest member of the editorial board of Advances in Radio Science for the special issue “Kleinheubacher Berichte 2025”. The peer-review process was guided by an independent editor, and the authors also have no other competing interests to declare.
Publisher's note: Copernicus Publications remains neutral with regard to jurisdictional claims made in the text, published maps, institutional affiliations, or any other geographical representation in this paper. The authors bear the ultimate responsibility for providing appropriate place names. Views expressed in the text are those of the authors and do not necessarily reflect the views of the publisher.
This article is part of the special issue “Kleinheubacher Berichte 2025”. It is a result of the Kleinheubacher Tagung 2025, Miltenberg, Germany, 23–25 September 2025.
This research has been supported by the Deutsche Forschungsgemeinschaft (grant no. 452408779).
This paper was edited by Matthias Förster and reviewed by two anonymous referees.
Alexander, M. J., Geller, M., McLandress, C., Polavarapu, S., Preusse, P., Sassi, F., Sato, K., Eckermann, S., Ern, M., Hertzog, A., Kawatani, Y., Pulido, M., Shaw, T. A., Sigmond, M., Vincent, R., and Watanabe, S.: Recent developments in gravity-wave effects in climate models and the global distribution of gravity-wave momentum flux from observations and models, Q. J. Roy. Meteor. Soc., 136, 1103–1124, https://doi.org/10.1002/qj.637, 2010. a
Arnold, N. F. and Robinson, T. R.: Solar cycle changes to planetary wave propagation and their influence on the middle atmosphere circulation, Ann. Geophys., 16, 69–76, https://doi.org/10.1007/s00585-997-0069-3, 1998. a, b
Arnold, N. F. and Robinson, T. R.: Amplification of the influence of solar flux variations on the winter stratosphere by planetary waves, Space Sci. Rev., 94, 279–286, https://doi.org/10.1023/A:1026783609783, 2000. a, b
Arnold, N. F. and Robinson, T. R.: Solar magnetic flux influences on the dynamics of the winter middle atmosphere, Geophys. Res. Lett., 28, 2381–2384, https://doi.org/10.1029/2000GL012825, 2001. a
Bremer, J., Schminder, R., Greisiger, K., Hoffmann, P., Kürschner, D., and Singer, W.: Solar cycle dependence and long-term trends in the wind field of the mesosphere/lower thermosphere, J. Atmos. Sol.-Terr. Phys., 59, 497–509, https://doi.org/10.1016/S1364-6826(96)00032-6, 1997. a, b, c
Charuvil Asokan, H., Chau, J. L., Marino, R., Vierinen, J., Vargas, F., Urco, J. M., Clahsen, M., and Jacobi, C.: Frequency spectra of horizontal winds in the mesosphere and lower thermosphere region from multistatic specular meteor radar observations during the SIMONe 2018 campaign, Earth Planet. Space, 74, 69, https://doi.org/10.1186/s40623-022-01620-7, 2022. a
Dartt, D., Nastrom, G., and Belmont, A.: Seasonal and solar cycle wind variations, 80–100 km, J. Atmos. Terr. Phys., 45, 707–718, https://doi.org/10.1016/S0021-9169(83)80029-4, 1983. a
Dawkins, E. C. M., Stober, G., Janches, D., Carrillo-Sánchez, J. D., Lieberman, R. S., Jacobi, C., Moffat-Griffin, T., Mitchell, N. J., Cobbett, N., Batista, P. P., Andrioli, V. F., Buriti, R. A., Murphy, D. J., Kero, J., Gulbrandsen, N., Tsutsumi, M., Kozlovsky, A., Kim, J. H., Lee, C., and Lester, M.: Solar cycle and long-term trends in the observed peak of the meteor altitude distributions by meteor radars, Geophys. Res. Lett., 50, e2022GL101953, https://doi.org/10.1029/2022GL101953, 2023. a, b
D'yachenko, V., Lysenko, I., and Portnyagin, Y.: Long term periodicities in lower thermospheric wind variations, J. Atmos. Terr. Phys., 48, 1117–1119, https://doi.org/10.1016/0021-9169(86)90032-2, 1986. a
Ermakova, T. S., Aniskina, O. G., Statnaia, I. A., Motsakov, M. A., and Pogoreltsev, A. I.: Simulation of the ENSO influence on the extra-tropical middle atmosphere, Earth Planet. Space, 71, 8, https://doi.org/10.1186/s40623-019-0987-9, 2019. a
Ern, M., Trinh, Q. T., Preusse, P., Gille, J. C., Mlynczak, M. G., Russell III, J. M., and Riese, M.: GRACILE: a comprehensive climatology of atmospheric gravity wave parameters based on satellite limb soundings, Earth Syst. Sci. Data, 10, 857–892, https://doi.org/10.5194/essd-10-857-2018, 2018. a
Ern, M., Diallo, M., Preusse, P., Mlynczak, M. G., Schwartz, M. J., Wu, Q., and Riese, M.: The semiannual oscillation (SAO) in the tropical middle atmosphere and its gravity wave driving in reanalyses and satellite observations, Atmos. Chem. Phys., 21, 13763–13795, https://doi.org/10.5194/acp-21-13763-2021, 2021. a
Ern, M., Preusse, P., and Riese, M.: Intermittency of gravity wave potential energies and absolute momentum fluxes derived from infrared limb sounding satellite observations, Atmos. Chem. Phys., 22, 15093–15133, https://doi.org/10.5194/acp-22-15093-2022, 2022. a
Forbes, J. M., Ern, M., and Zhang, X.: The Global Monsoon Convective System as Reflected in Upper Atmosphere Gravity Waves, J. Geophys. Res.-Space, 127, e2022JA030572, https://doi.org/10.1029/2022JA030572, 2022. a
GATS: SABER – Sounding of the Atmosphere using Broadband Emission Radiometry, https://saber.gats-inc.com/data.php (last access: 1 June 2024), 2024. a
Gavrilov, N., Jacobi, C., and Kürschner, D.: Climatology of ionospheric drift perturbations at Collm, Germany, Adv. Space Res., 27, 1779–1784, https://doi.org/10.1016/S0273-1177(01)00339-8, 2001. a
Gavrilov, N. M., Fukao, S., Nakamura, T., Jacobi, C., Kürschner, D., Manson, A. H., and Meek, C. E.: Comparative study of interannual changes of the mean winds and gravity wave activity in the middle atmosphere over Japan, Central Europe and Canada, J. Atmos. Sol.-Terr. Phys., 64, 1003–1010, https://doi.org/10.1016/S1364-6826(02)00055-X, 2002. a
Greisiger, K., Schminder, R., and Kürschner, D.: Long-period variations of wind parameters in the mesopause region and the solar cycle dependence, J. Atmos. Terr. Phys., 49, 281–285, https://doi.org/10.1016/0021-9169(87)90063-8, 1987. a, b, c
Hoffmann, P., Becker, E., Singer, W., and Placke, M.: Seasonal variation of mesospheric waves at northern middle and high latitudes, J. Atmos. Sol.-Terr. Phys., 72, 1068–1079, https://doi.org/10.1016/j.jastp.2010.07.002, 2010. a
Jacobi, C.: On the solar cycle dependence of winds and planetary waves as seen from mid-latitude D1 LF mesopause region wind measurements, Ann. Geophys., 16, 1534–1543, https://doi.org/10.1007/s00585-998-1534-3, 1998. a, b, c
Jacobi, C.: Meteor radar measurements of mean winds and tides over Collm (51.3° N, 13° E) and comparison with LF drift measurements 2005–2007, Adv. Radio Sci., 9, 335–341, https://doi.org/10.5194/ars-9-335-2011, 2011. a, b
Jacobi, C.: 6 year mean prevailing winds and tides measured by VHF meteor radar over Collm (51.3°N, 13.0°E), J. Atmos. Sol.-Terr. Phys., 78–79, 8–18, https://doi.org/10.1016/j.jastp.2011.04.010, 2012. a
Jacobi, C.: Long-term trends and decadal variability of upper mesosphere/lower thermosphere gravity waves at midlatitudes, J. Atmos. Sol.-Terr. Phys., 118, 90–95, https://doi.org/10.1016/j.jastp.2013.05.009, 2014. a, b
Jacobi, C. and Beckmann, B.: On the connection between upper atmospheric dynamics and tropospheric parameters: Correlations between mesopause region winds and the North Atlantic Oscillation, Climatic Change, 43, 629–643, https://doi.org/10.1023/A:1005451227975, 1999. a
Jacobi, C. and Kürschner, D.: A possible connection of mid-latitude mesosphere/lower thermosphere zonal winds and the southern oscillation, Phys. Chem. Earth Parts A/B/C, 27, 571–577, https://doi.org/10.1016/S1474-7065(02)00039-6, 2002. a
Jacobi, C. and Kürschner, D.: Long-term trends of MLT region winds over Central Europe, Phys. Chem. Earth Parts A/B/C, 31, 16–21, https://doi.org/10.1016/j.pce.2005.01.004, 2006. a, b, c, d, e, f
Jacobi, C., Schminder, R., and Kürschner, D.: On the influence of the stratospheric quasi-biennial oscillation on the mesopause zonal wind over Central Europe, Meteorol. Z., 5, 318–323, https://doi.org/10.1127/metz/5/1996/318, 1996. a
Jacobi, C., Schminder, R., Kürschner, D., Bremer, J., Greisiger, K., Hoffmann, P., and Singer, W.: Long-term trends in the mesopause wind field obtained from LF D1 wind measurements at Collm, Germany, Adv. Space Res., 20, 2085–2088, https://doi.org/10.1016/S0273-1177(97)00599-1, 1997. a, b, c, d
Jacobi, C., Lange, M., Kürschner, D., Manson, A., and Meek, C.: A long-term comparison of saskatoon MF radar and collm LF D1 mesosphere-lower thermosphere wind measurements, Phys. Chem. Earth, 26, 419–424, https://doi.org/10.1016/S1464-1917(01)00023-X, 2001. a
Jacobi, C., Portnyagin, Y., Merzlyakov, E., Solovjova, T., Makarov, N., and Kürschner, D.: A long-term comparison of mesopause region wind measurements over Eastern and Central Europe, J. Atmos. Sol.-Terr. Phys., 67, 229–240, https://doi.org/10.1016/j.jastp.2004.10.002, 2005. a
Jacobi, C., Hoffmann, P., Liu, R., Merzlyakov, E., Portnyagin, Y., Manson, A., and Meek, C.: Long-term trends, their changes, and interannual variability of Northern Hemisphere midlatitude MLT winds, J. Atmos. Sol.-Terr. Phys., 75–76, 81–91, https://doi.org/10.1016/j.jastp.2011.03.016, 2012. a, b
Jacobi, C., Lilienthal, F., Geißler, C., and Krug, A.: Long-term variability of mid-latitude mesosphere-lower thermosphere winds over Collm (51°N, 13°E), J. Atmos. Sol.-Terr. Phys., 136, 174–186, https://doi.org/10.1016/j.jastp.2015.05.006, 2015. a, b, c, d, e, f, g, h, i, j, k
Jacobi, C., Ermakova, T., Mewes, D., and Pogoreltsev, A. I.: El Niño influence on the mesosphere/lower thermosphere circulation at midlatitudes as seen by a VHF meteor radar at Collm (51.3° N, 13° E), Adv. Radio Sci., 15, 199–206, https://doi.org/10.5194/ars-15-199-2017, 2017. a
Jacobi, C., Lilienthal, F., Stober, G., Korotyshkin, D., and Merzlyakov, E.: Mesosphere/lower thermosphere winds measured with nearby SKiYMET meteor radars at Collm and Juliusruh, and comparison with Kazan winds, kleinheubach Conference 2019, https://ieeexplore.ieee.org/document/8890153 (last access: 26 June 2026), 2019. a
Jacobi, C., Kuchar, A., Renkwitz, T., and Jaen, J.: Long-term trends of midlatitude horizontal mesosphere/lower thermosphere winds over four decades, Adv. Radio Sci., 21, 111–121, https://doi.org/10.5194/ars-21-111-2023, 2023. a, b, c, d, e, f, g, h
Jacobi, C., Karami, K., Kuchar, A., Ern, M., Renkwitz, T., Latteck, R., and Chau, J. L.: Long-term changes and trends of mesosphere/lower thermosphere gravity waves over Collm, Germany, Adv. Radio Sci., 23, 21–31, https://doi.org/10.5194/ars-23-21-2025, 2025. a, b, c, d, e, f, g
Jaen, J., Renkwitz, T., Chau, J. L., He, M., Hoffmann, P., Yamazaki, Y., Jacobi, C., Tsutsumi, M., Matthias, V., and Hall, C.: Long-term studies of mesosphere and lower-thermosphere summer length definitions based on mean zonal wind features observed for more than one solar cycle at middle and high latitudes in the Northern Hemisphere, Ann. Geophys., 40, 23–35, https://doi.org/10.5194/angeo-40-23-2022, 2022. a, b
Karagodin-Doyennel, A., Rozanov, E., Kuchar, A., Ball, W., Arsenovic, P., Remsberg, E., Jöckel, P., Kunze, M., Plummer, D. A., Stenke, A., Marsh, D., Kinnison, D., and Peter, T.: The response of mesospheric H2O and CO to solar irradiance variability in models and observations, Atmos. Chem. Phys., 21, 201–216, https://doi.org/10.5194/acp-21-201-2021, 2021. a
Keuer, D., Hoffmann, P., Singer, W., and Bremer, J.: Long-term variations of the mesospheric wind field at mid-latitudes, Ann. Geophys., 25, 1779–1790, https://doi.org/10.5194/angeo-25-1779-2007, 2007. a, b, c, d, e, f
Koval, A. V., Gavrilov, N. M., Pogoreltsev, A. I., and Kandieva, K. K.: Dynamical impacts of stratospheric QBO on the global circulation up to the lower thermosphere, J. Geophys. Res.-Atmos., 127, e2021JD036095, https://doi.org/10.1029/2021JD036095, 2022. a
Kumar, S., Oberheide, J., Zhang, J., Pedatella, N. M., and Lu, X.: Linking Long-Term Arctic Surface Variability and Changes in the Stratosphere, Mesosphere, and Lower Thermosphere, J. Geophys. Res.-Atmos., 130, e2025JD045294, https://doi.org/10.1029/2025JD045294, 2025. a, b, c, d
Kürschner, D., Schminder, R., Singer, W., and Bremer, J.: Ein neues Verfahren zur Realisierung absoluter Reflexionshöhenmessungen an Raumwellen amplitudenmodulierter Rundfunksender bei Schrägeinfall im Langwellenbereich als Hilfsmittel zur Ableitung von Windprofilen in der oberen Mesopausenregion, Z. Meteorol., 37, 322–332, 1987. a
Kürschner, D. and Jacobi, C.: Quasi-biennial and decadal variability obtained from long-term measurements of nighttime radio wave reflection heights over Central Europe, Adv. Space Res., 32, 1701–1706, https://doi.org/10.1016/S0273-1177(03)90465-0, 2003. a, b, c, d
Lindemann, R. H., Merenga, P. F., and Gold, R. Z.: Introduction to bivariate and multivariate analysis, Scott, Foresman and Co., Glenview, Ill, ISBN 0673150992, 9780673150998, 1980. a, b
Liu, X., Xu, J., Yue, J., and Andrioli, V. F.: Variations in global zonal wind from 18 to 100 km due to solar activity and the quasi-biennial oscillation and El Niño–Southern Oscillation during 2002–2019, Atmos. Chem. Phys., 23, 6145–6167, https://doi.org/10.5194/acp-23-6145-2023, 2023. a, b, c
Matthias, V. and Ern, M.: On the origin of the mesospheric quasi-stationary planetary waves in the unusual Arctic winter 2015/2016, Atmos. Chem. Phys., 18, 4803–4815, https://doi.org/10.5194/acp-18-4803-2018, 2018. a
Merzlyakov, E., Murphy, D., Vincent, R., and Portnyagin, Y.: Long-term tendencies in the MLT prevailing winds and tides over Antarctica as observed by radars at Molodezhnaya, Mawson and Davis, J. Atmos. Sol.-Terr. Phys., 71, 21–32, https://doi.org/10.1016/j.jastp.2008.09.024, 2009. a
Metz, W.: Optimal relationship of large-scale flow patterns and the barotropic feedback due to high-frequency eddies, J. Atmos. Sci., 48, 1141–1159, https://doi.org/10.1175/1520-0469(1991)048<1141:OROLSF>2.0.CO;2, 1991. a
Middleton, H. R., Mitchell, N. J., and Muller, H. G.: Mean winds of the mesosphere and lower thermosphere at 52° N in the period 1988–2000, Ann. Geophys., 20, 81–91, https://doi.org/10.5194/angeo-20-81-2002, 2002. a, b
Noble, P. E., Hindley, N. P., Wright, C. J., Cullens, C., England, S., Pedatella, N., Mitchell, N. J., and Moffat-Griffin, T.: Interannual variability of winds in the Antarctic mesosphere and lower thermowphere over Rothera (67°S, 68°W) during 2005–2021 in meteor radar observations and WACCM-X, J. Geophys. Res.-Atmos., 129, e2023JD039789, https://doi.org/10.1029/2023JD039789, 2024. a, b, c, d, e
Perminov, V. I., Pertsev, N. N., Semenov, V. A., Dalin, P. A., and Sukhodoev, V. A.: Long-term changes in the activity of wave disturbances in the mesopause region, Dokl. Earth Sc., 519, 1942–1946, https://doi.org/10.1134/S1028334X24603511, 2024. a, b
Portnyagin, Y., Merzlyakov, E., Solovjova, T., Jacobi, C., Kürschner, D., Manson, A., and Meek, C.: Long-term trends and year-to-year variability of mid-latitude mesosphere/lower thermosphere winds, J. Atmos. Sol.-Terr. Phys., 68, 1890–1901, https://doi.org/10.1016/j.jastp.2006.04.004, 2006. a
Portnyagin, Y. I., Kaidalov, G. V., Greisiger, K. M., and Sprenger, K.: Zur Abhängigkeit der Windparameter der Mesopausenregion vom 11-jährigen Zyklus der Sonnenaktivität, Phys. Solariterr., 5, 91–96, 1977. a
Qian, L., Jacobi, C., and McInerney, J.: Trends and solar irradiance effects in the mesosphere, J. Geophys. Res.-Space, 124, 1343–1360, https://doi.org/10.1029/2018JA026367, 2019. a, b, c, d
Ramesh, K., Mitchell, N. J., Hindley, N. P., and Moffat-Griffin, T.: Long-term variability and tendencies in mesosphere and lower thermosphere winds from meteor radar observations over Esrange (67.9°N, 21.1°E), J. Geophys. Res.-Atmos., 129, e2023JD040404, https://doi.org/10.1029/2023JD040404, 2024. a, b, c, d, e, f, g
Schminder, R. and Kürschner, D.: Permanent monitoring of the upper mesosphere and lower thermosphere wind fields (prevailing and semidiurnal tidal components) obtained from LF D1 measurements in 1991 at the Collm Geophysical Observatory, J. Atmos. Terr. Phys., 56, 1263–1269, https://doi.org/10.1016/0021-9169(94)90064-7, 1994. a
Sprenger, K. and Schminder, R.: Results of ten years' ionospheric drift measurements in the l.f. range, J. Atmos. Sol.-Terr. Phys., 29, 183–199, https://doi.org/10.1016/0021-9169(67)90132-8, 1967. a
Sprenger, K. and Schminder, R.: Solar cycle dependence of winds in the lower ionosphere, J. Atmos. Terr. Phys., 31, 217–221, https://doi.org/10.1016/0021-9169(69)90100-7, 1969a. a, b, c
Sprenger, K. and Schminder, R.: On some relationships between correlation analysis and similar-fade analysis results of drift measurements in the lower ionosphere, J. Atmos. Terr. Phys., 31, 1085–1098, https://doi.org/10.1016/0021-9169(69)90107-X, 1969b. a
Stober, G., Chau, J. L., Vierinen, J., Jacobi, C., and Wilhelm, S.: Retrieving horizontally resolved wind fields using multi-static meteor radar observations, Atmos. Meas. Tech., 11, 4891–4907, https://doi.org/10.5194/amt-11-4891-2018, 2018. a
Stober, G., Kuchar, A., Pokhotelov, D., Liu, H., Liu, H.-L., Schmidt, H., Jacobi, C., Baumgarten, K., Brown, P., Janches, D., Murphy, D., Kozlovsky, A., Lester, M., Belova, E., Kero, J., and Mitchell, N.: Interhemispheric differences of mesosphere–lower thermosphere winds and tides investigated from three whole-atmosphere models and meteor radar observations, Atmos. Chem. Phys., 21, 13855–13902, https://doi.org/10.5194/acp-21-13855-2021, 2021. a
Strelnikova, I., Almowafy, M., Baumgarten, G., Baumgarten, K., Ern, M., Gerding, M., and Lübken, F.-J.: Seasonal cycle of gravity wave potential energy densities from Lidar and satellite observations at 54 and 69 N, J. Atmos. Sci., 78, 1359–1386, https://doi.org/10.1175/JAS-D-20-0247.1, 2021. a
Thejll, P., Christiansen, B., and Gleisner, H.: On correlations between the North Atlantic Oscillation, geopotential heights, and geomagnetic activity, Geophys. Res. Lett., 30, 1347, https://doi.org/10.1029/2002GL016598, 2003. a
Vincent, R. A., Kovalam, S., Murphy, D. J., Reid, I. M., and Younger, J. P.: Trends and Variability in Vertical Winds in the Southern Hemisphere Summer Polar Mesosphere and Lower Thermosphere, J. Geophys. Res.-Atmos., 124, 11070–11085, https://doi.org/10.1029/2019JD030735, 2019. a
Wilhelm, S., Stober, G., and Brown, P.: Climatologies and long-term changes in mesospheric wind and wave measurements based on radar observations at high and mid latitudes, Ann. Geophys., 37, 851–875, https://doi.org/10.5194/angeo-37-851-2019, 2019. a, b, c, d, e
Wright, C. J., Hindley, N. P., Moss, A. C., and Mitchell, N. J.: Multi-instrument gravity-wave measurements over Tierra del Fuego and the Drake Passage – Part 1: Potential energies and vertical wavelengths from AIRS, COSMIC, HIRDLS, MLS-Aura, SAAMER, SABER and radiosondes, Atmos. Meas. Tech., 9, 877–908, https://doi.org/10.5194/amt-9-877-2016, 2016. a
Wüst, S., Bittner, M., Espy, P. J., French, W. J. R., and Mulligan, F. J.: Hydroxyl airglow observations for investigating atmospheric dynamics: results and challenges, Atmos. Chem. Phys., 23, 1599–1618, https://doi.org/10.5194/acp-23-1599-2023, 2023. a
- Abstract
- Introduction
- Observations
- Results: Long-term trends and solar cycle variability of mean winds
- Solar cycle in gravity wave proxies
- Conclusions
- Appendix A: Additional figures
- Appendix B: Gravity wave estimates from SABER observations
- Data availability
- Author contributions
- Competing interests
- Disclaimer
- Special issue statement
- Financial support
- Review statement
- References