 | 31 Jul 2019
Analysis of the coupling of electromagnetic pulses into shielded enclosures of vulnerable systems
Sebastian Koj
Heyno Garbe
In order to predict the immunity to electromagnetic interference of vulnerable systems, not only the electronic system but also its enclosure has to be taken into consideration. In this work, the coupling behavior of electromagnetic pulses (EMP) and continuous wave (CW) signals into the shielded enclosure of a generic system is investigated by metrological and numerical methods. Since this enclosure forms an unwanted or parasitic cavity resonator, the enclosure`s resonance behavior as well as the characteristic quantities, i.e., the resonance frequencies and corresponding quality factors are of great interest, too. The usage of an optical field sensor reduces the influence of the measuring setup on the investigated system and thus, enables the analysis of the enclosure's resonance behavior, which delivers revealing information about the dependence of the quality factor on the aperture size of the enclosure.
- Article
(1926 KB) - Full-text XML
- BibTeX
- EndNote


Modern electronic systems should be highly reliable against various types of electromagnetic interferences in order to avoid malfunctions, which could lead to unexpected consequences if the functionality of such a system is critical to security. Thus, the knowledge of the system's immunity is of great interest. Due to the complexity of a modern electronic system with many individual components and interconnections, it is almost impossible to provide the required information based on a single analytical model. The identification of a system's immunity is further complicated, as the enclosure of the overall system and possibly existing enclosures or housings of individual subsystems and components have to be taken into account, too. Since these enclosures and housings can form unwanted or parasitic cavity resonators, especially if they are surrounded by surfaces with a high electric shielding effectiveness, not only the analysis of the coupling of transient and continuous wave (CW) signals into these enclosures is of interest, but also the investigation of the resonance behavior of these enclosures. As shown in Gronwald et al. (2004, 2007), Gronwald (2006, 2012), Nitsch et al. (2010) and Tkachenko et al. (2011, 2013) the topic of field coupling in antenna structures housed in metallic rectangular enclosures has been analyzed analytically and numerically in the past. A setup for metrological investigation of interference in rectangular enclosure was presented in Vogt et al. (2015), where measurements were carried out in the frequency domain (FD). A consideration of the coupled fields in the time domain was performed i.e. in Kotzev et al. (2016).
In this contribution, the coupling of electromagnetic pulses (EMP) into shielded enclosures of vulnerable systems is examined by means of a generic system, which consists of a microcontroller board within a metallic enclosure possessing the shape of a long cylinder. To this end, the theoretical background of cavity resonators regarding their excitation and their characteristic quantities, i.e., the resonance frequency fres and the corresponding quality factor Q are described firstly, as well as the EUT and the principle measurement setup. Then, time domain (TD) measurements are carried out with different types of EMP, i.e., high altitude nuclear electromagnetic pulses (NEMP) and ultra wideband (UWB) pulses. Since these pulses show a completely different coupling behavior, further measurements are carried out in the frequency domain (FD) with CW signals. The measurement results are verified with numerical field calculations and analytical considerations. Particular attention is paid to the typical physical quantities of this parasitic cavity resonator, i.e., fres and Q. Since a previous investigation Herlemann et al. (2008) pointed out that the aperture size affects the shielding effectiveness of a cubical metallic enclosure and the immunity of a microcontroller board located inside this enclosure, the influence of the aperture size on the resonance effects is investigated as well.
The basic principles of the excitation of a cavity resonator as well as its characteristic quantities are introduced in this chapter, since the enclosure of the investigated generic system is made of metallic material with a high electric shielding effectiveness and forms an unwanted or parasitic cavity resonator.
2.1 Excitation of cavity resonators
Electromagnetic fields can couple into the interior of a cavity in three different ways and excite a certain field distribution. Hill et al. (1994) classifies the coupling mechanism by three types of penetration, which are aperture penetration, antenna penetration and diffusive penetration. The first type of penetration is caused by apertures in the cavity walls. Antenna penetration, also known as wire penetration, comes about wires penetrating the cavity walls without being connected to them. The diffusive penetration is effected by the finite shielding effectiveness (SE) of the cavity walls. In case of proper surfaces in the sense of the EMT (Baum, 1981, 1985), this coupling path either attenuates the incident field strongly or can be completely neglected (good shielding approximation). As a general rule of thumb the SE is sufficiently high, when the thickness d of cavity walls is larger than the skin depth δ, which is given by Jackson (2002) for a certain frequency f by
where κ and μ are the electrical conductivity and the magnetic permeability of the wall material, respectively. Typically, this assumption is satisfied in the higher frequency range for metallic walls, since the skin depth decreases with increasing frequencies and becomes smaller than the wall thickness, thus most of the incoming electromagnetic energy is shielded by reflection and attenuation losses due to the cavity walls. However, the SE can also be quite low in the lower frequency range and enables diffusive penetration. It should be mentioned that magnetic fields below 100 kHz can be shielded only by highly permeable wall materials.
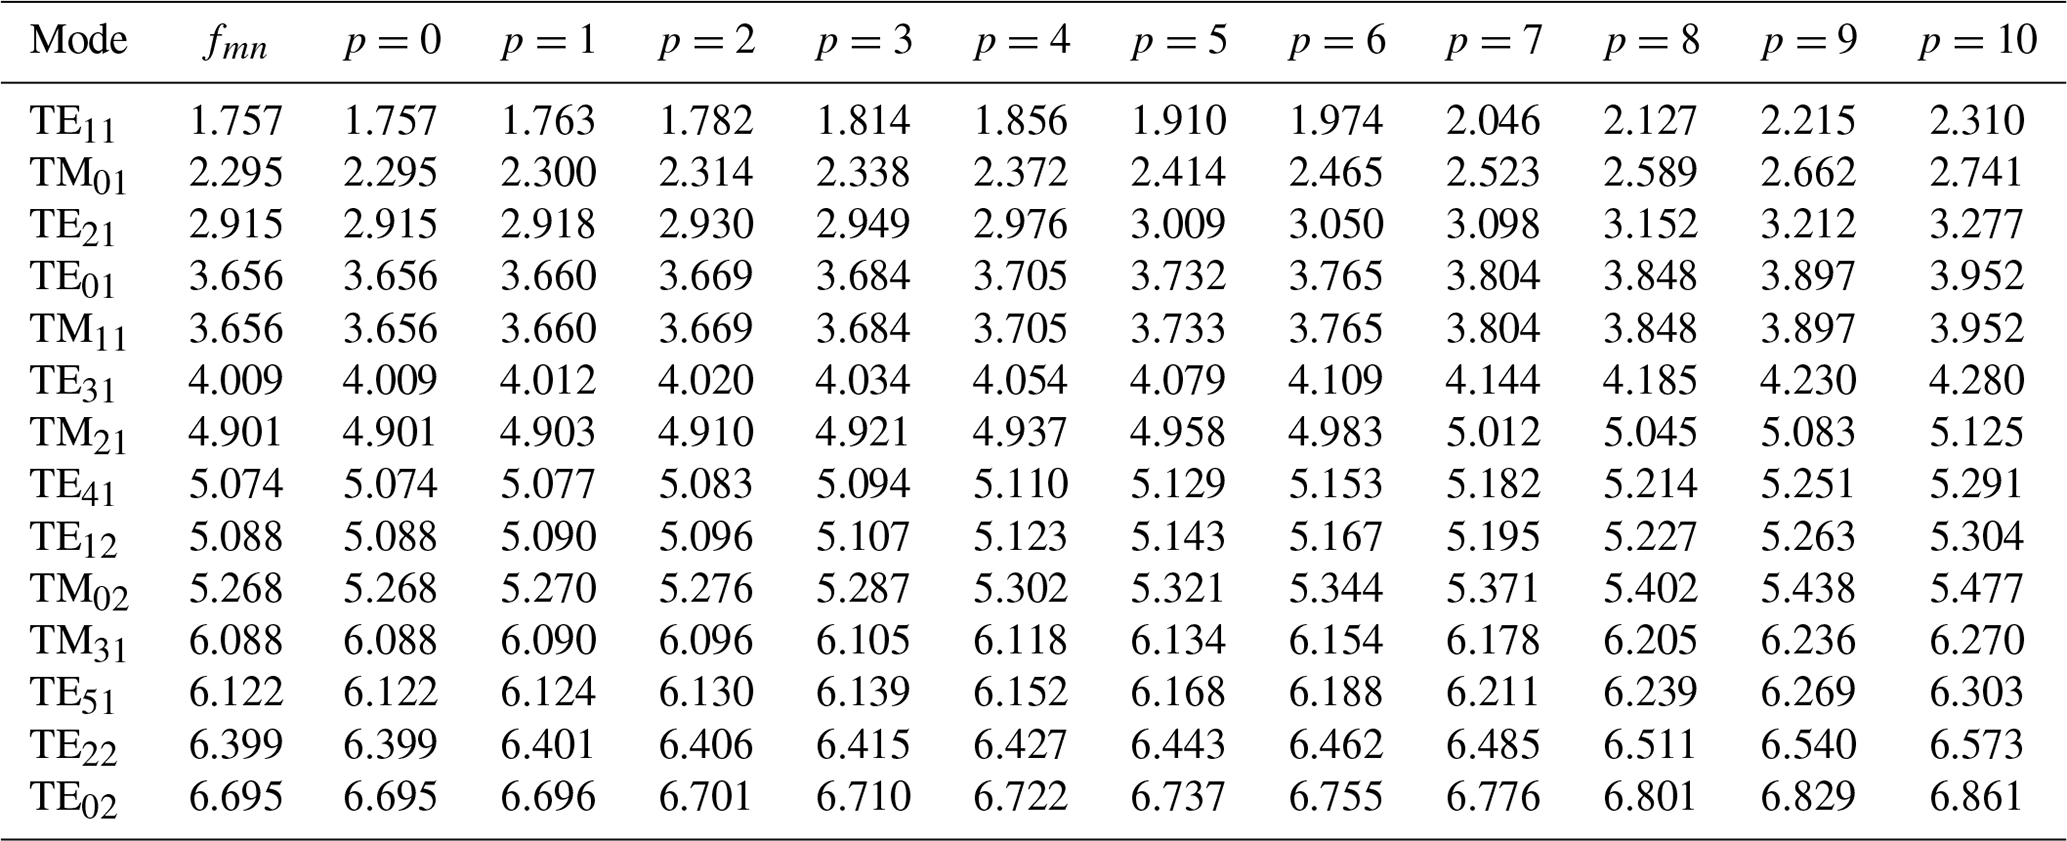
Table 1Calculated resonance frequencies of a hollow cylinder tube with D=100 mm and l=1000 mm, fmnp in GHz.
2.2 Characteristic quantities of cavity resonators
2.2.1 Resonance frequency
A cavity resonator is primarily characterized by its resonance frequency fres. As mentioned in the introduction and described later in Sect. 3.1, the enclosure of the investigated system has the shape of a long hollow cylinder. Regarding such a hollow cylinder as a waveguide that is short-circuited with metallic caps on both ends, the resonance frequencies are given by
where l is the hight or rather length of the cavity, p is a non-negative integer number and fc,mn is the cut-off frequency of a certain mode propagating in a cylindrical waveguide. These cut-off frequencies are given by
in case of the transverse electric modes (TEmn-Mode, Hmn-Mode) and by
in case of the transverse magnetic modes (TMmn-Mode, Emn-Mode). In these equations, D is the interior diameter of the waveguide and m and n are non-negative integers. Further, xmn and are the nth roots of the Bessel function Jmn(x) and its derivative . Furthermore, εr and μr are the relative permittivity and permeability of the material inside the waveguide, respectively and c0 is the speed of light in the vacuum. It is obvious, that the resonance frequencies equal the corresponding cut-off frequencies in those cases with p=0. In general, the cut-off frequencies determine the lower limit for all resonance frequencies that may occur independently of the quotient p∕l. The resonance frequencies of transverse electric and magnetic modes are given by
Table 1 contains the calculated resonance frequencies of a hollow cylinder tube with the physical dimensions D=100 mm and l=1 m. This cavity resonator is described in more detail in Sect. 3.1 and serves as the EUT for the analysis of the coupling into proper volumes in the sense of the EMT, which must be completely surrounded by proper volumes (Baum, 1981, 1985). The first and the second column of Table 1 labelled by Mode and fmn list the TEmn-Modes and TMmn-Modes, respectively, as well as their corresponding cut-off-frequencies, which underlie the resonances frequencies according to Eqs. (2), (5) and (6). The following columns contain the calculated frequencies for p=0 … 10. Consequently, to give an example, GHz is listed as an example in the seventh column (labelled by p=4) of row beginning with TE21.
2.2.2 Quality factor
The second characteristic electric quantity of a resonator is the quality factor Q, which is defined by Jackson (2002) by the following Eq. (7) and includes the averaged steady-state energy W stored in the cavity and the dissipation losses P:
In general, it is more reasonable to measure the resonance frequency and the corresponding 3 dB-bandwidth B3 dB in order to determine the quality factor. The quality factor is a combination of different individual contributions (e.g. Hill et al., 1994). It comprises four contributions:
In Eq. (8), Q1 represents the losses of the cavity wall and Q2 the losses effected by the loading of the cavity (e.g. lossy dielectrics and other materials). The contribution Q3 considers the losses because of aperture radiation from the cavity to the surroundings. Additional losses caused by field probes or antennas are represented by Q4. The total quality factor is dominated by the smallest individual quality factor Qi, where i={1, …, 4}.
The coupling behavior of transient and CW signals into shielded enclosures of vulnerable systems is examined by means of a generic system described in this section. It consists of a metallic enclosure possessing the shape of a long cylinder, which is equipped with a microcontroller board and two wires serving as a model for cabling. The generic system is also illustrated by a topological description, i.e., by its electromagnetic topology (EMT) model. Since the coupling to the shielded enclosure is the main focus of this contribution, the description of the microcontroller board as well as the essential findings concerning its susceptibility are presented for information purposes mainly.
3.1 Description of the generic system
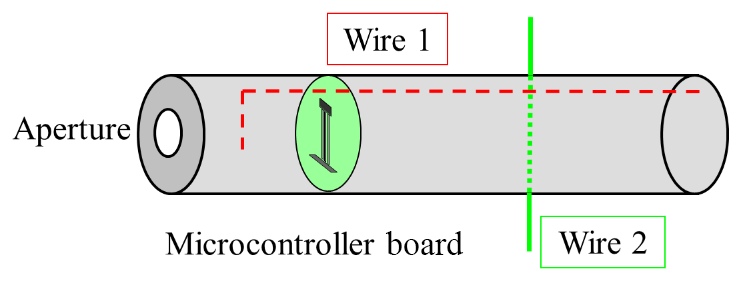
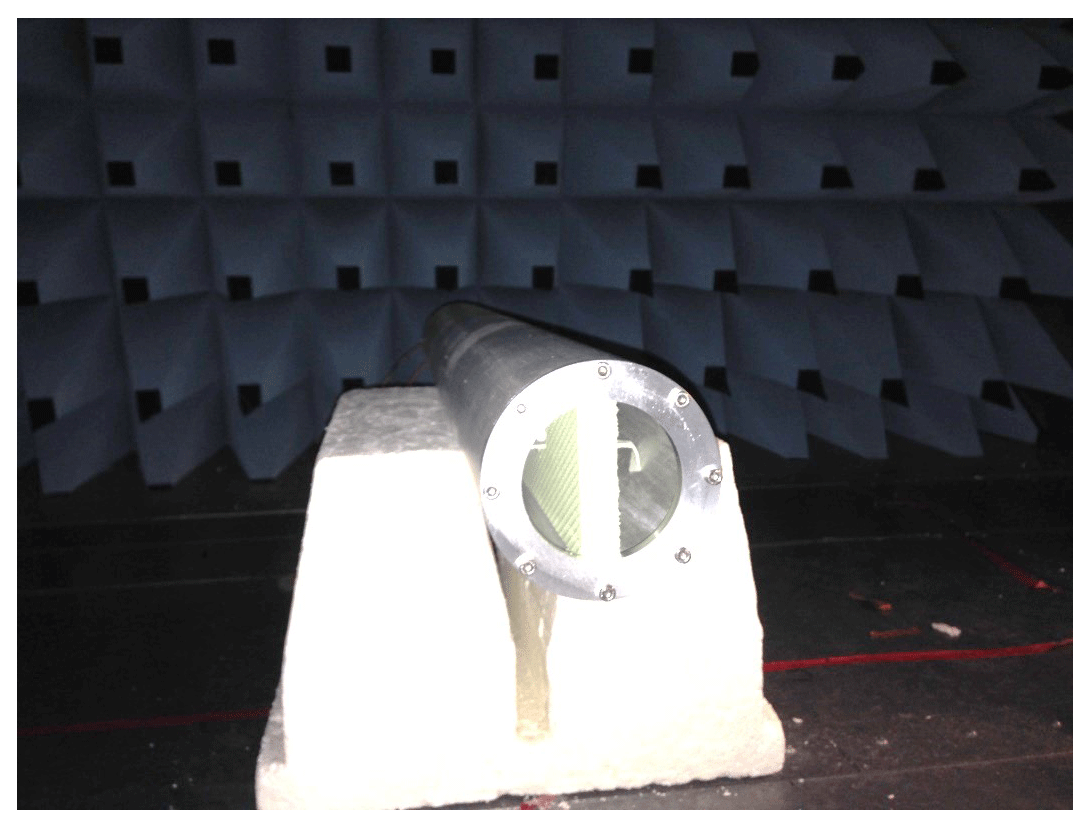
The generic system serving as a model of a vulnerable system consists of a generic microcontroller board (GMB) that is placed inside a metallic enclosure as shown in Fig. 1. The enclosure, i.e., the equipment under test (EUT) is made of aluminum and has got the following geometrical dimensions: length l=1 m, interior diameter Di=100 mm and wall thickness dw=10 mm. Due to these dimensions, the EUT has the shape of a long cylinder or a tube. In principle, both ends of this tube can be equipped with different apertures and terminations. For the investigations presented in the following, the tube is equipped with an aperture at one side and closed with a metallic end cap on the other. The apertures are realized by a metallic disk with a centric hole. In order to change the aperture size in a range from DA=10 … 100 mm with an incremental step of 10 mm, different apertures can be mounted to the tube. Since the discs with the apertures as well as the end cap are manufactured of aluminum with a thickness dd=10 mm, the walls of this enclosure have a high level of shielding effectiveness, such that this enclosure meets the criteria of a proper volume in the sense of EMT (Baum, 1981, 1985).
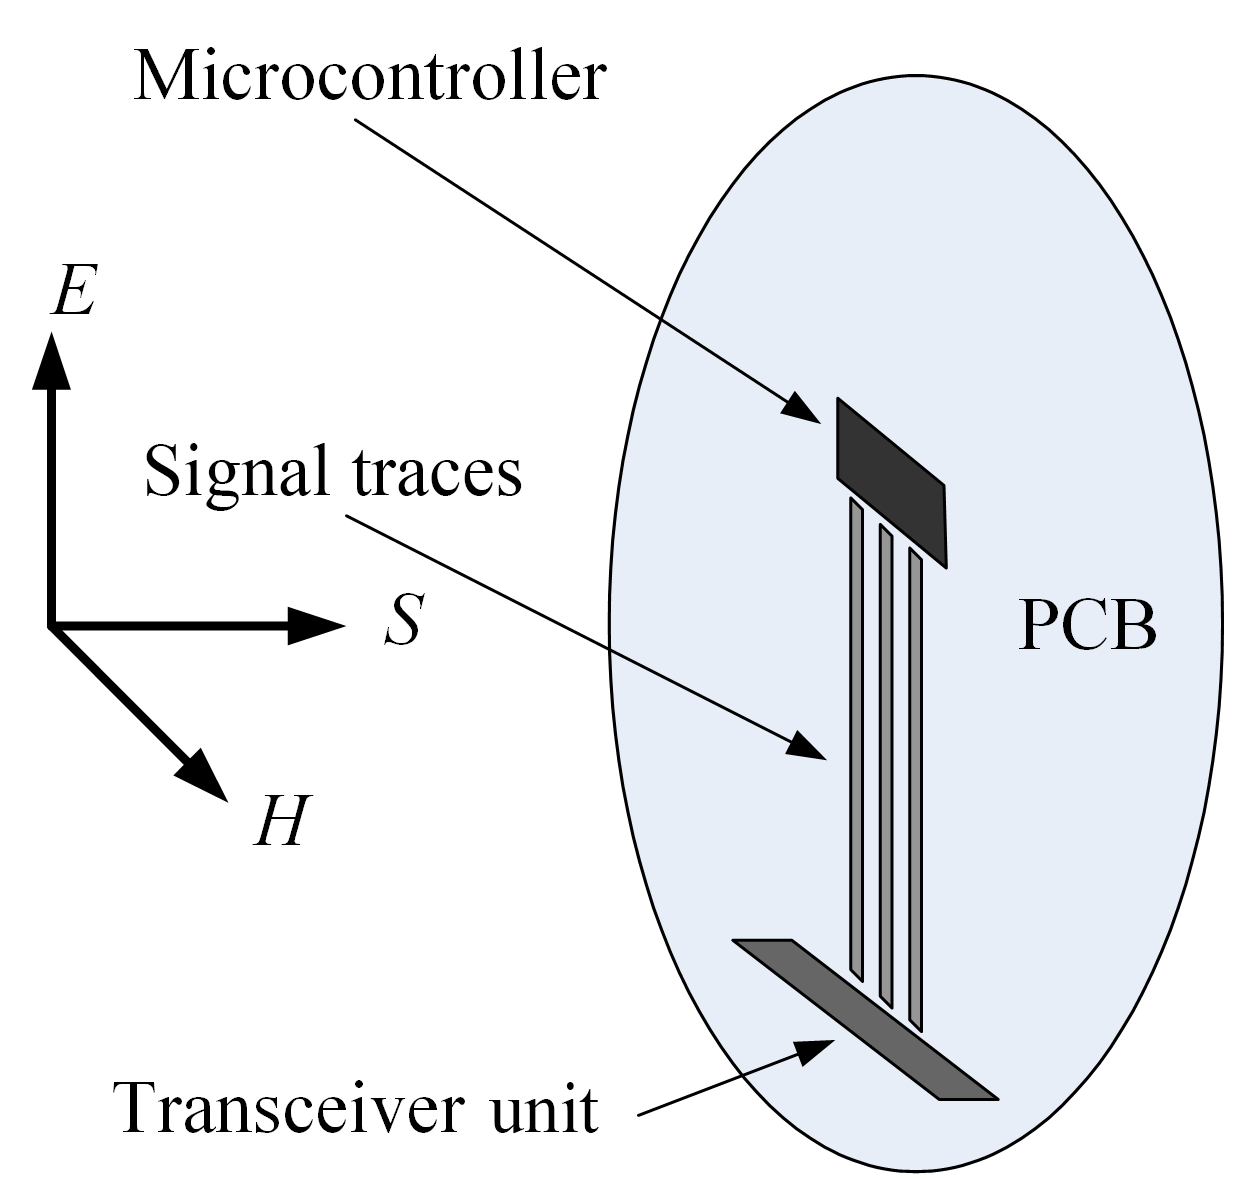
As electronic part of the vulnerable system serves a GMB that has been developed for the investigation of the coupling behavior of transient signals into signal traces (Fisahn and Garbe, 2009a, b). Typically, it is placed inside the aluminum enclosure in a distance of sGMB=250 mm from the aperture as shown in Fig. 1. Essentially, the GMB is a the battery powered printed circuit board (PCB) which contains the three functional groups microcontroller, transceiver unit for control purposes via a fiber optic link and signal traces, which represent the structure signals may couple into. A special test program is running on the microcontroller and provides the determination of the breakdown failure rate (BFR) of the GMB. The principle buildup of the GMB is illustrated in Fig. 2. Since the coupling into the shielded enclosure as well as the resonance behavior are analyzed in this contribution and not the immunity of the overall system, the GMB is replaced by an optical field probe during the measurements described in Sects. 4 and 5. Beside the aluminum enclosure and the GMB, the EUT consists of two wires, which serve as a model for cabling. Wire 1 is placed in longitudinal direction inside the tube and connected via a 50 Ω resistor to the metallic end cap, whereas wire 2 penetrates the enclosure in vertical direction as shown in Fig. 1. Wire 2 is not electrically connected with the enclosure.
3.2 EMT model of the generic system
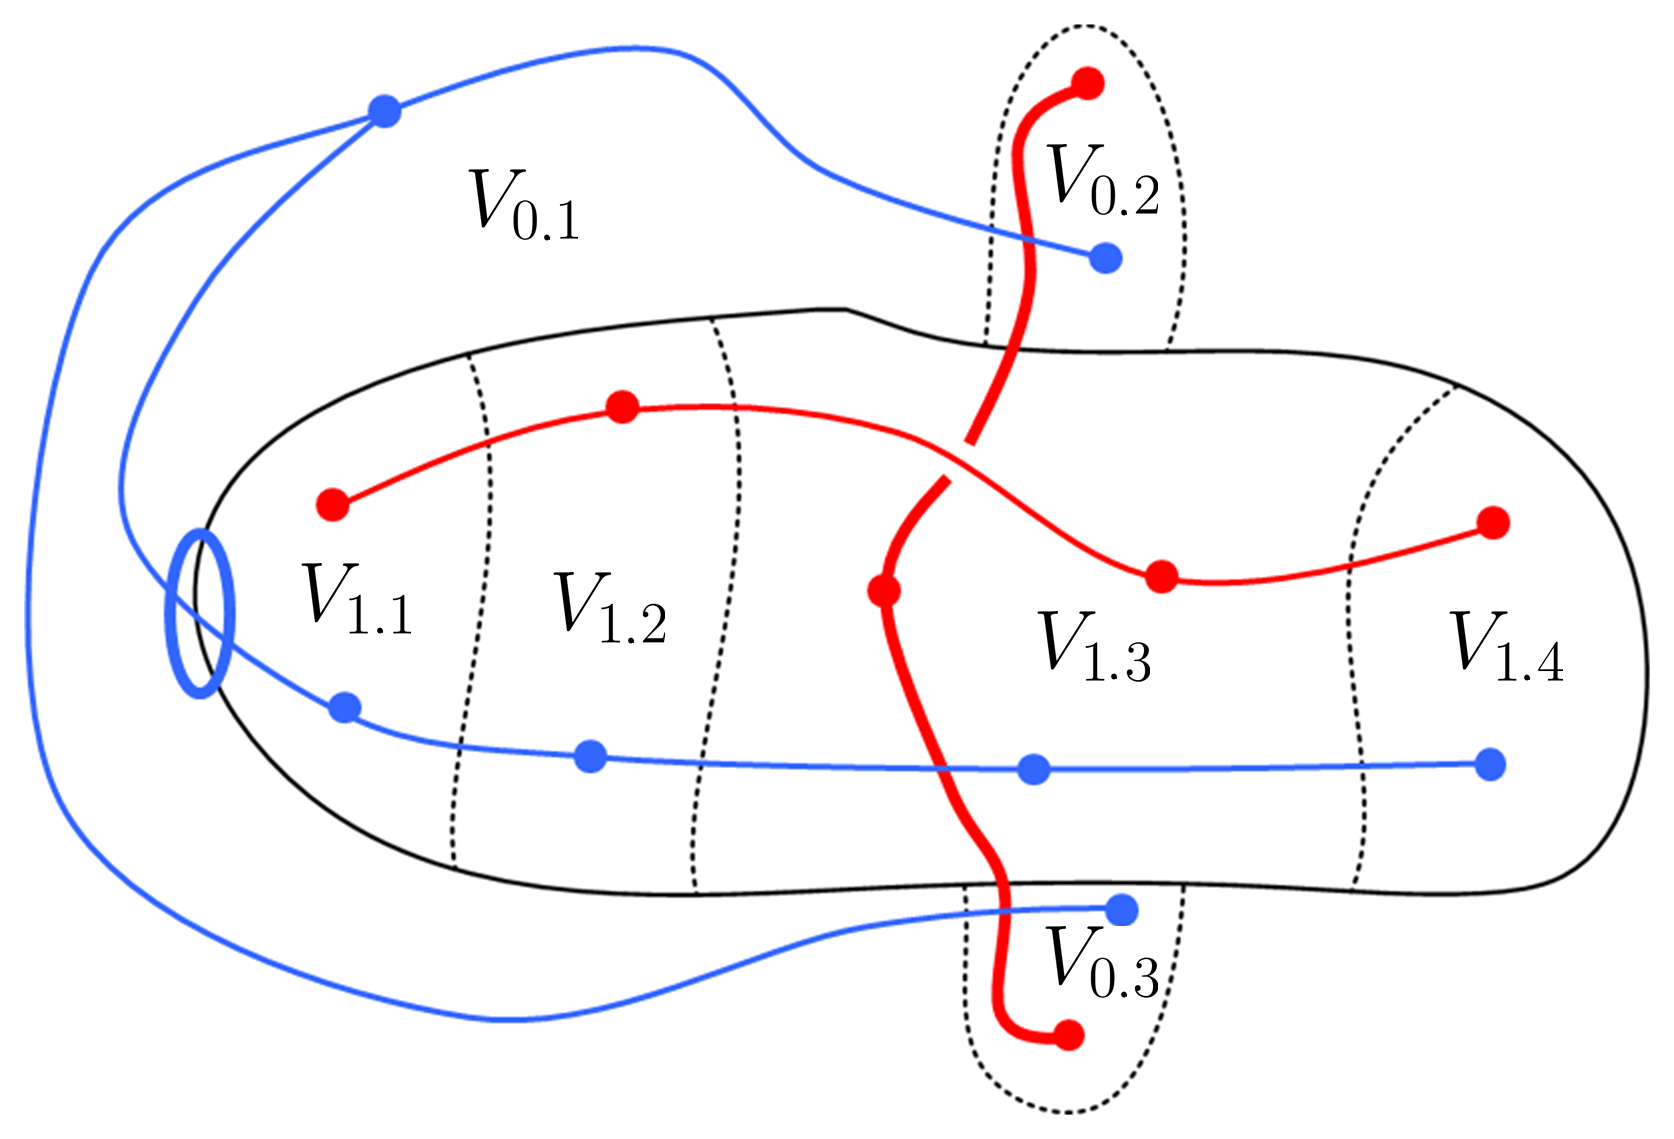
In order to illustrate the coupling paths into the generic system described in Sect. 3.1, the corresponding EMT model of this system is set up in this section. The principles of the EMT are described in Baum (1981, 1985). As usual in EMT models, the wire penetration is modeled by the conducted interaction graph, whereas both aperture penetration as well as diffusive penetration are modeled by the radiated interaction graph. Figure 3 shows a possible topological model of the generic system using the volume's designations described in Fisahn et al. (2017), i.e., proper surfaces with a high level of shielding effectiveness (SE) are illustrated by solid lines, whereas elementary surfaces without or just a low level of SE are illustrated by dashed lines. Furthermore, conducted and radiated interactions are illustrated by red or blue lines, respectively.
Inserting the characteristic material parameter of aluminum in Eq. (1) leads approximately to the skin depth δAl=82 mm/, which becomes smaller than 0.82 mm for frequencies above 10 kHz and smaller than 0.082 mm for frequencies above 1 MHz. Since the aluminum enclosure is a thick-walled tube (dw=10 mm), it has a high level of SE and meets the criteria of a proper volume that must be completely surrounded by proper volumes. The shielding order of the aluminum enclosure with an aperture is at least one level higher than that of the surroundings of this volume, which has the shielding order 0, thus the interior of the enclosure has the shielding order 1. The boundaries between these volumes are proper surfaces and illustrated by a solid line in Fig. 3. Due to functional reasons it seems to be reasonable to subdivide these two regions into a few elementary volumes: thus, V0,1 is defined as the whole surroundings except the two small regions where wire 2 is located, which are designated V0,2 and V0,3. The elementary surfaces, which bound these three subvolumes, are illustrated by dashed lines. The interior of the metallic enclosure is additionally divided into subvolumes due to functional reasons, too. The region next to the aperture is defined as subvolume V1,1, because the field distribution next to an aperture differs typically considerably from the one in a certain distance of this aperture. The GMB or rather the field probe is placed in V1,2, whereas V1,3 is the elementary volume, that is penetrated by wire 2. The enclosure, i.e., the tube is terminated in V1,4 with an end cap, where reflections may occur.
The interaction graph describes the possible conducted and radiated interactions. In Fig. 3, the red lines illustrate the conducted interactions due to the two wires. Wire 1 is placed completely inside the proper volume from subvolume V1,1 to V1,4 and interconnects them, whereas wire 2 passes the subvolumes V0,2, V1,3 and V0,3 and penetrates the proper surface. The radiated emissions are illustrated by blue lines interconnecting all subvolumes, which have the same shielding order. Since the enclosure is nearly completely surrounded by proper surfaces, it forms a proper volume. The radiated interactions can only overcome this barrier by coupling through the aperture. This aperture penetration between V0,1 and V1,1 is illustrated by the blue ellipse.
It has to be pointed out, that the electromagnetic climate in subvolume V1,2 is of significant importance with respect to the immunity of the complete system, because the GMB, i.e., the electronic part of the system is located here. Disturbing signals from the surrounding V0,1 can reach V1,2 on two different paths. The first one is the direct path via V1,1, whereas the disturbing signal penetrates the enclosure or rather the proper surface by aperture penetration. The second path proceeds via the subvolumes V0,2 and V0,3, where the signal couples to wire 2, then, it is guided to V1,3 by wire 2. From here, the signal can reach V1,2 by coupling to wire 1 or by radiation.
3.3 Coupling effects of different signals to the GMB
Since the coupling effects and the susceptibility of the GMB in a non shielded environment are not the main focus of this contribution, the essential findings obtained in former investigation are summarized in this section for information purposes mainly. Nevertheless, they are useful in order to enable an estimation and prediction of the susceptibility of the overall system. As already published in Fisahn and Garbe (2009a, b, 2010), the applied electromagnetic pulses with double exponential unipolar shape, i.e., NEMP and UWB pulses show a completely different coupling behavior into the signal traces of the GMB. In case of the NEMP with a rise time and a pulse duration at half maximum of approx. tr=1.5 ns and tfwhm=80 ns, the coupling increases with an increasing length of the signal traces, whereas the coupling behavior of UWB pulses with tfwhm=80 ns and tr=100 ps is opposite. The obvious reason for this is the spectral content of both pulses compared to the geometrical dimensions of the GMB. The signal traces of the GMB show a derivative action (gain of 20 dB per decade) in the sense of system theory in the frequency range below a certain cut-off-frequency and resonance behavior in the range above. Considering signal trace lengths of lt=40 … 80 mm the lowest cut-off frequency is approx. 750 MHz and increases with a decreasing length of the signal traces. Since the NEMP covers only a frequency range up to approx. 300 MHz (Giri and Tesche, 2004), it couples into the GMB in the frequency range where the signal traces show a derivative action. In this range, the coupling efficiency increases with the length of the GMB traces. In contrast to this, an UWB pulse covers a larger frequency range up to several GHz, where the GMB shows resonant behavior and the coupling behavior is not linearly dependent on the GMB trace length any longer. Susceptibility investigations carried out in a GTEM cell show, that both, the NEMP pulse with an electric field strength amplitude of approx. kV m−1 and the UWB pulse with kV m−1 can cause perturbations and breakdowns of the GMB, or more precisely, the microcontroller. However, the NEMP can also effect physical damages (destructions) of the microcontroller for kV m−1.
The EMT model, which was set up in Sect. 3.2, illustrates, that there are two principle coupling paths from the surroundings V0,1 to the most critical subvolume V1,2, where the electronic part of the system, i.e., the GMB is typically placed. Previous investigations by Fisahn and Garbe (2007a, b) and Fisahn et al. (2007) in the frequency domain (FD) already pointed out, that the contribution of the coupling path, which includes the conducted interaction graph of wire 2, is several times smaller than the direct coupling path via subvolume V1,1. Thus, wire 2 and the corresponding conducted interaction graph are not of interest in further considerations, which simplifies the analysis of the coupling into shielded enclosures. As a consequence of Eq. (8), the loading of the cavity due to lossy dielectrics and other materials decreases the partial quality factor Q2 as well as the total quality factor Q, since Q is dominated by the smallest individual quality factor Qi. To avoid a decrease of Q, the GMB as well as wire 1 are also removed during the measurements of the resonance effects.
4.1 Measurement setup
The measurements of the coupling behavior of signals into shielded enclosures are carried out in a GTEM cell in the time domain (TD) and in the frequency domain (FD) by means of the EUT described in Sect. 3.1. To this end, the electric field strength is measured inside the metallic enclosure (proper volume) in subvolume V1,2 in a distance of 250 mm from the aperture.
As illustrated in Fig. 4, the generic system's enclosure serving as EUT is placed parallel to the ground plane of the GTEM cell, whereby the aperture of the EUT is orientated toward the feeding port of the GTEM cell. Different devices are used for the signal generation and the acquisition of the electric field strength inside the EUT, because the measurements are carried out in TD and FD as well. In case of the TD measurements the cell port is fed by pulse sources, which provide NEMP and UWB pulses, whereas the internal signal generator of a vector network analyzer (VNA) or tracking generator of an EMI receiver feeds the cell port with CW signals in case of the FD measurements. As a second consequence of Eq. (8), loading of the cavity by inserting a field sensor decreases the partial quality factor Q4 as well as the total quality factor Q. Thus, the electric field strength inside the EUT is measured with a very small active field probe, which is connected to its control via an optical link. The field probe is very well suited for the measurement of electric fields with a maximum amplitude of Emax=50 V m−1 in the frequency range from 250 kHz to 3 GHz, but also enable measurements beyond 3 GHz when accepting a small variation of the antenna factor. The field probe's signal or rather the output signal of its control unit is recorded by a digital sampling oscilloscope (DSO) in case of TD measurements and with the VNA or the EMI receiver in case of FD measurements. Due to the choice of the active field probe and its optical control, it does not change the topological model illustrated in Fig. 3, whereas a typical field probe with an electric cable would form an additional coupling path to the interior of the cavity due to the cable.
4.2 Measurement results
4.2.1 Measurement results in time domain
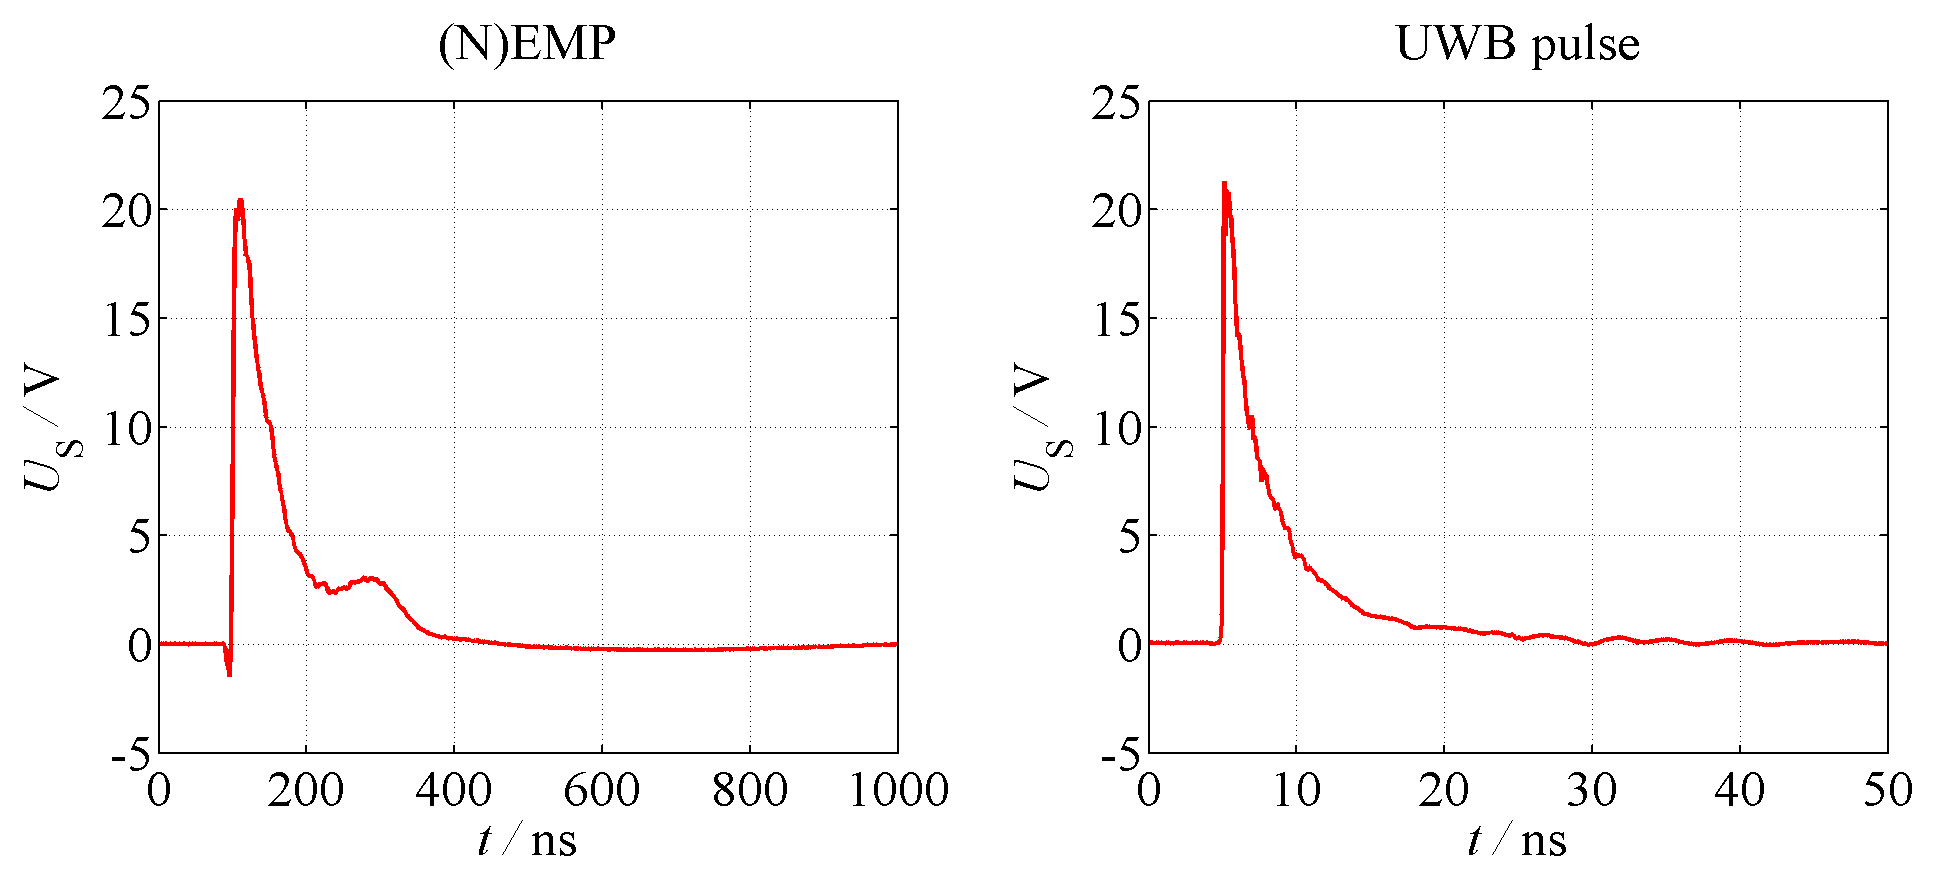
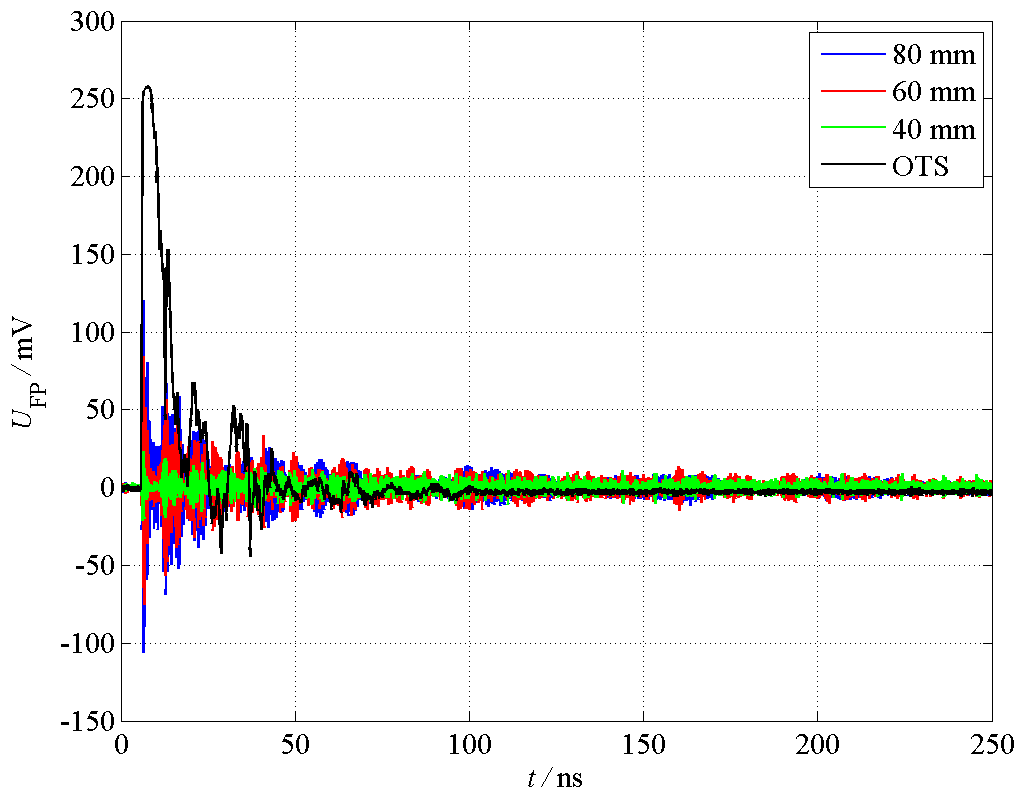
Figure 5 shows the measured time behavior of the electromagnetic pulses used for the measurements in the time domain and which are fed into GTEM cell port. The characteristic time parameters of the NEMP are its rise time of approx. tr=1.5 ns, its pulse duration at half maximum of approx. tfwhm=80 ns and its amplitude of approx. V. The time behavior of the UWB pulse looks similar, whereas its characteristic parameters are approx. tr=100 ps, tfwhm=2.5 ns and V. Both, the NEMP and the UWB pulse have a double exponential unipolar shape in common. It can be assumed, that these pulses fed into the cell port propagate inside the GTEM cell as transverse electromagnetic (TEM) waves with approximately same pulse shape (Thye, 2012). While the septum height is 1 m at the position where the EUT is placed, the pulses described above effect electric field strength amplitudes of aprrox. V m−1. In order to avoid an overloading or even destroying of the optical field probe, the amplitude should not be much higher than 20 V m−1, since the field probe can be only exposed to a maximum field strength of Emax=50 V m−1. Measuring the UWB pulse propagating inside the GTEM cell with the optical field probe mentioned above leads to the time response illustrated in Fig. 6 with a black solid line labeled OTS (open test site). The maximal value of the sensor voltage UFP is 258.5 mV and its total duration is approx. 100 ns. T his measurement result is used as reference for the measurements of the coupling behavior, since the field probe has not been placed in the EUT's shielded proper volume, yet. Therefore, the field probe stays at the same absolute position inside the GTEM cell, but it is surrounded by the metallic enclosure. The measurement results of the coupling of UWB pulses into the EUT equipped with different aperture sizes are also shown Fig. 6. The shape of the sensor voltage is now completely changed, since multiple reflections between the ends of the tube occur. Figure 7 shows a zoomed view of the same measurements in the time range from 5 to 30 ns. While the maximum value of the sensor voltage UFP,max is reduced to 23.0 mV for DA=40 mm, the total duration of the time response increases to more than 500 ns. Furthermore, a first reflection occurs after 5 ns. Further results are shown for an EUT equipped with an aperture size of DA=60 and 80 mm. The maximum sensor voltages increase to 84.6 mV or rather 120.5 mV, while the total duration of the time response decreases below 200 ns. In Fig. 8, the dependency of the measured maximum sensor voltage UFP,max on the aperture DA size is illustrated. It comes out, that the sensor voltage increases with the aperture size. The highest growth occurs for 40 mm ≤ DA≤70 mm. However, the total duration of the sensor signal decreases for increasing aperture sizes. In contrast to the measurements with the UWB pulses, the measured sensor voltage is several times smaller and near to the noise floor of the DSO, when performing the measurements with an EMP. Thus, it seems to be reasonable to carry out additional measurements in FD, since the dynamic range of a VNA or an EMI receiver is many times larger than the one of a DSO.
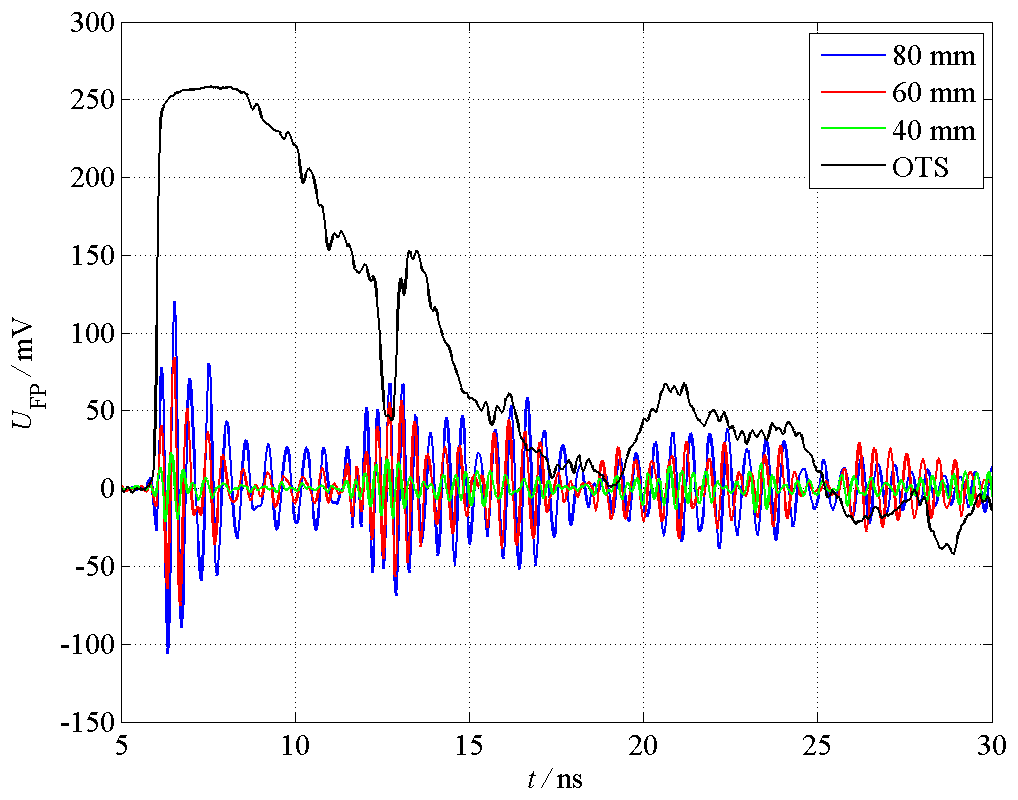
Figure 7Output voltage of the field probe in the time range below 30 ns (measurement with UWP pulses).
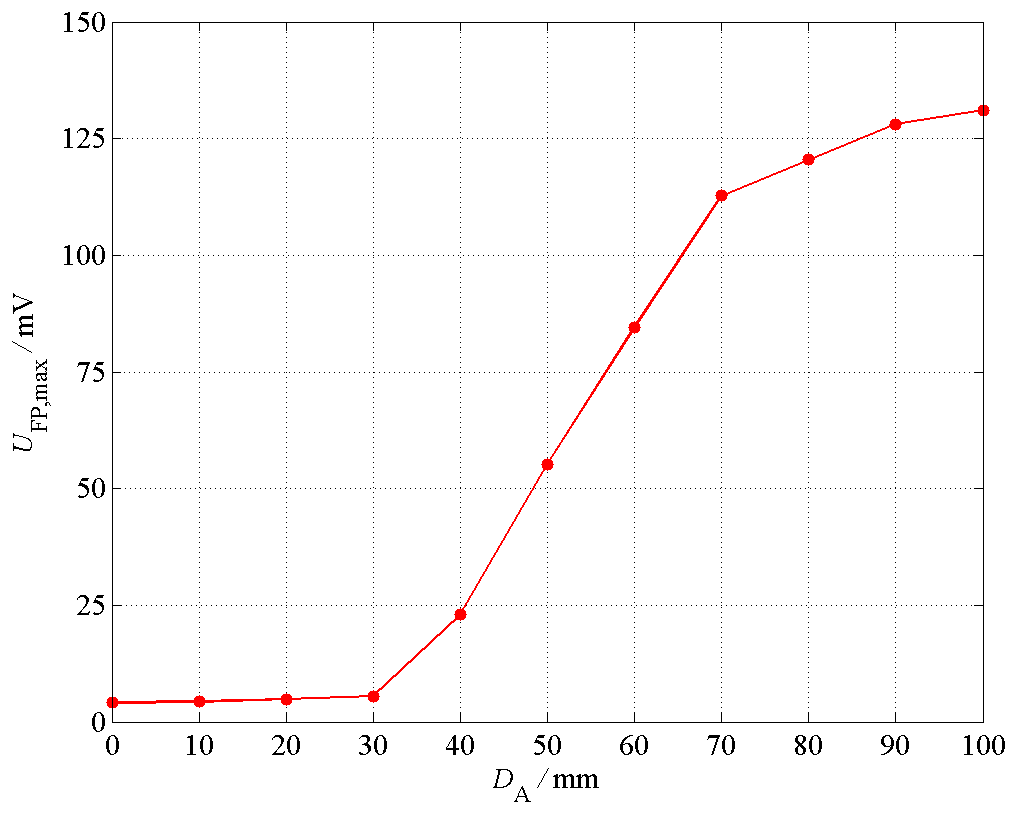
Figure 8Maximum output voltage of field probe placed in the enclosure with the aperture size DA.
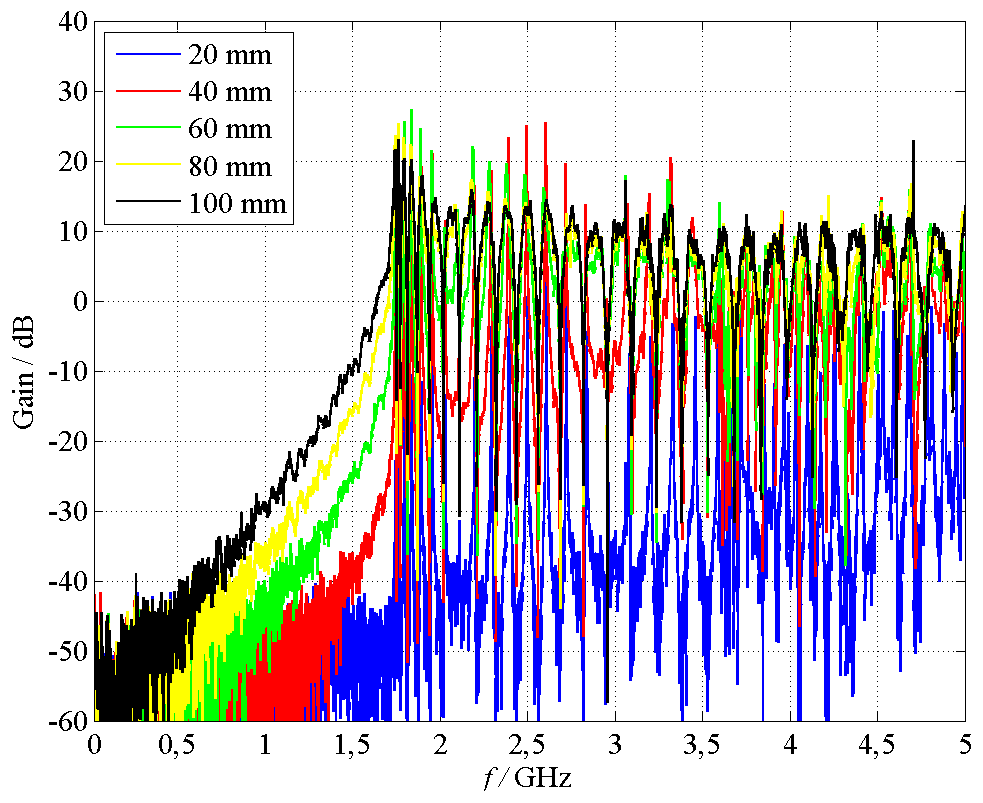
Figure 9Measured transfer function between cell port and field probe output in the frequency range up to 5 GHz.
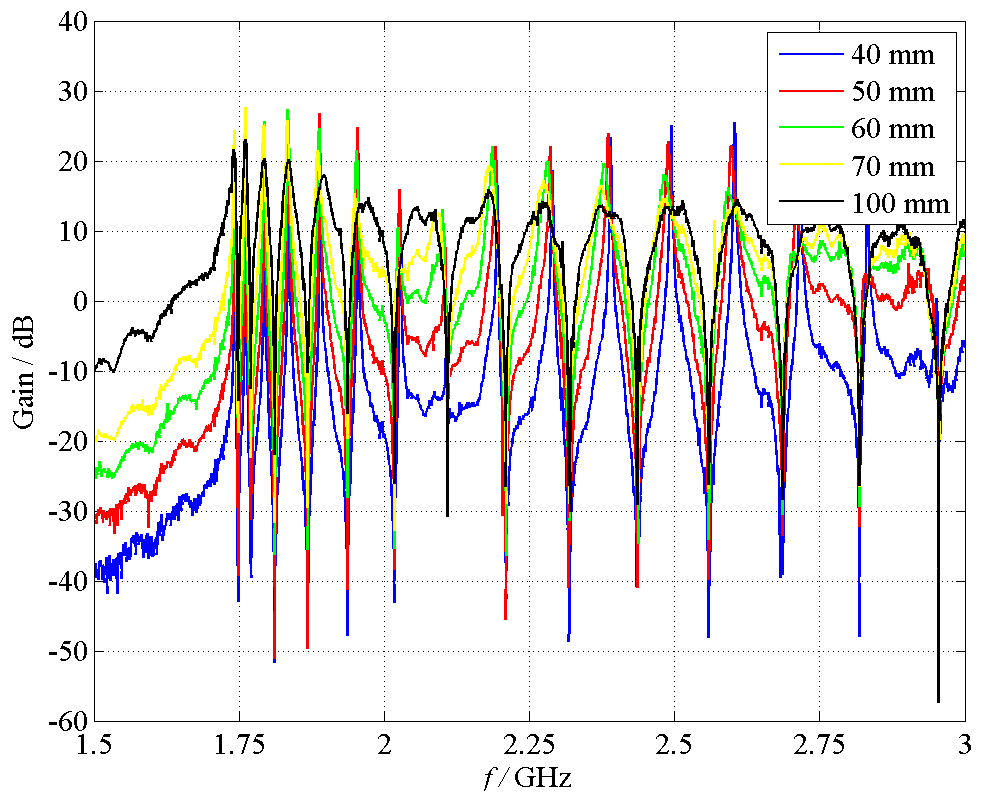
Figure 10Measured transfer function between cell port and field probe output in the frequency range 1.5 to 3 GHz.
4.2.2 Measurement results in frequency domain
FD measurements are carried out with a VNA in the frequency range up to 5 GHz. The upper frequency is determined by the limited frequency range of the field probe. The measured electric field strength EEUT inside the EUT is normalized to the exciting electric field EOTS in logarithmic scale. Figure 9 shows the measured
for different aperture sizes 20 mm ≤ DA≤100 mm. If the field inside the EUT is smaller than the exciting field, the gain will smaller than 0 dB. The measurements point out, that the enclosure behaves like a waveguide, since the measured gain is several times smaller than 0 dB in the frequency range below approx. 1.7 GHz. At this frequency, there is an abrupt rise of all curves. In the frequency range above 1.7 GHz resonances occur at certain frequencies, which are idicated by positive gain values. Furthermore, the gain increases with an increasing DA almost in the whole frequency range, solely at the resonance frequencies, a different behavior can be seen. This effect is investigated in Sect. 5 separately. Figure 10 shows a zoomed view of these measurement results from 1.5 to 3 GHz.
4.3 Verification of measurement results
4.3.1 Numerical field calculations
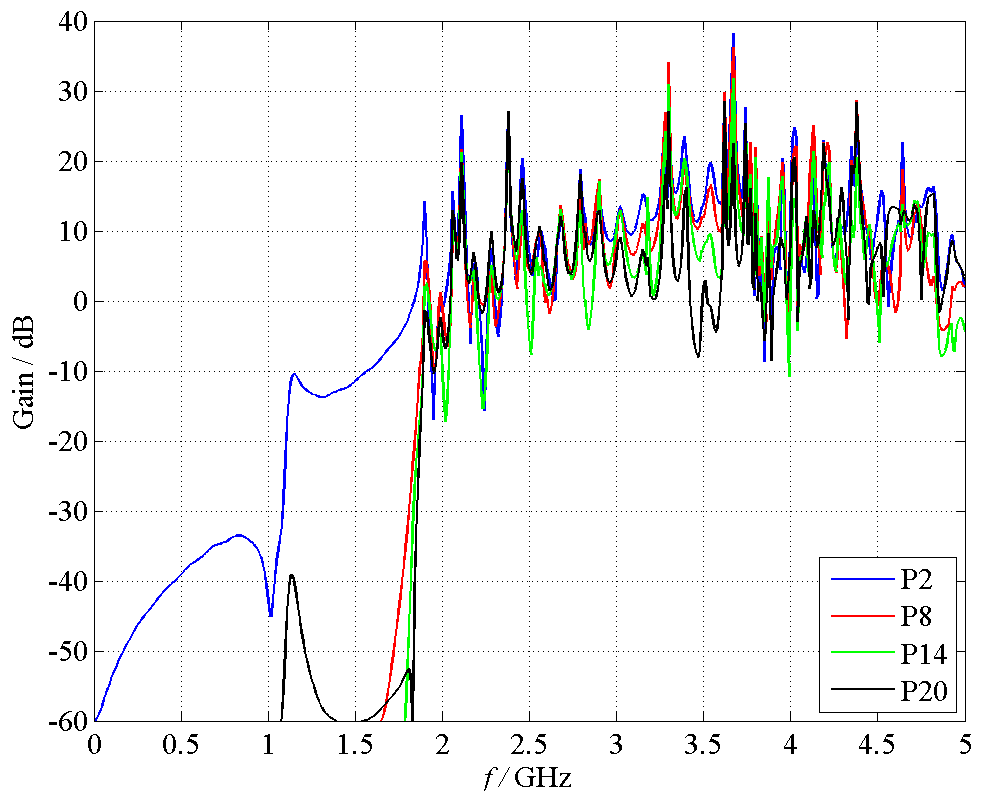
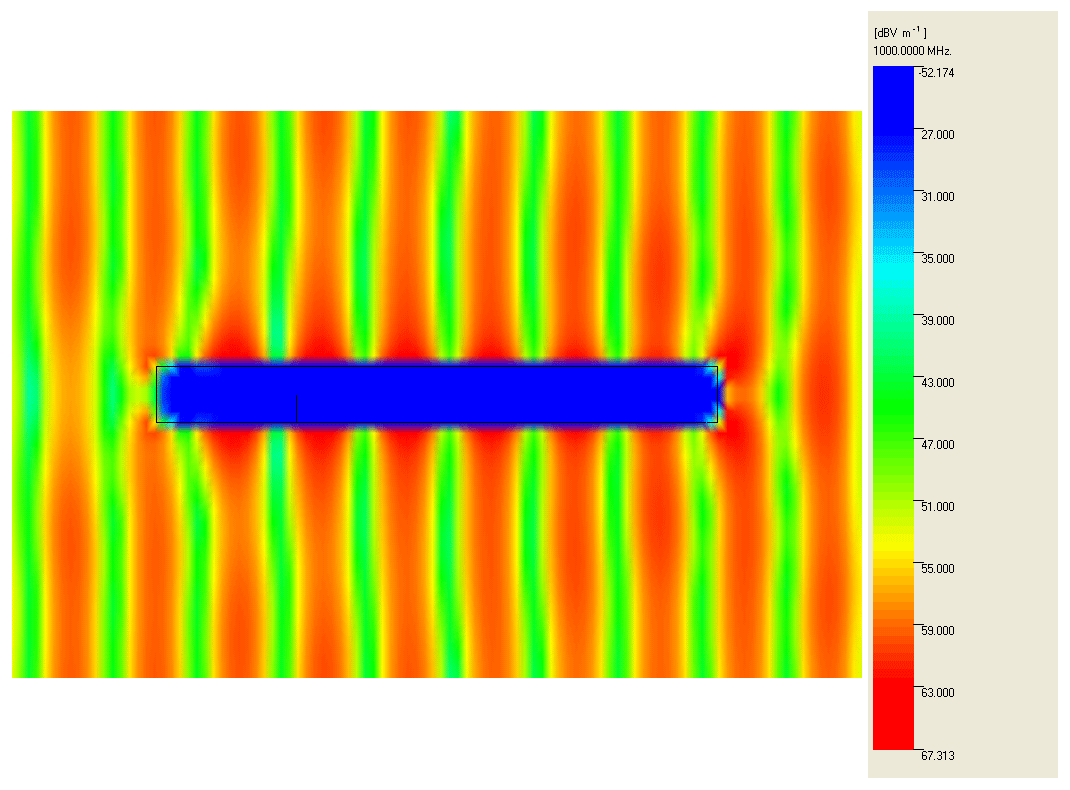
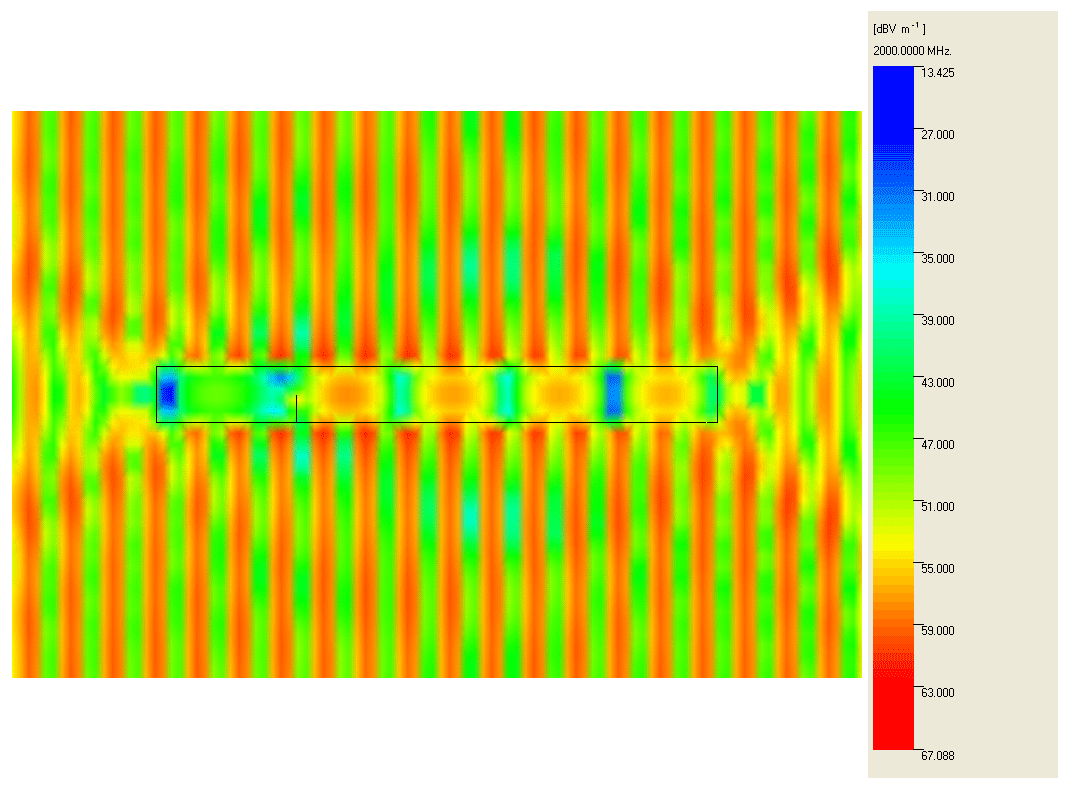
In order to validate the measurement results, the field distribution inside the EUT is simulated with the numerical field calculation program CONCEPT-II. The program is based on the method of moments (MoM) and works in FD. The hollow cylinder is modeled as an enclosure with perfectly electrically conducting (PEC) walls with an aperture at one side and closed with an end cap on the other. The aperture diameter is DA=5 mm. The calculated values are also normalized to the exciting electric field in logarithmic scale in order to keep them comparable to the measurement results. Figure 11 shows the numerical calculated electric field strength or, more precisely the gain in four different observation points. While P2 is an observation point near to the aperture, which is located in subvolume V1,1 of the EMT model described in Sect. 3.2, the point P8 is located in the most critical subvolume V1,2 in a distance of 250 mm to the aperture and complies with the position of the field probe. In observation point P2 (blue line) significant electric field strength values occur for frequencies above 1.05 GHz, whereas the field strength values in point P8 (green line) as well as in the P14 and P20 are negligibly small below 1.75 GHz, but then arise abruptly at approximately 1.75 GHz. In the frequency range above 1.75 GHz resonances occur at certain frequencies. The simulation results agree very well with the FD measurements presented in Sect. 4.2.2. Additionally, surface plots of the field distribution inside and outside the hollow cylinder are calculated for certain frequencies. Figure 12 shows the field distribution for the frequency 1 GHz, where the incident TEM wave propagates from the left side to the right one. While the wave propagation outside the hollow cylinder is nearly unaffected due to its presence, the interior is nearly field-free. In contrast, significant field strength values can be detected for the frequency 2 GHz inside the hollow cylinder as well as field disturbances in front of the aperture (see Fig. 13).
The presence of wire 1 is investigated also by simulation, since this aspect was neglected during the measurements. Therefore, the wiring in longitudinal direction is modeled, as already shown in Fig. 14. The simulations are carried out for 4 different distances dw between the beginning of the wire and the aperture. In comparison to the setup without the wire, the electric field strength values are several times higher in the frequency range below 1.75 GHz (see Fig. 14). The smaller the distances dw, the higher are the electric field strength values.
4.3.2 Analytical considerations
The investigations of the coupling behavior of signals into proper volumes by metrological and numerical methods point out, that the metallic hollow cylinder behaves like a cylindrical waveguide. Below the first cut-off frequency GHz according to Table 1, only evanescent fields are present in the subvolume V1,1 near to the aperture, whereas the most critical subvolume V1,2 as well as the subvolumes V1,3 and V1,4 cannot be reached since wave propagation is not possible below the cut-off frequency of the fundamental mode (TE11-Mode). Above this frequency, the TE11-Mode or higher order modes are able to propagate inside the hollow cylinder, when the corresponding cut-off frequencies are exceeded, e.g. GHz in case of the second possible mode (TM01-Mode). Thus, fields from the surrounding volume V0,1 can couple into the critical subvolume V1,2. While the enclosure wall consist of highly electrically conductive material, the hollow cylinder forms a cavity with high quality factor Q, and only losses due to aperture radiation to the surroundings effect a decrease of Q in the main, which are represented by the contribution Q3 in Eq. (8). The simulated field distribution in Fig. 14 shows on the one hand, that aperture penetration occurs, because of the field distortion in front of the aperture due to the superposition of the incident and the radiated field. On the other hand, standing waves appear inside the hollow cylinder due to multiple reflections between both ends. The measurements in the time domain show the wave propagation inside the hollow cylinder and the multiple reflections as well. The first reflection occurs after 5 ns (see Fig. 7). Since the distance between the field probe and the metallic end cap is dt=0.75 m, the propagating pulse needs ns for the way to the end cap and back.
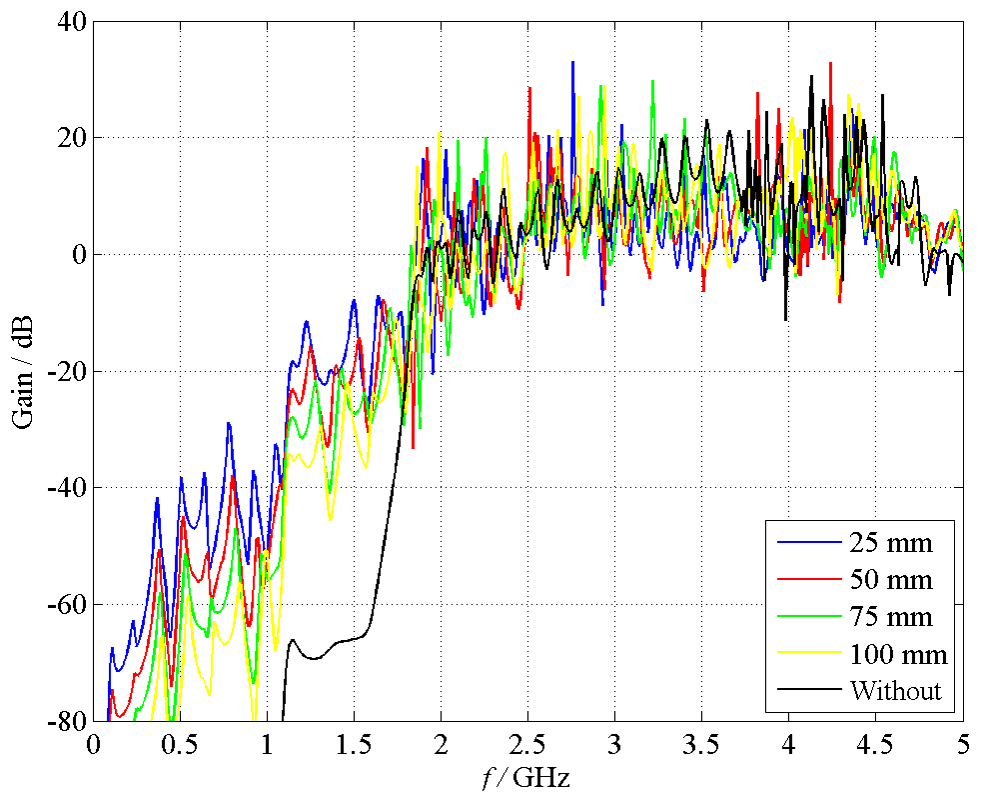
Figure 14Simulated electric field strength at observation point P8, the enclosure is equipped with a wire in longitudinal direction.
The FD measurements described in Sect. 4.2.2 already pointed out, that resonance effects occur at certain frequencies above 1.7 GHz. The resonance effects are investigated in more detail in this section. Therefore, additional FD measurements are carried out with an EMI receiver instead of the VNA, since the EMI receiver is equipped with many helpful marker functions, for instance the measurement of the 3 dB-bandwidth B3 dB.
Figure 15 shows an exemplary measurement performed in the frequency range from 1 up to 3 GHz for an aperture size of DA=40 mm. Here, the power level LFP,EUT at the output of the optical field probe is measured. Taking the power level of a corresponding OTS measurement LFP,OTS into account, which is approx. −53 dBm ± 3 dB in the frequency range from 200 kHz to 4 GHz, delivers the
Six resonance frequencies fmnp can be detected easily below 2 GHz, which is exactly the same number as presented in Table 1, where the frequencies are calculated analytically with Eqs. (5) and (6). In Table 2, these six measured resonance frequencies fmnp,meas are listed as well as the calculated values fmnp,calc, and the difference between measurement and calculation , which is smaller than 1.15 %. Additionally, the corresponding Q-factor is determined according to Eq. (7) by measurement for each resonance frequency, as illustrated in Fig. 16 for the TE111-resonance with the lowest measured resonance frequency. Here, the measured values are GHz and Q=6547.9, whereas the gain with respect to the OTS measurement is 5.6 dB. The highest quality factor is measured for the TE116-resonace, where the characteristic values are GHz and Q=8554.5.
Table 2Measured and calculated resonance frequencies and quality factors.
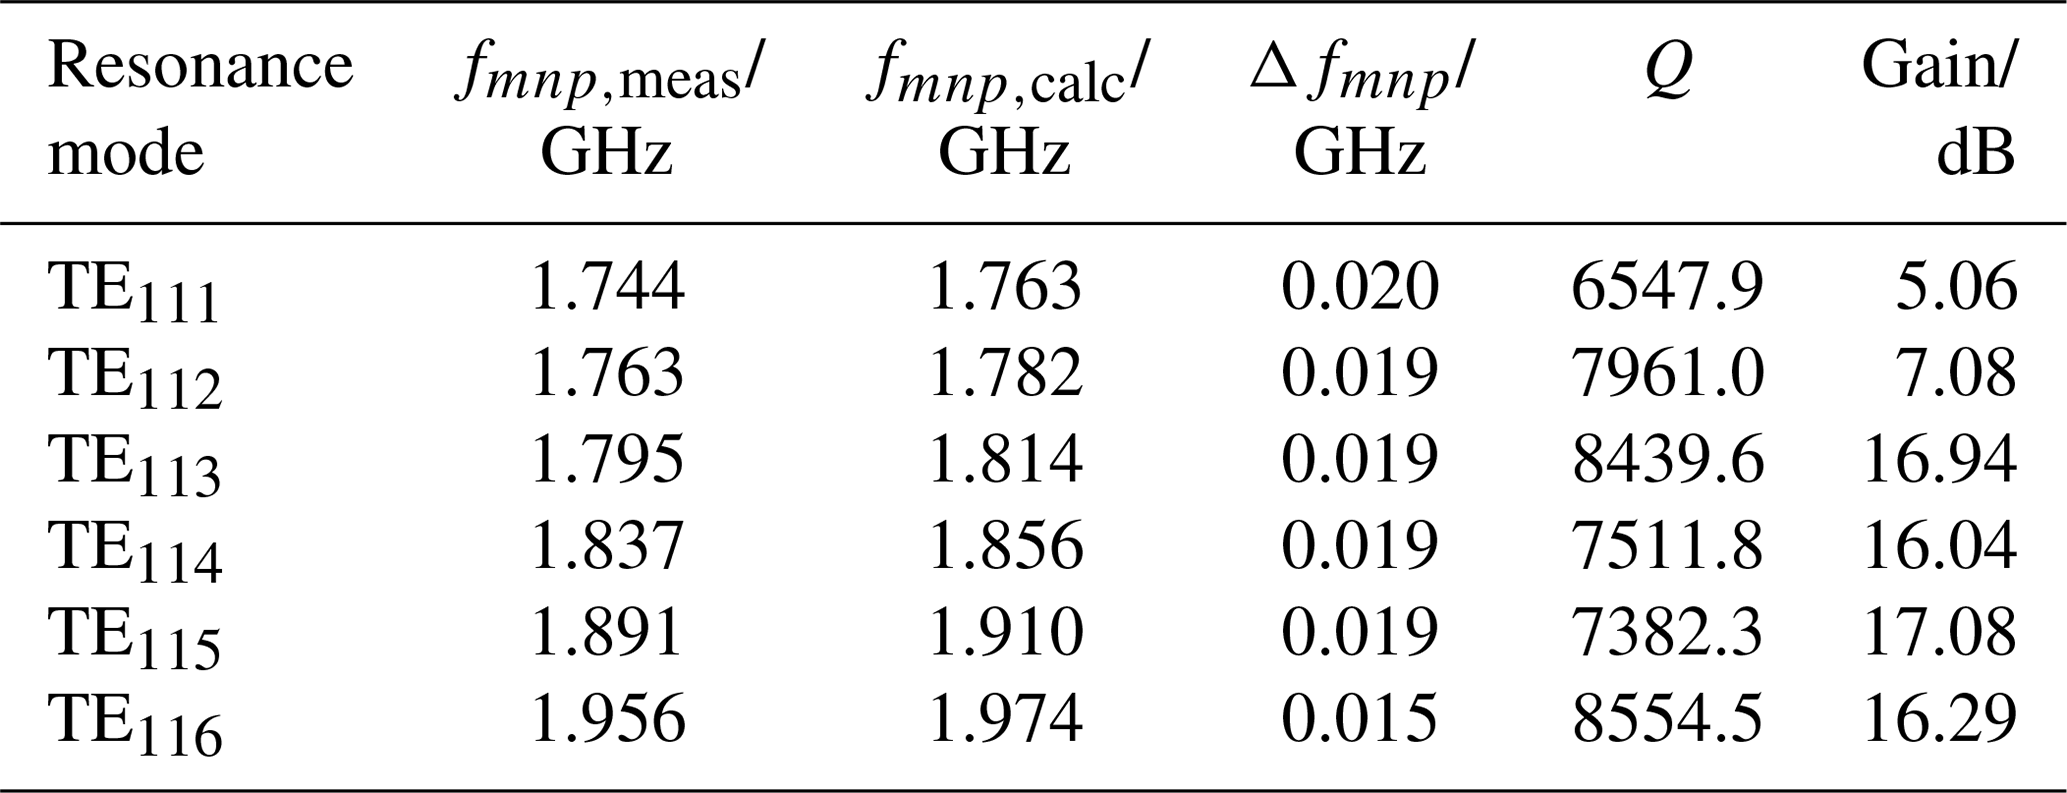
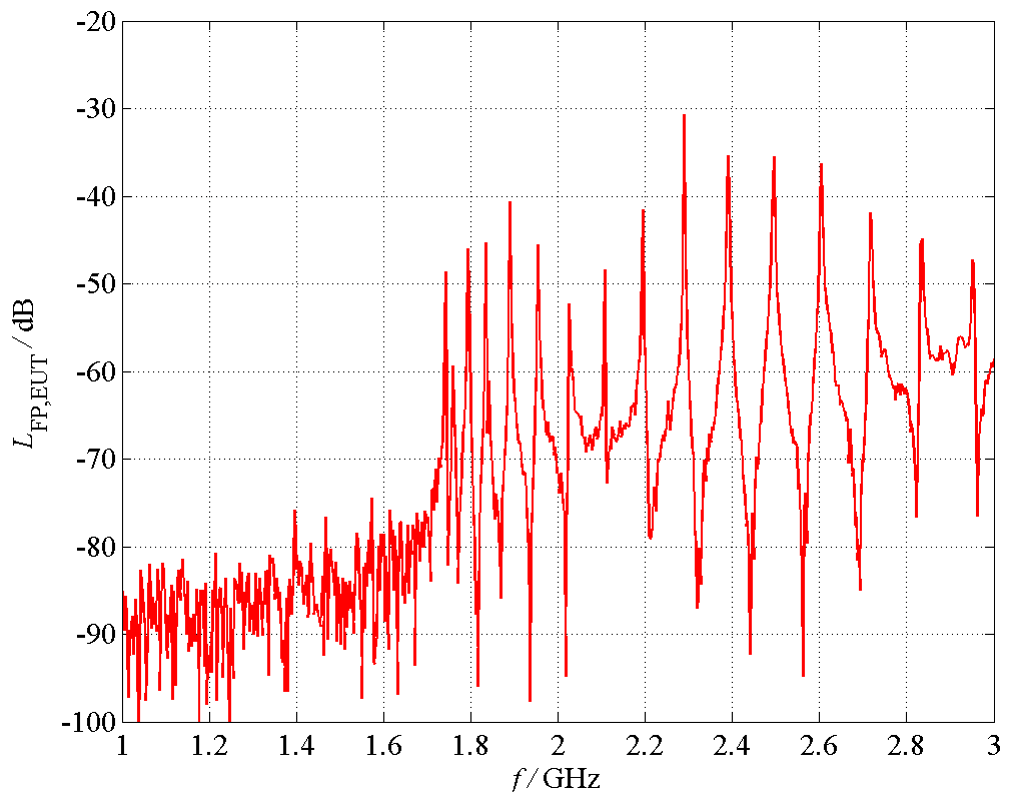
Figure 15Measured field probe signal, the field probe is positioned inside the enclosure with DA=40 mm.
Lastly, the effect of the aperture size is investigated. Increasing DA leads to a small decrease of the resonance frequency as well as to a significant decrease of the quality factor. Table 3 includes the measurement results for the TE114-resonance. While decreases only by 1.1 %, the Q-factor is reduced by the factor 40. This result seems to be sensible, because the losses due to aperture radiation to the surroundings increase with an increasing aperture size, which leads to a decreasing contribution Q3 in Eq. (8) and, consequently, to a decrease of the total quality factor Q. Furthermore, the highest gain and thus the highest field amplitudes do not occur for the largest aperture size, but for DA=50 mm. The corresponding gain is 26 dB higher than for the largest aperture size. The evaluation of all measurements points out, that the highest gain is detected for aperture sizes of DA=50 … 70 mm. Both essential results, the maximum for the gain in case of medium sized apertures (DA=50 … 70 mm) as well as the decreasing Q-factor for increasing apertures sizes can be also seen in Figs. 9 and 10, since higher Q factors are characterized by smaller resonance peaks.
Table 3Measured resonance frequencies and quality factors for the -resonance.
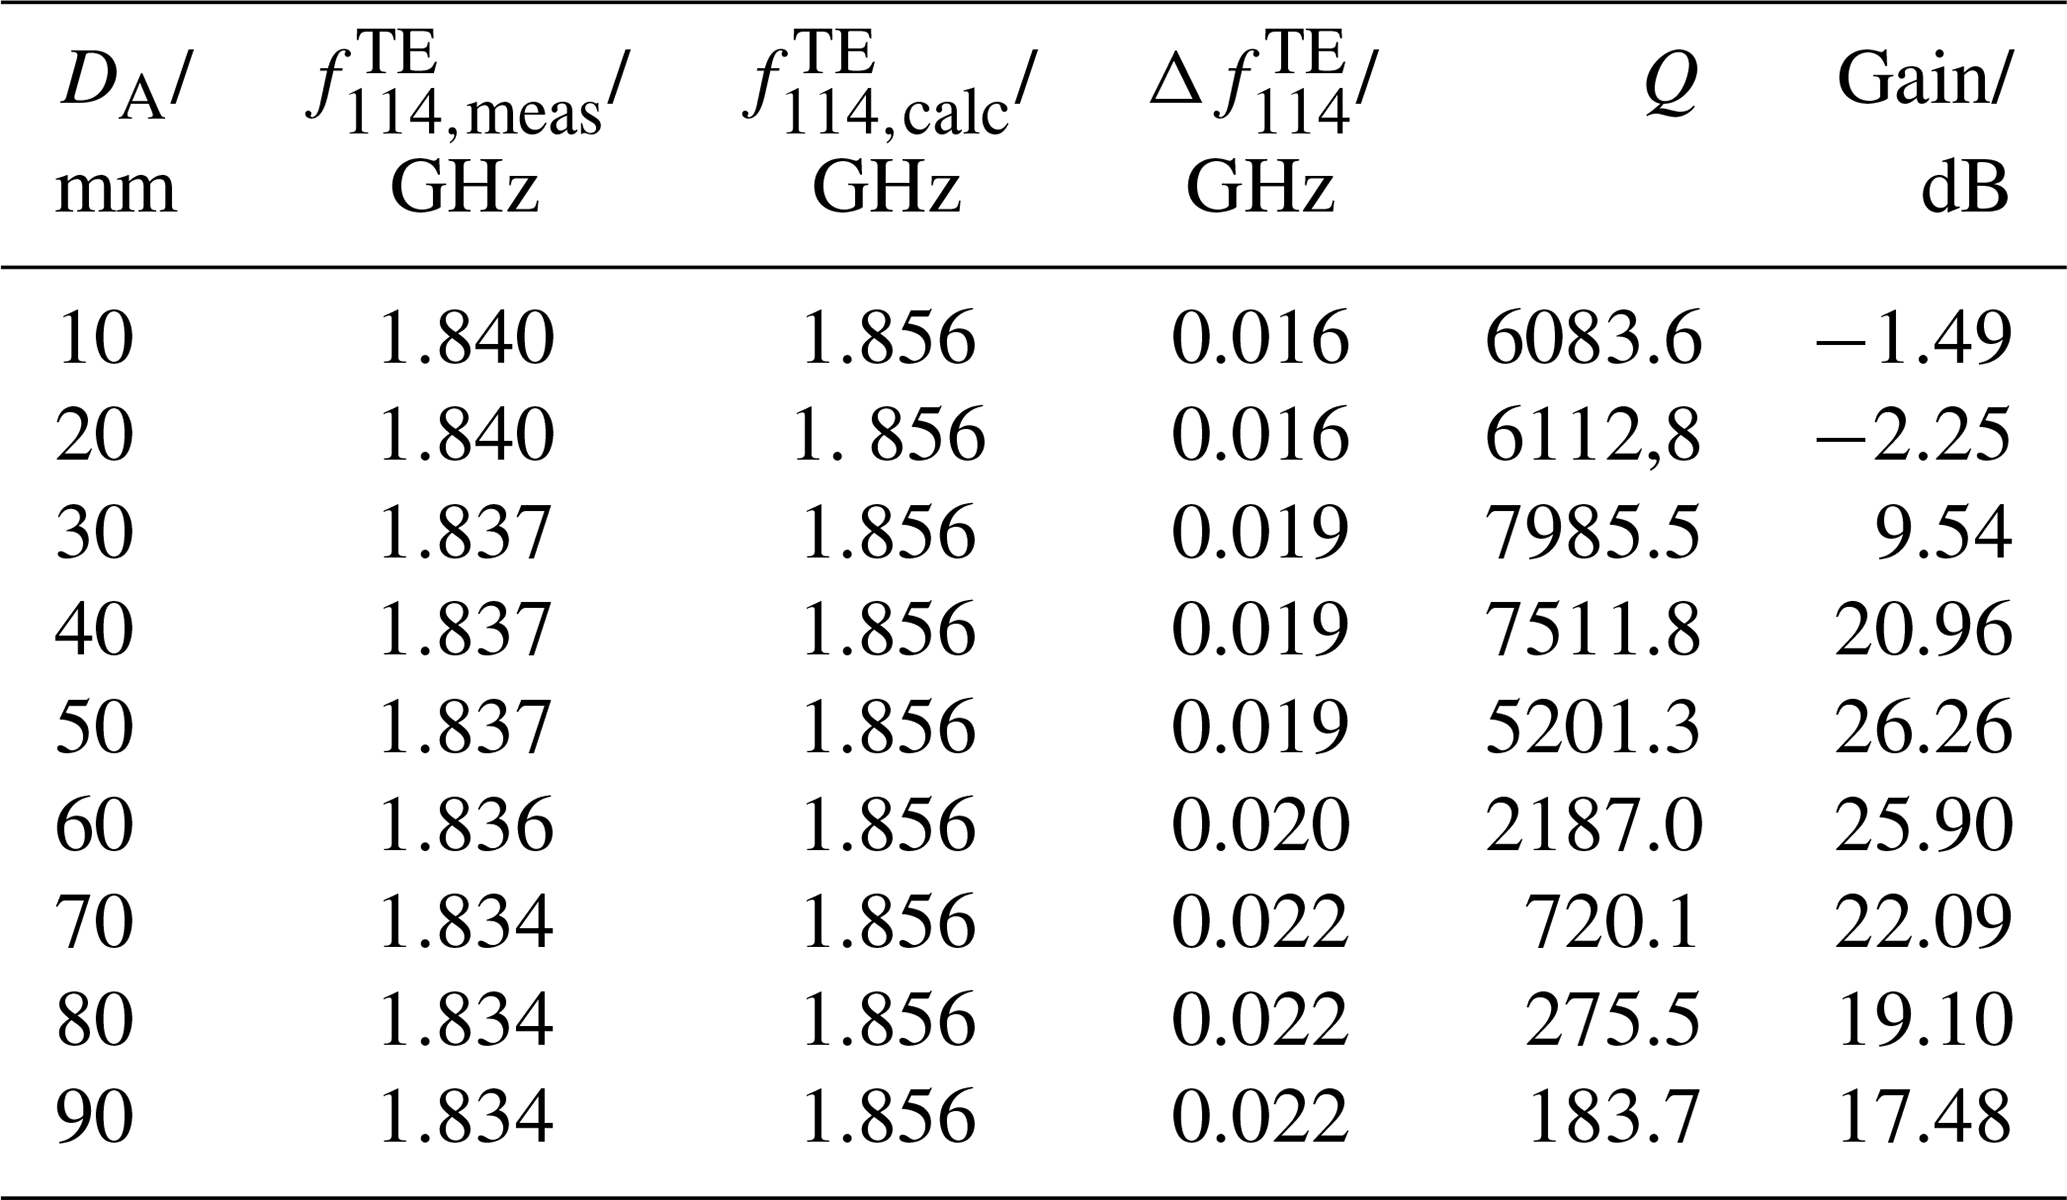
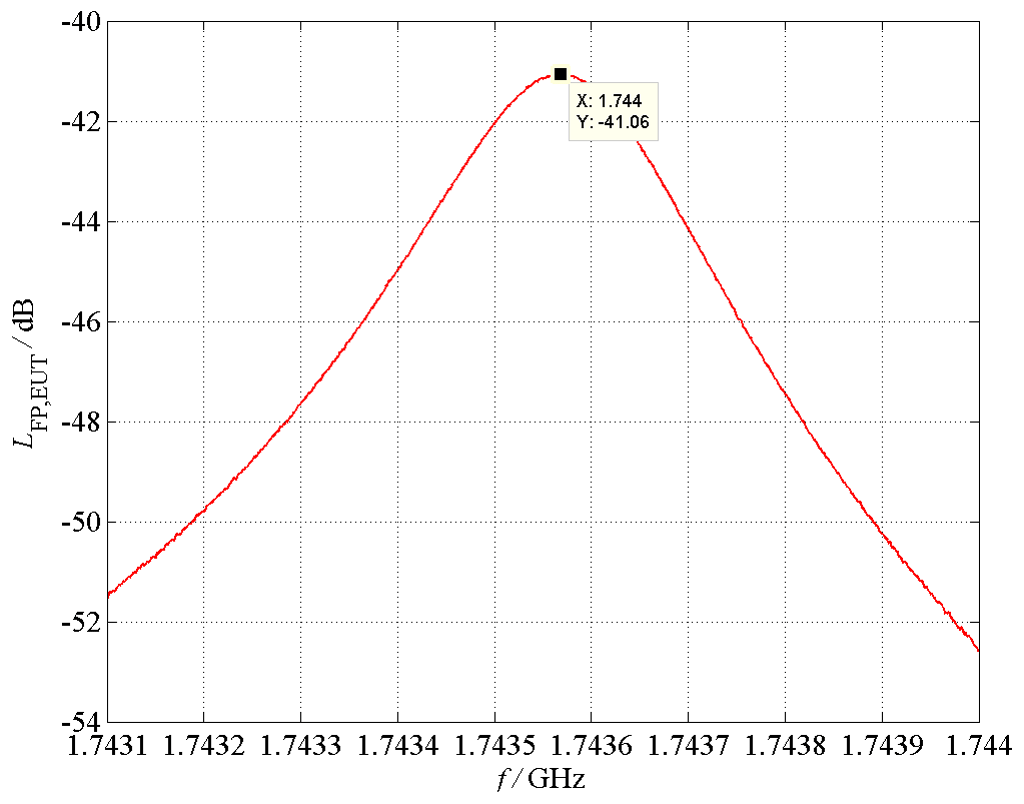
Figure 16Measurement of the quality factor, the field probe is positioned inside the enclosure with DA=40 mm.
In this contribution, the coupling of high altitude nuclear electromagnetic pulses (NEMP) and ultra wideband (UWB) pulses into shielded enclosures of vulnerable systems is examined by means of an enclosure of long cylindrical shape (hollow cylinder). The metallic enclosure is part of a generic system, which also consists of an electronic component that is not further considered herein. Setting up a topological model of the generic system allows the definition of critical regions or rather critical subvolumes which are of significant importance with respect to the immunity of the complete system. Here, the most critical subvolume is the region where the electronic part of the overall system is typically placed. The measurement with electromagnetic pulses pointed out, that the enclosure behaves like a waveguide. The NEMP pulse cannot reach the critical subvolume because its spectral components are completely below the cut-off frequency of the waveguide, whereas the UWB pulse can be detected by an optical field sensor in this volume, since this pulse contains spectral components above the cut-off frequency. In this case, the maximum value of the sensor signal increases with the aperture size, whereas the total duration of this signal becomes smaller. The findings are validated by additional measurements in the frequency domain and numerical field calculations.
Additionally, the resonance behavior of the enclosure is characterized by the specific quantities resonance frequency fres and corresponding quality factor Q depending on the aperture size. It can be shown, that the quality factor decreases with an increasing aperture size. An interesting aspect is, that the highest field amplitudes at a certain resonance frequency occur neither for the smallest aperture size, which has the highest quality factor, nor for the largest aperture size, which has the highest field values in case of pulse excitation. However, the largest field amplitude at a certain resonance frequency is detected at medium size apertures of DA=50 … 70 mm, thus critical aperture sizes can be defined. The presented method and results deliver revealing information about the coupling behavior of transient signals into a proper volume and can be used for deriving appropriate countermeasures in order the ensure the immunity of vulnerable systems.
All data presented in this article are available from the corresponding author upon request.
The authors declare that they have no conflict of interest.
This article is part of the special issue “Kleinheubacher
Berichte 2017”. It is a result of the Kleinheubacher Tagung 2017, Miltenberg,
Germany, 25–27 September 2017.
The publication of this article was funded by the
Open Access
Fund of the Leibniz Association.
Edited by: Frank Gronwald
Reviewed by: two anonymous referees
Baum, C. E.: Electromagnetic topology: A formal approach to the analysis and design of complex electronic systems, in: Proceedings of the 4th International Zurich Symposium on Electromagnetic Compatibility, 10–12 March 1981, Zurich, Switzerland, 209–214, 1981.
Baum, C. E.: On the Use of Electromagnetic Topology for the Decomposition of Scattering Matrices for Complex Physical Structures, Interaction Note 454, 1 July 1985, SUMMA Foundation, available at: http://eceresearch.unm.edu/summa/notes/In/0454.pdf (last access: 29 January 2019), 1985.
Fisahn, S. and Garbe, H.: Protective properties of a missile enclosure against electromagnetic influences, Adv. Radio Sci., 5, 63–67, https://doi.org/10.5194/ars-5-63-2007, 2007a.
Fisahn, S. and Garbe, H.: Coupling of transient electromagnetic fields to a generic missile enclosure via aperture and wire penetration, in: Proceedings of the EMC Europe, 13–15 June 2007, Paris, France, 2007b.
Fisahn, S. and Garbe, H.: Differences in the Coupling Behavior of Fast Transient Pulses to short PCB Traces, in: Proceedings of the 2009 International Symposium on Electromagnetic Compatibility Kyoto (EMC 2009 Kyoto), 20–24 July 2009, Kyoto, Japan, 361–364, 2009a.
Fisahn, S. and Garbe, H.: Special Coupling Effects of UWB Pulses to Short Signal Traces, in: Proceedings of the IEEE International Symposium on Electromagnetic Compatibility, 17–21 August 2009, Austin, Texas, USA, 231–236, 2009b.
Fisahn, S. and Garbe, H.: Unterschiedliches Einkoppelverhalten von (N)EMP- und UWB-Impulsen in kurze Leiterbahnen, in: Proceedings Internationale Fachmesse und Kongress für Elektromagnetische Verträglichkeit, 9.–11. März 2010, Düsseldorf, Germany, 63–70, 2010.
Fisahn, S., Sabath, F., and Garbe, H.: Protective Properties of a Generic Missile Enclosure to different Electromagnetic Influences, in: Proceedings of the IEEE International Symposium on Electromagnetic Compatibility, 8–13 July 2007, Honolulu, Hawaii, USA, 1–6, 2007.
Fisahn, S., Koj, S., and Garbe, H.: Modelling of Multi-Megawatt Wind Turbines for EMI and EMS Investigations by a Topological Approach, in: Proceedings of the 2017 32nd General Assembly and Scientific Symposium of the International Union of Radio Science, 19–26 August 2017, Montreal, QC, Canada, 1–4, 2017.
Giri, D. V. and Tesche, F. M.: Classification of Intentional Electromagnetic Environments (IEME), IEEE T. Electromag. Compatib., 46, 322–328, 2004.
Gronwald, F.: On the applicability of conventional transmission line theory within cavities, Adv. Radio Sci., 4, 117–123, https://doi.org/10.5194/ars-4-117-2006, 2006.
Gronwald, F.: Iterative Solution of a Nonlinear Antenna Problem Inside a High-Quality Resonating Chamber, in: Proceedings IEEE EMC Europe Symposium, 17–21 September 2012, Rome, Italy, 2012.
Gronwald, F., Blume, E., and Nitsch, J.: Computation of the frequency response of a nonlinearly loaded antenna within a cavity, Adv. Radio Sci., 2, 57–62, https://doi.org/10.5194/ars-2-57-2004, 2004.
Gronwald, F., Glüge, S., and Nitsch, J.: On network representations of antennas inside resonating environments, Adv. Radio Sci., 5, 157–162, https://doi.org/10.5194/ars-5-157-2007, 2007.
Herlemann, H., Fisahn, S., Koch, M., and Garbe, H.: Effects of Shielding Enclosures on the Breakdown Failure Rate of Electronic Equipment, in: Proceedings of the 8th International Symposium on Electromagnetic Compatibility EMC Europe 2008, 8–12 September 2008, Hamburg, Germany, 1–5, 2008.
Hill, D. A., Ma, M. T., Ondrejka, A. R., Riddle, B. F., Crawford, M. L., and Johnk, R. T.: Aperture excitation of electrically large, lossy cavities, IEEE T. Electromag. Compatib., 36, 169–178, 1994.
Jackson, J. D.: Klassische Elektrodynamik, 3. Auflage, 3. Deutsche Übersetzung und Bearbeitung Kurt Müller, De Gruyter, Berlin, New York, 2002.
Kotzev, M., Kreitlow, M., and Gronwald, F.: Transient Excitation of Nonlinearly Loaded Resonators and Observation of System Responses in Time Domain, in: Proc. of the 2016 International Symposium on Electromagnetic Compatibility – EMC EUROPE 2016, 5–9 September 2016, Wroclaw, Poland, 2016.
Nitsch, J., Tkachenko, S., and Potthast, S.: Pulsed excitations of resonators, Interaction Notes, Note 619, available at: http://www.ece.unm.edu/summa/notes/In/IN619.pdf (last access: 29 January 2019), 2010.
Thye, H.: Zur transienten Wellenausbreitung in GTEM-Zellen, Dissertation, Gottfried Wilhelm Leibniz Universität Hannover, Hannover, 2012.
Tkachenko, S., Nitsch, J., and Rambousky, R.: Electromagnetic field coupling to transmission lines inside rectangular resonators, Interaction Notes, Note 623, available at: http://www.ece.unm.edu/summa/notes/In/IN623.pdf (last access: 29 January 2019), 2011.
Tkachenko, S., Rambousky, R., and Nitsch, J.: Electromagnetic field coupling to a thin wire located symmetrically inside a rectangular enclosure, IEEE T. Electromag. Compatib., 55, 334–341, 2013.
Vogt, A., Bruens, H.-D., Wu, Q., Gronwald, F., and Schuster, C.: A Measurement Setup for Quantification of Electromagnetic Interference in Metallic Casings, IEEE T. Electromag. Compatib., 57, 1354–1364, 2015.