 | 19 Sep 2019
High-resolution signal-in-space measurements of VHF omnidirectional ranges using UAS
Thorsten Schrader
Jochen Bredemeyer
Marius Mihalachi
David Ulm
Thomas Kleine-Ostmann
Christoph Stupperich
Sergei Sandmann
Heyno Garbe
In this paper, we describe measurement results of the signal-in-space of very high frequency (VHF) omnidirectional range (VOR) facilities. In aviation VOR are used to display the current course of the aircraft in the cockpit. To understand the influence of wind turbines (WT) on the signal integrity of terrestrial navigation and radar signals, the signal content and its changes, respectively, must be investigated. So far, only numerical simulations have been carried out on the frequency-modulation (FM) part of the Doppler-VOR (DVOR) signal to estimate the influence of WT on DVOR. Up to now, the amplitude-modulated (AM) part of the DVOR was not assessed at all. In 2016, we presented an unmanned aerial system (UAS) as a carrier for state-of-the-art radio-frequency (RF) measurement instrumentation (Schrader et al., 2016a, c; Bredemeyer et al., 2016), to measure and to record the true signal-in-space (both FM and AM signal) during the flight. The signal-in-space (which refers to time-resolved signal content and field strength, respectively) is measured and sampled without loss of information and, furthermore, synchronously stored with time stamp and with precise position in space, where the measurements were taken.
- Article
(11697 KB) - Full-text XML
- BibTeX
- EndNote


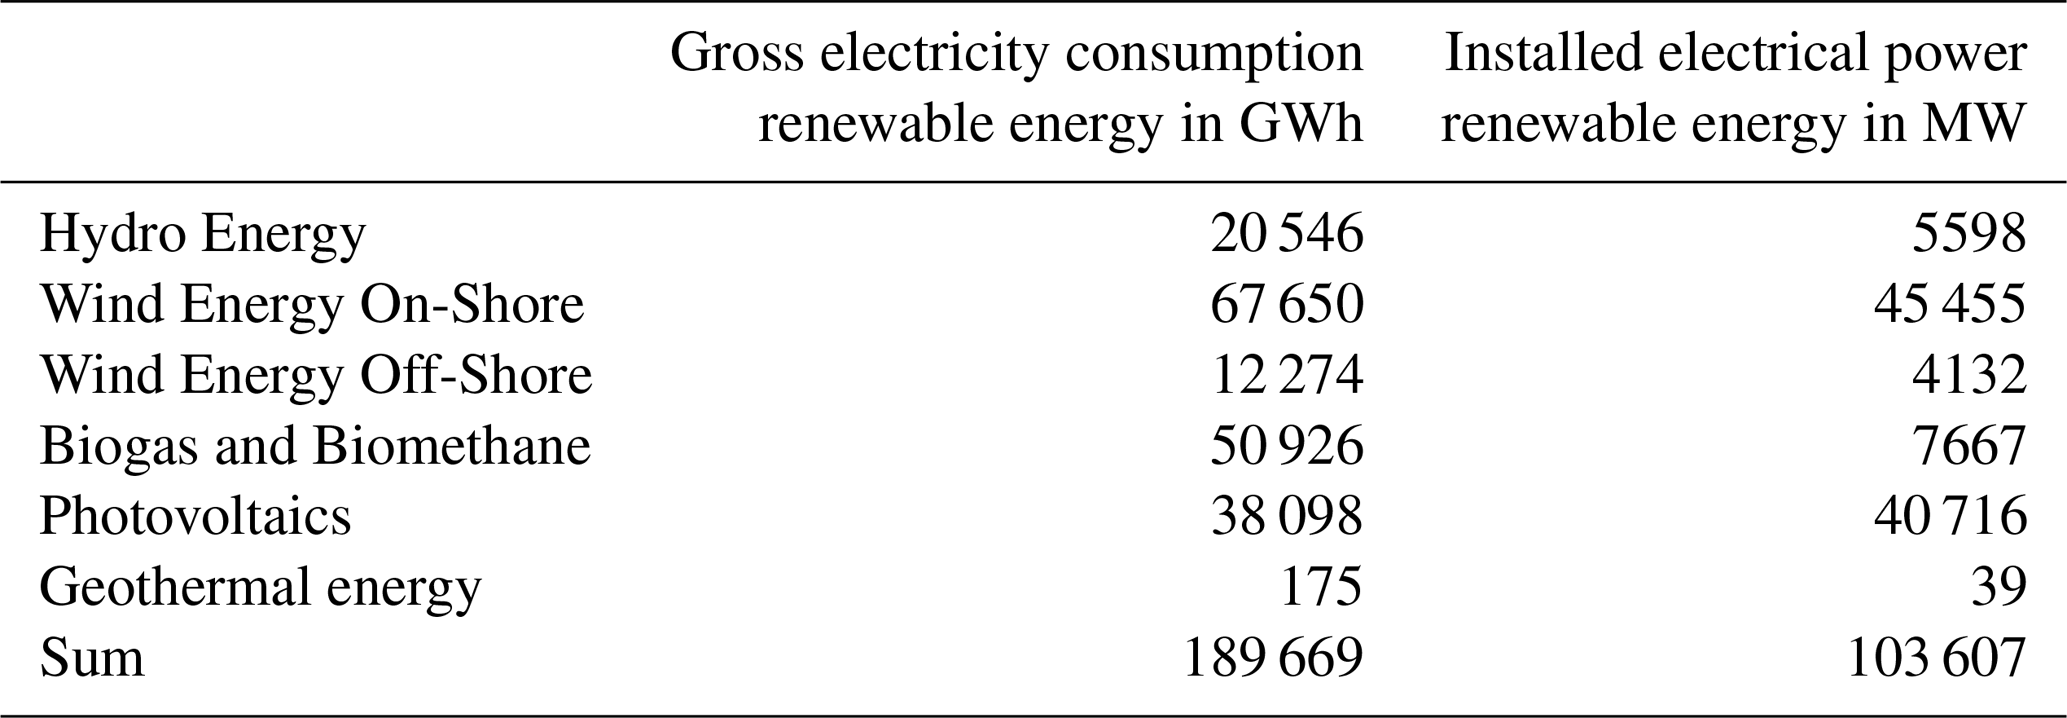
After the political decision in Germany to stepwise shut down nuclear fission and fossil fuels burning power plants, many new sources of renewable energy will have to be installed to ensure the electric energy supply. Amongst these sources are biogas-fuelled power plants, photovoltaic systems, and wind turbines. In 2016, more than 22 000 wind turbines were installed in the Federal Republic of Germany (BMWi, 2016, see Table 1 for gross energy consumption and installed power of renewable energy sources, 31.6 % of electrical energy are from renewable sources). In 2050, about 80 % of the energy consumption shall be covered by renewable energy. To meet this goal, many more WT will have to be installed.
Table 1Gross electricity consumption and installed electrical power, both for renewable energy (BMWi, 2016).
Contrary to this, the land development plans of German regional authorities are not even close to offer sufficient areas for new WT constructions, and other restrictions against WT installations are set by environment protection, bird conservation and risk assessment for safe flight operation according to the German Air Traffic Act § 18a. The national implementation of § 18a requires a formal approval of buildings up to 3 km distance and WT up to 15 km distance to air navigation facilities such as radars or VORs (ICAO EUR DOC 015, 2015). Part of the approval process of WT to be newly installed or repowered is the decision of the Federal Supervisory Authority for Air Navigation Services (Bundesaufsichtsamt für Flugsicherung – BAF), which is based on an assessment of the German Air Navigation Services (Deutsche Flugsicherung GmbH – DFS). In case of VOR, the assessment is about the bearing angle which is the course information used by aircrafts for both area navigation and approach and departure procedures, respectively. According to (ICAO DOC 8071, 2000) momentary deviations due to scalloping must not exceed 3∘ and the bearing error due to bends should be less than 3.5∘. The assessment conducted by DFS takes into account the measured bearing angle error obtained by classic flight inspection (FI) during an orbit flight in 10 NM (nautical miles) distance to a VOR. This bearing angle error obtained from flight inspection is used as a preload of a DVOR installation and may be caused by the area topology, nearby high-voltage lines and other obstacles. This preload reduces the remaining error budget. Nearby WT may cause additional bearing angle errors. To assess these additional bearing errors, DFS has developed a software tool which takes into account all WT in a distance of up to 15 km, both current stock and planned installations of WT. The typical usable range of DVOR is about 150 km.
The onboard receiver of an aircraft receives the actual signal-in-space, which is the superposition of electromagnetic waves transmitted from a ground installation and their multipath propagation due to reflections from the terrain or from nearby obstacles.
The signal consists of two components, an amplitude-modulated (AM) reference signal and a frequency-modulated (FM) course signal. The phase difference between the AM and the FM signal conveys the course information to the aircraft. In principle, both signal components (AM and FM) could be distorted, which would result in a bearing error. This paper describes the investigations whether and to which extend WT contribute to additional bearing errors.
Up to now, conventional FI has proven an influence of WT only on CVOR (Claudepierre et al., 2017), but not on DVOR. For DVOR there are already numerous and elaborated numerical simulation models available (Greving et al., 2012; Greving, 2017). But a validation of these DVOR models by in-situ measurements at real installations and on real signals was missing. Likewise, miniaturized model setups lack validation by measurements in real constellations (Geise et al., 2014; Geise, 2018).
To better understand a potential interaction between WT and terrestrial navigation and radar systems, the project WERAN was carried out by PTB and its project partners FCS GmbH, Braunschweig, steep GmbH, Bonn, and Leibniz University, Hannover. WERAN is the German acronym for “Interaction of wind turbines with terrestrial navigation and radar systems”. Finished in 2018, the project has delivered state-of-the-art RF measurement instrumentation based on an octocopter (UAS, drone with eight electric engines to carry the instrumentation), new algorithms (Sandmann and Garbe, 2016) to obtain the DVOR FM bearing error, and numerical simulations based on full wave models using a method of moments software Feko (Computer Aided Engineering, https://altairhyperworks.com/, last access: 30 January 2019). Measurement results from several campaigns related to both navigation and radar system (Bredemeyer and Schrader, 2018a, b; Bredemeyer et al., 2016, 2017, 2018) are available. Among these are
-
Non-directional beacons (NDBs),
-
Conventional and Doppler-VOR,
-
Wind profiler of the German Weather Forecast Service (Deutscher Wetterdienst – DWD),
-
Airport surveillance radars,
-
Military surveillance radars,
-
Precipitation radars (DWD),
-
Instrument landing systems (ILS, both localizer and glidepath – separate BAF project, not part of WERAN).
As an outcome of the WERAN project, a detailed measurement analysis about the true signal-in-space became available to the stakeholders and the scientific community. Not only field strength, but even more interesting, the time-resolved signal content was recorded in flights between ground level and up to 600 m altitude.
The WERAN project and the ILS research project conducted together with BAF (ILS is the instrument landing system) are part of arcass (advanced remote-controlled airborne sensor system), a current main research focus of the department High Frequency and Fields at PTB.
In Sect. 2, we describe the improvements of the instrumentation and the UAS during the WERAN and the BAF project. Details of measurement results are given in Sect. 3.
The UAS, the flying carrier for the RF instrumentation at PTB, was continuously improved during the WERAN and BAF project including shielding of the electronics against severe electromagnetic fields, precision localization, integration of the different types of antennas, communication with the operator, and its visibility to air traffic controllers. We have already reported on shielding, precision localization, and the electronics in Bredemeyer et al. (2016), Bredemeyer and Schrader (2016), and Schrader et al. (2016a).
2.1 Antenna design
Both design and integration of different types of antennas onto the UAS were optimized using an electromagnetic simulation tool based on finite integration techniques (CST, Computer Simulation Technology, https://www.cst.com/, last access: 30 January 2019), taking into account the frequency of interest, mechanically stable design of the different antennas, and size constraints of the flying platform. The UAS and its onboard components are subject to vibrations. Parts must not come off during flight as they would damage the propellers.
We started with simple models of antennas and optimized these with respect to frequency and antenna pattern. In the next step, we integrated them onto the UAS and observed the change in performance, mainly their receiving pattern. Slight variations of the mounting position of the antennas had quite large and unexpected impact on the overall reception pattern.
The shielding box of the electronics provided a well-defined shape rather than the complex geometry of the UAS electronics. Hence, the design of the antennas was simplified. Another advantage is that the shielding box is located around the centre of gravity of the UAS: For VHF frequencies, the shielding box is still small compared to the wavelength, so a bow-tie antenna was constructed with the box being in the centre of the antenna (cp. Fig. 1). Due to the automatic stabilization and levelling, the UAS will move around its centre of gravity. An antenna having its phase centre coincident with the centre of gravity shows a dipole-like reception pattern (Fig. 2). This reduces the measurement uncertainty caused by movements of the UAS as far as possible.
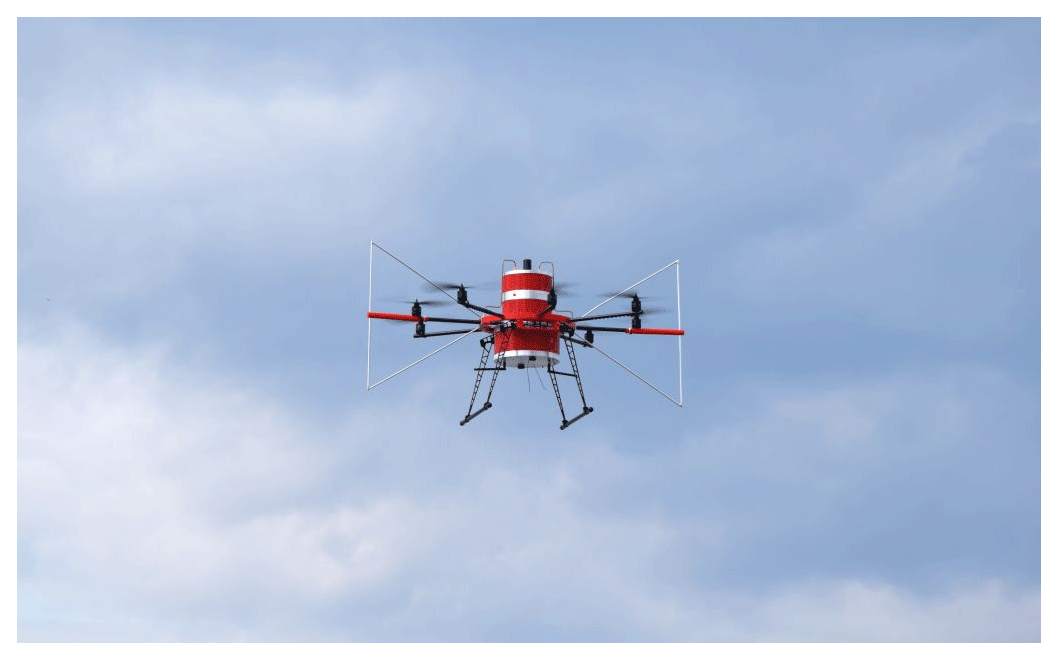
Figure 1The UAS (octocopter PTBee 3) with a bow-tie antenna for VHF measurements. Its centre of gravity matches the phase centre of the antenna which results in a dipole-like reception pattern.
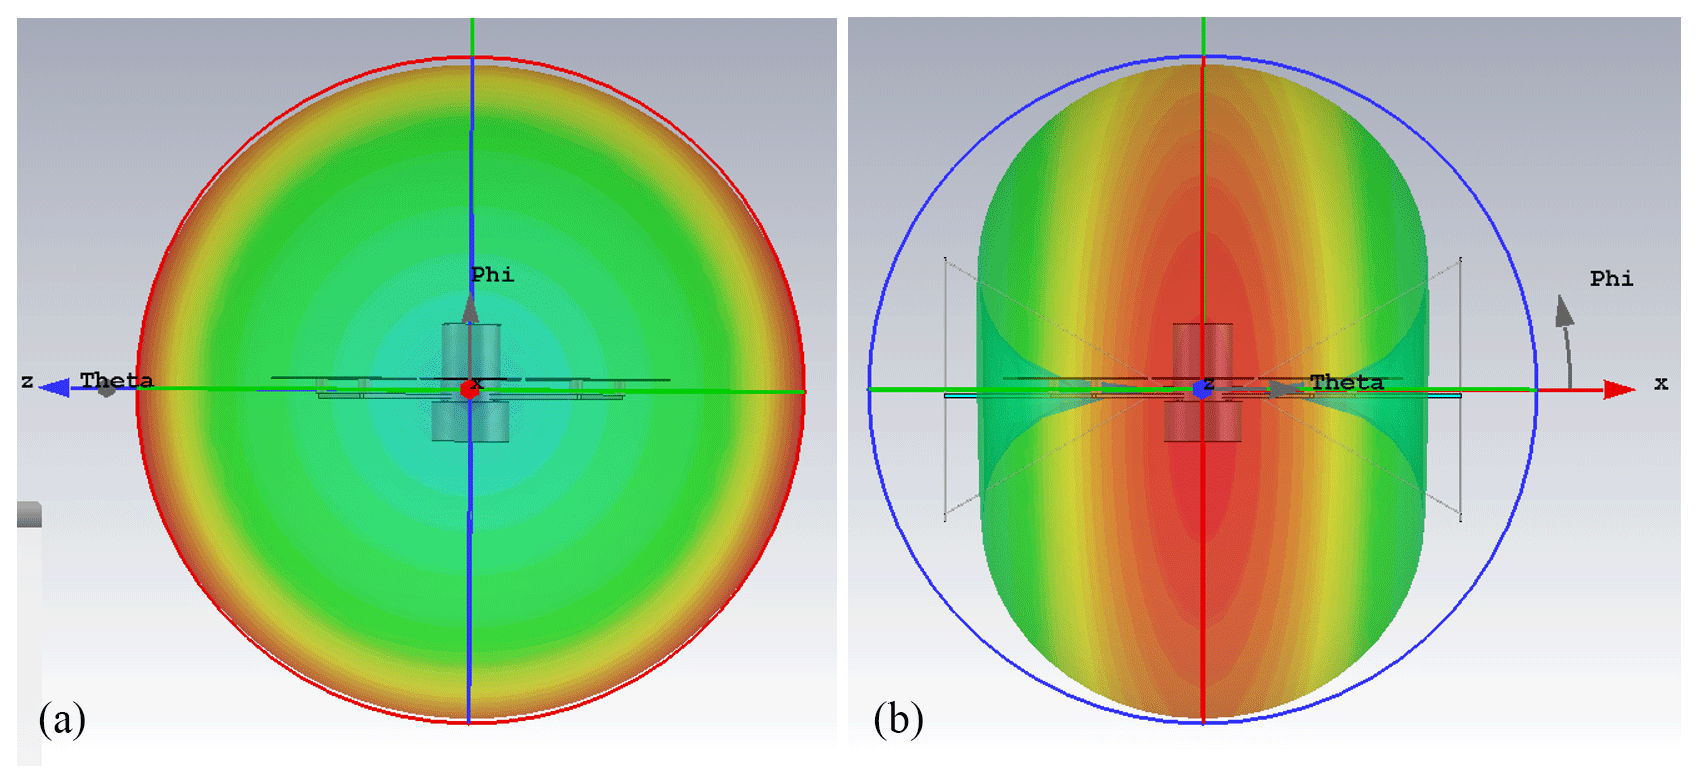
Figure 2Calculated reception pattern of the bow-tie antenna installed onto the UAS. Left picture shows the reception pattern seen from the side, the right picture shows the reception pattern from the front (cp. Fig. 1).
For the UHF range (application wind profiler) the size of the shielding box is in the order of the wavelength. Therefore, a different design of the antenna had to be chosen. Using the metal housing as a reflector, a Yagi-Uda type of antenna with two directors was designed (Balanis, 1997). We finished the second design as a crossed Yagi-Uda antenna for two perpendicular polarisations (Fig. 3). For each radar frequency we designed a wavelength-related dual-polarized patch antenna (Fig. 4), either by milling or using an etching process. Low cross-coupling between horizontal and vertical reception and an adequate match of each antenna to 50Ω were the main design goals.
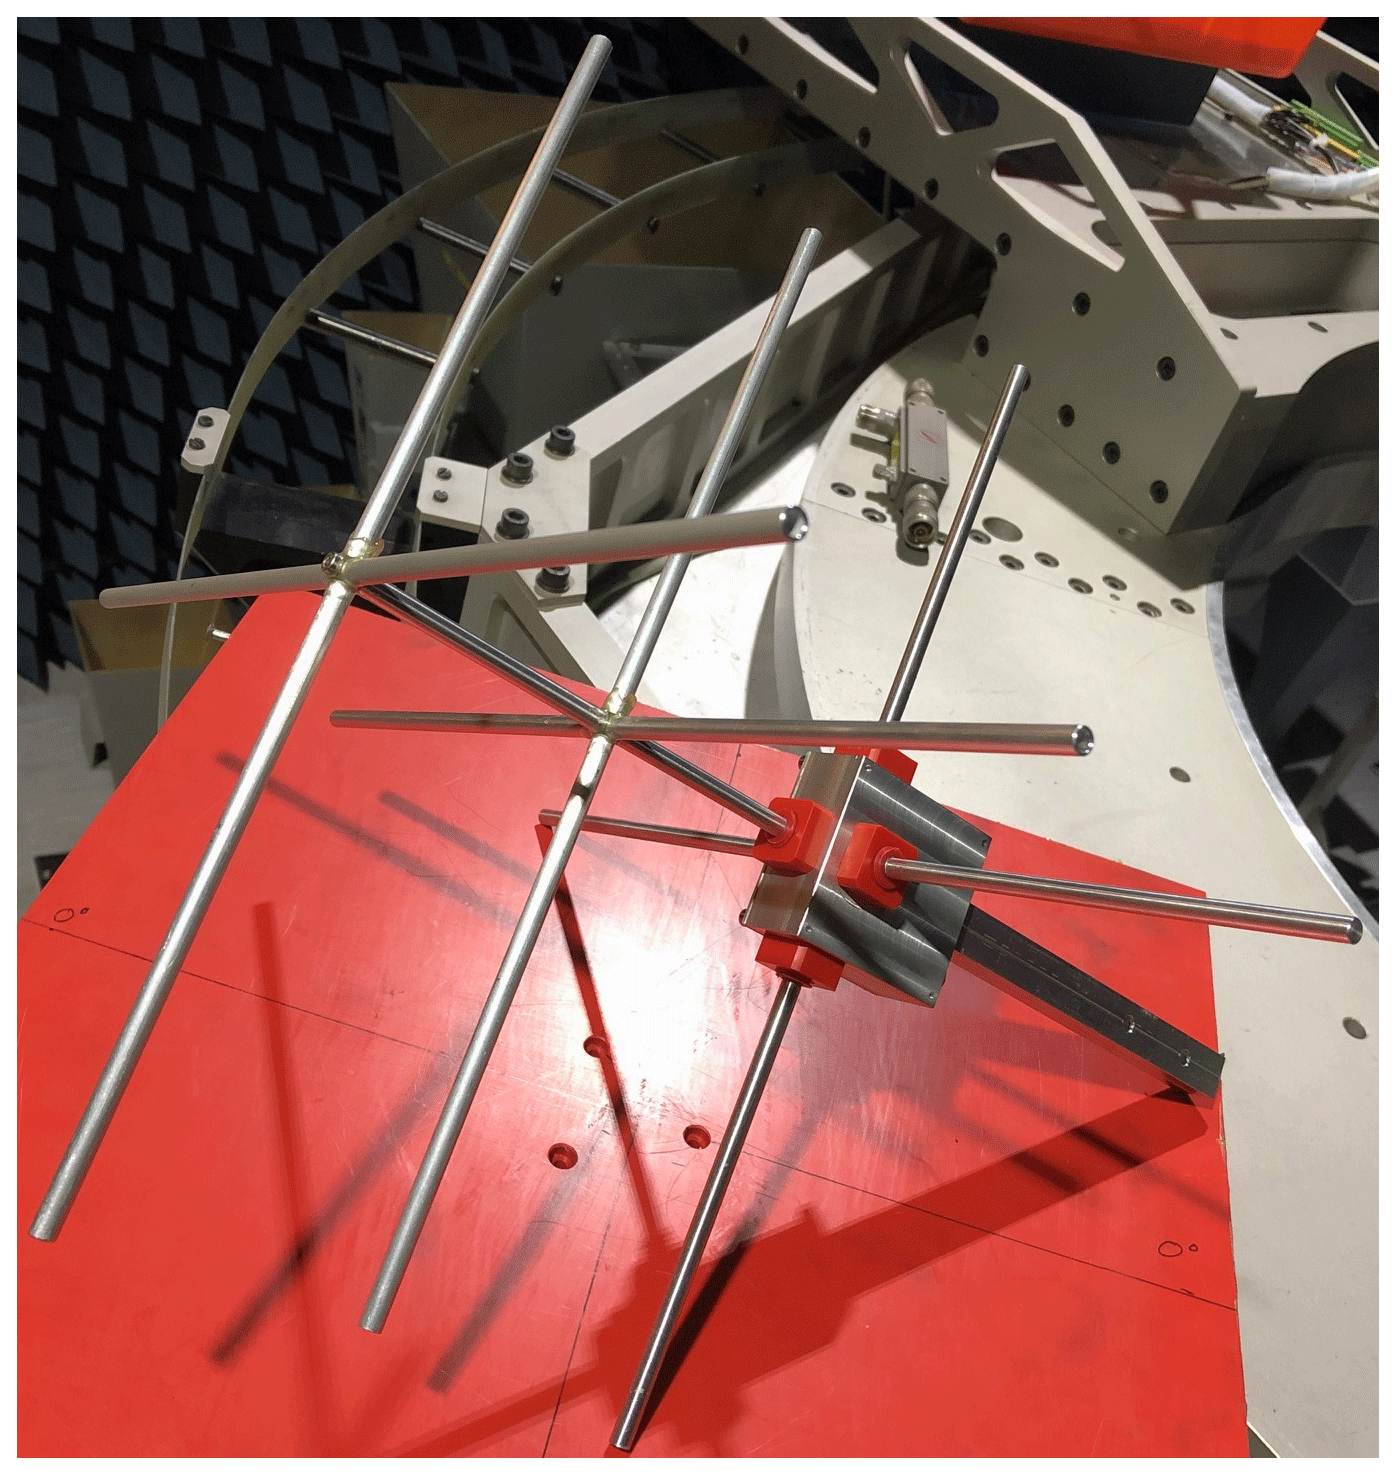
Figure 3Crossed Yagi-Uda antenna for UHF measurements (application: wind profiler radar of German Weather Forecast Service DWD).
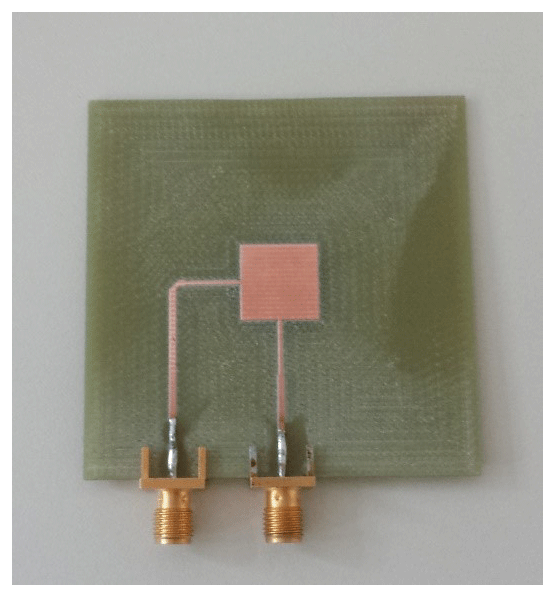
Figure 4Dual-polarized patch antenna for precipitation radar measurements. Manufactured by a milling process.
2.2 Data management
We have strictly separated piloting the flying platform on the one hand from controlling the sensing/receiving unit on the other hand. First, this makes it much easier to adapt the UAS to the latest firmware supported by the manufacturer of the main frame. Second, this allowed us to implement an app for a tablet computer and to up- and downlink real-time data and commands to the measurement unit.
During more than 250 flights up to now, the resilience of our UAS, the measurement unit, and the integrated antennas against wind, mechanical vibrations during flight and transport, and severe electromagnetic fields close to radar installations have been proven. We have also tested battery lifetime and maximum capacity to be used to provide a safety margin.
2.3 Visibility to air traffic controllers
The latest development greatly improved the flight safety of our UAS. As the platform is rather small in its dimensions, it can barely be seen from other aircrafts or even radar. For that reason, controlled airspace was closed during operation of the UAS or a NOTAM (notice to airmen) was issued. The project U-CON (“UAS connected”, Heidger, 2018) of DFS opened up a new era of drone operation in controlled airspace, as it adds the actual position of drones to the air traffic controllers' display. For the first time ever in Germany, DFS allowed restricted drone flights in the control zone of an international airport without closing the runways. The reason behind is quite simple – the UAS became visible to the air traffic control. The live position of the UAS is fed once a second into the DFS tracker via a mobile network VPN tunnel. Air traffic controllers can now monitor flight track, altitude and speed of the UAS as they can for regular aircrafts.
For VHF frequencies, the UAS was traceably calibrated with respect to the electrical high frequency (RF) field strength using PTB's open area test site (OATS). We have used the substitution method at 111.95 MHz, for which we got a limited test license granted from the German Federal Network Agency (Bundesnetzagentur – BNetzA). We compared the reading of a traceably calibrated field probe as a function of height in front of a dipole reflector antenna (DRA, Fig. 5). This antenna was designed to emit its main lobe under a slant angle of 15.8∘. After the field probe measurement (Fig. 6), we substituted the field probe with the UAS and repeated the height scan with reduced transmit power (Fig. 7). For this substitution we did not take into account any gain of the DRA as we used only transmit power, and the field probe calibration data for the calibration of the UAS. Then, in a second step, we used the numerically calculated gain of the DRA and the input power to calculate power density in 600 m distance and in about 200 m height above ground level. The comparison of calculated and measured power density up to 290 m height in Fig. 8 shows good agreement within 1 dB. The measurement uncertainty for electrical RF field strength was determined to 2.8 dB.
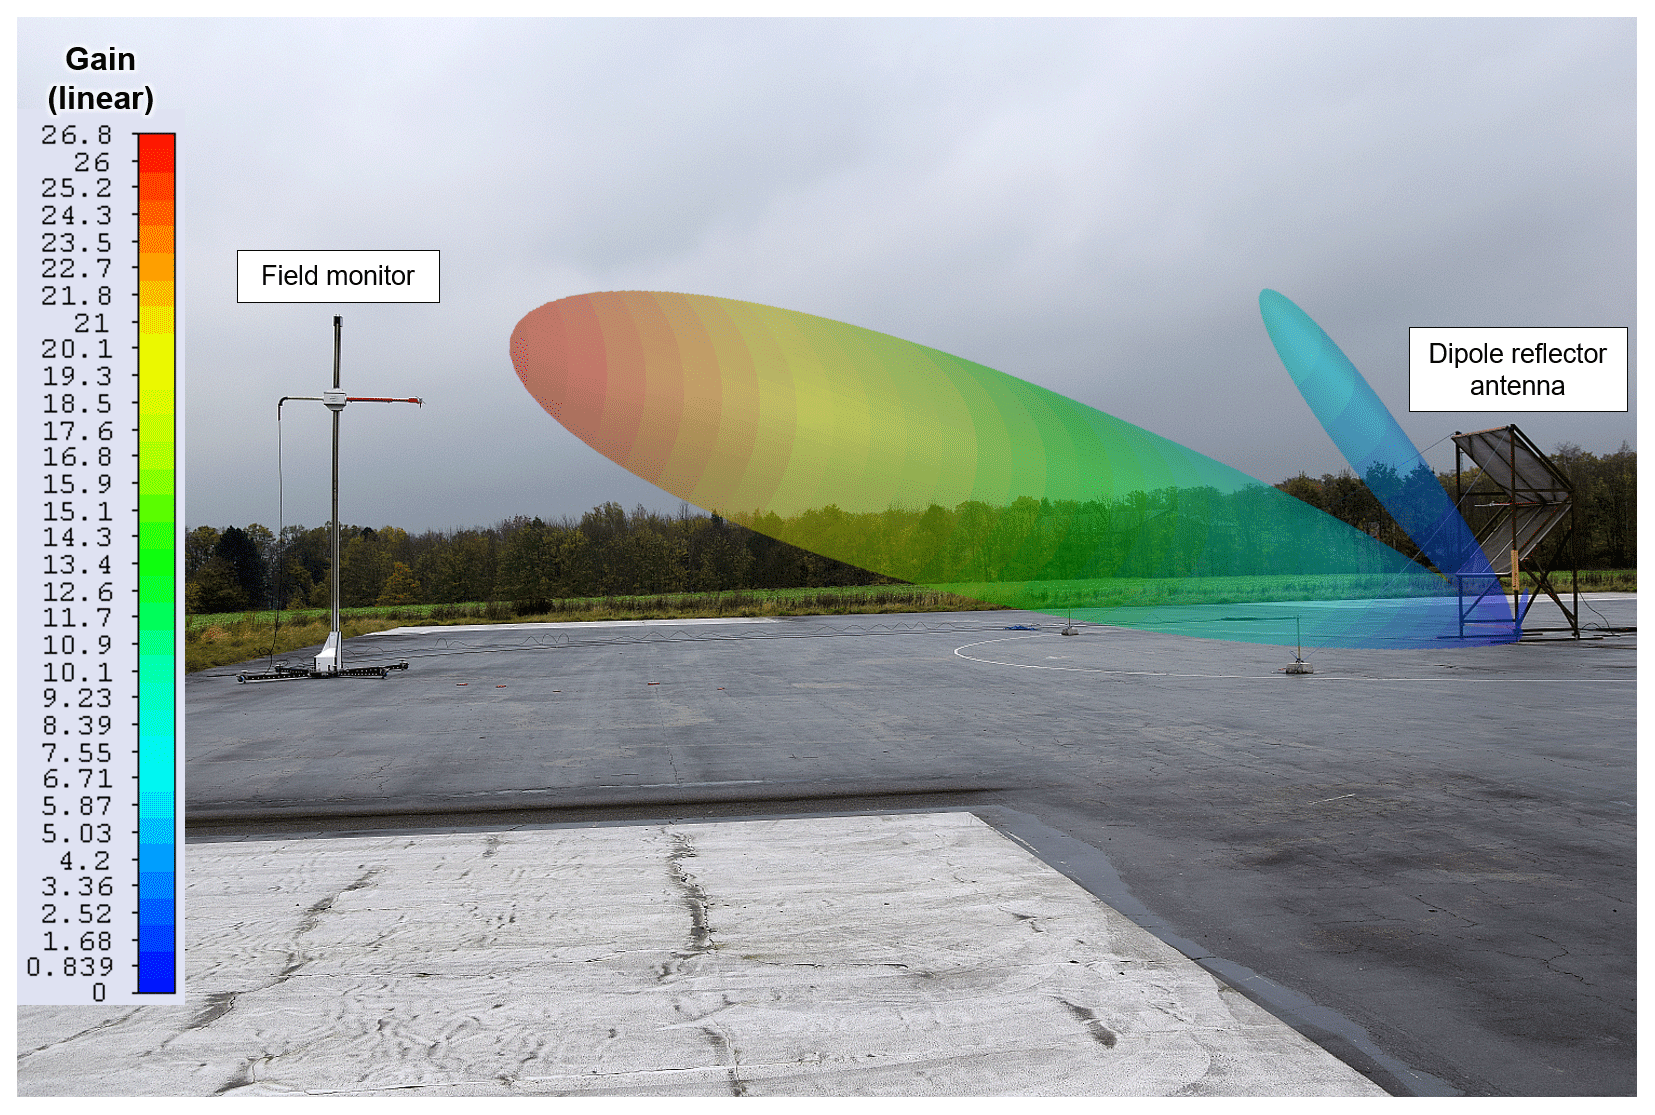
Figure 5Calculated pattern of a transmitter dipole reflector antenna (DRA) for validation of the field strength calibration of the UAS.
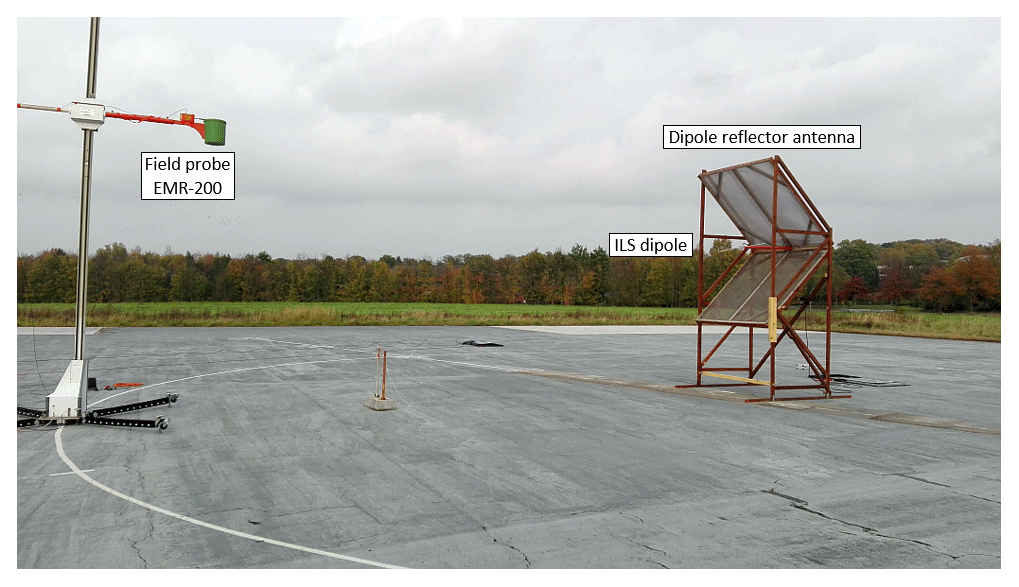
Figure 6Electrical field probe measurements in front of the dipole reflector antenna (DRA) as a function of height.
The UAS hardware was designed not only to measure RF electrical field strength levels, but signal-in-space which refers to signal content e.g. time-resolved AM or FM signals, radar pulses, and others. In order to validate this functionality, we have also tested several modulation types like ILS and VOR and compared the results measured with the UAS against a Rohde & Schwarz ILS/VOR analyser EVS300 as a ground monitor. We are currently working on traceability for modulation measurements.
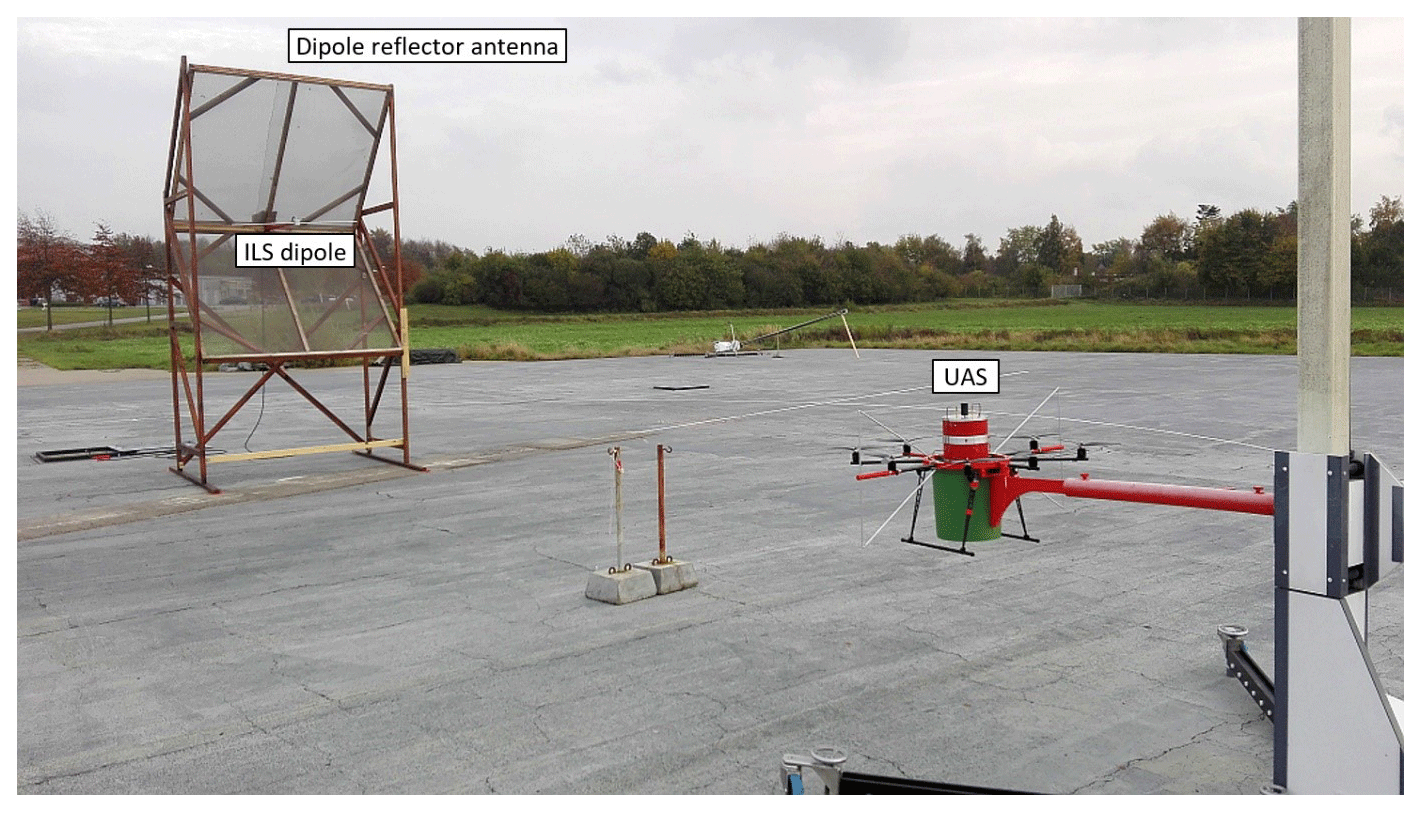
Figure 7UAS measurements of the electrical field strength in front of the dipole reflector antenna (DRA).
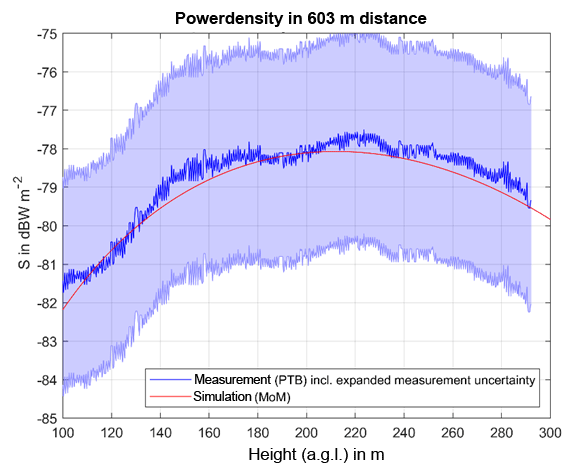
Figure 8Comparison of calculated and measured power density in 603 m distance to the transmitter antenna DRA and as a function of height.
3.1 CVOR and DVOR Measurements
In general, a DVOR emits two signals, an amplitude modulated (AM) reference channel and a frequency modulated (FM) course channel, in which the bearing angle is conveyed. For a conventional VOR (CVOR), the AM and FM signal parts are exchanged.
The airborne receiver onboard an aircraft takes the phase difference of both signals from which the bearing angle is calculated. As described in Schrader, et al. (2016), we obtain both signal parts (AM and FM channel) of the DVOR as a time-resolved signal-in-space measurement. As a first step, we measured the DVOR signals close to the transmitter on ground level. In Fig. 9 we show the phase resolution both for AM and FM, which is at least 0.01∘. In Fig. 10 we show measurements which have been performed during the slow-down of four large wind turbines with 140 m hub height and 112 m rotor diameter. The UAS hovered just behind one of the four wind turbines with the camera facing the direction of the DVOR in about 8 km distance (Fig. 11). The trace “bearing” in Fig. 10 indicates the reference bearing angle solely calculated from the global navigation satellite system (GNSS) position. AM and FM phases are the time-dependent signals measured with the UAS. The trace “Level” indicates the receiver level at centre frequency. It shows a typical time-dependent modulation during slow-down of the wind turbines, which is similar to a shutter function to the receiver level when a rotor blade is blocking the line of sight to the DVOR. Neither the AM nor the FM trace show significant impact of the shutter.
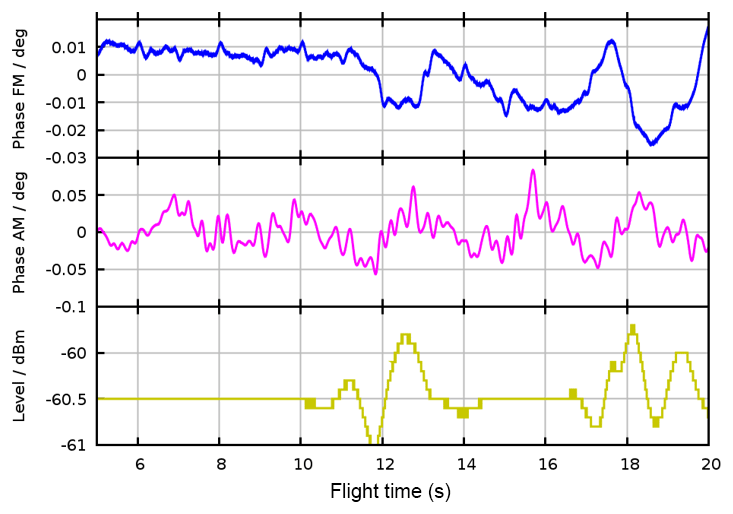
Figure 9Separate AM and FM phase resolution of the UAS measurements on the ground close to a DVOR transmitter. Indicated level is the received DVOR carrier level.

Figure 10Bearing is the reference bearing angle calculated from GNSS, measured AM- and FM phase, and received carrier level. Only the carrier lever is visibly modulated during the slow-down of four large wind turbines.
In Fig. 12 results are shown for measurements of a CVOR. The UAS was hovering at about hub height and first facing towards the CVOR (Fig. 13) and one WT at boresight. Later, the UAS rotated clockwise around its vertical axis. The receiver level dropped at 90∘ rotation by about 12 dB, which is reasonable due to the sensitivity of the dipole (cp. Fig. 2b). The FM component was very stable within a few hundreds of a degree without any noise (not shown here), but the AM component showed large phase deviations up to ±5∘. To the right, two other large WT were located, which may have contributed to the large deviation of the bearing angle. At 180∘ rotation of the UAS the deviation was smaller again.
To investigate the error propagation into space, we have numerically simulated the bearing error caused by a single WT with 140 m nacelle height in three vertical planes in 3, 4, and 5 km distance to the DVOR (Fig. 14). We observed a typical pattern, which gives the impression of an optical projection (pattern is increasing with distance). The horizontal green lines in Fig. 14 indicate the crossover from the area with large bearing errors below and lower errors above. With increasing distance, the green line is moving up. That means, with increasing distance to the obstacle (WT) the bearing angle error reaches higher altitudes where air traffic is expected.
The red lines show an error distribution, where the maximum error does not change with distance. But, following a red line from right to left, the indicated bearing error changes its spatial frequency from high (at 2 km distance) to low further away (3 km or 4 km distance). That means, travelling with the same air speed along the red line first at 2 km distance and then at 4 km distance, the bearing error changes less rapidly. At larger distances, an aircraft may be able to follow the swings of the bearing angle in positive or negative direction and the aircraft could move accordingly.
These results could explain the terms scallops and bends used in aviation and throughout the ICAO documents. Scallops are rapidly changing error distributions in space which aircrafts are not able to follow due to their inertia. Bends are slowly changing bearing errors and aircrafts may be able to follow those course deviations. Numerical simulations have shown that scallops may develop into bends further away from the obstacle e.g. a WT. A major problem would occur, if an aircraft constantly follows such bends e.g. along a radial away from or towards the DVOR, since the aircraft would depart from its intended course increasingly. If the bearing error changes from plus to minus, but symmetrically around zero, the course of the aircraft would be straight on the intended track (eventually with a slight swing as described before).
In the case of one or more WT, the direct wave emitted from the VOR and the scattered fields from all obstacles (WT in this case) superimpose at a given location. This superposition of fields results in an error distribution which depends on the flight altitude, the distance of the aircraft course to the WT, and of course on the size and local arrangement of the WT (Schrader, et al., 2015, 2016b, 2017a, b, c, 2018; Mihalachi, 2018). This error distribution may yield a scallop or a bend.
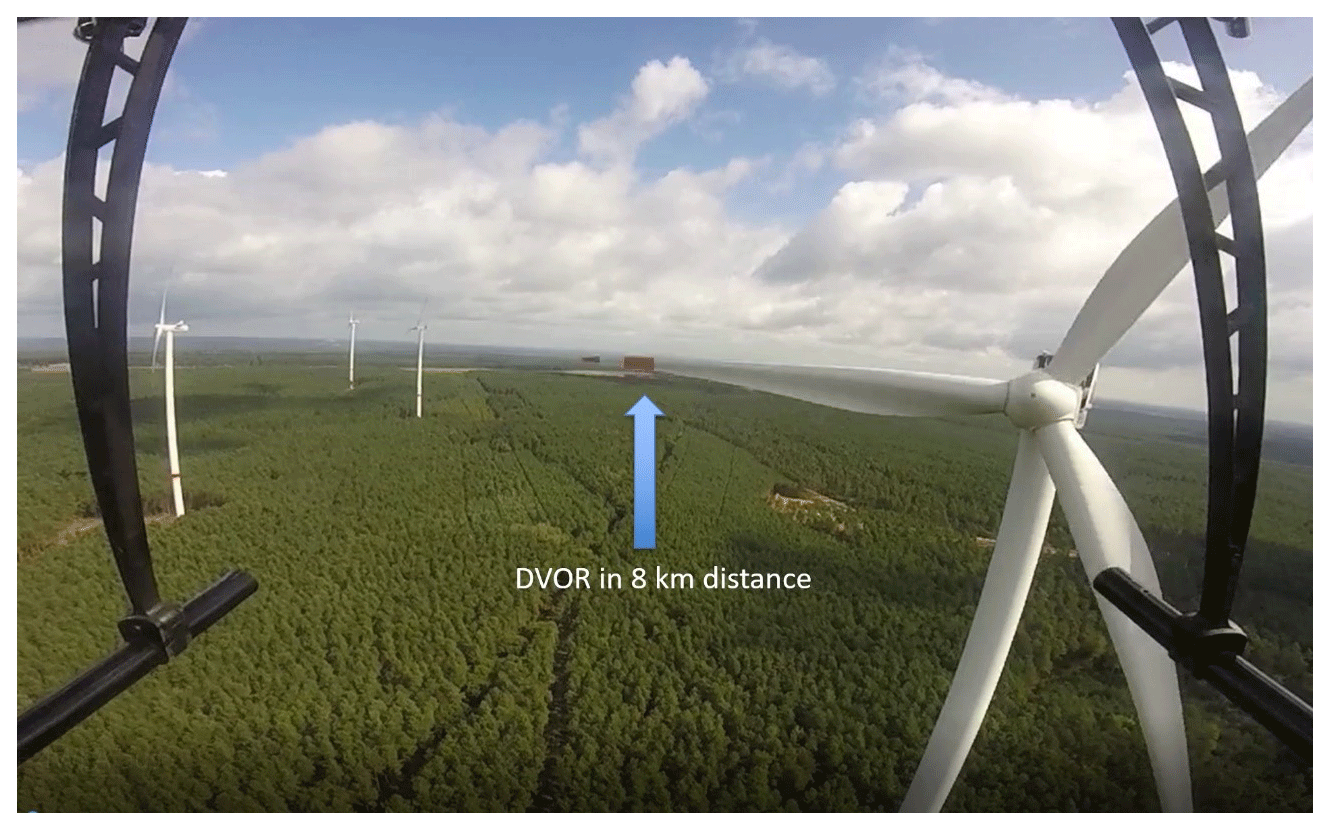
Figure 11Picture from the video stream taken during a hover flight at hub height behind a wind turbine. The camera points towards the DVOR in about 8 km distance. In this position the data from Fig. 10 was measured.
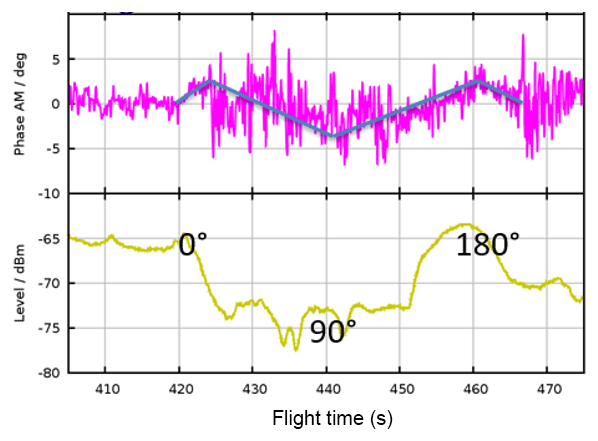
Figure 12Signal-in-space measurements on a CVOR. The FM phase (not shown) is nearly constant within a few hundredths of degrees without noise. At first the UAS faced the CVOR (0∘), then it rotated slowly to 90∘ and further on. Receiver level is given for the carrier frequency.
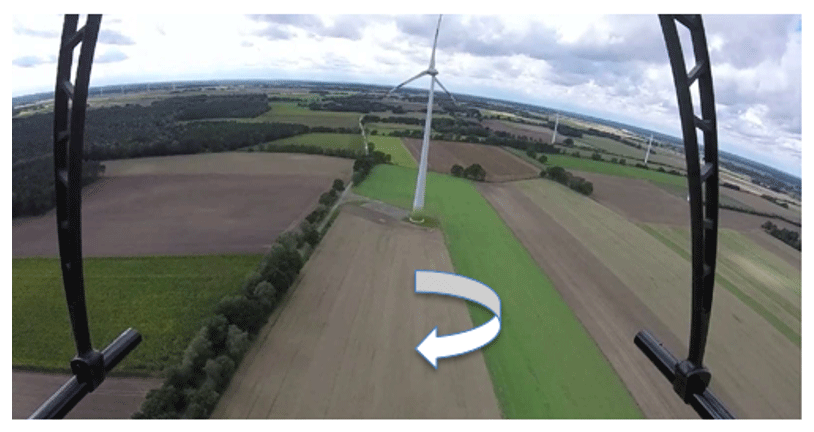
Figure 13Picture taken from a video stream during hover flight. The camera is facing towards the CVOR in 3 km distance. Later the UAS rotated around its vertical axis clockwise during measurement (cp. Measurement data in Fig. 12).
To gain more insight into the local bearing error distribution we have measured the signal-in-space at different positions behind a wind park consisting of nine large WT with 140 m hub height and 112 m rotor diameter. The wind park is located about 8 km away from the DVOR. The first position of the UAS measurement (cp. Fig. 15) was about 100 m behind one WT, the second flight was about 1 km behind the wind park, the third flight about 3 km behind the wind park. Flight altitude was 150, 150 and 200 m respectively. The measurement results in Fig. 16a, b, and c indicate a similar bearing error amplitude for each of the three flights, but a varying spatial frequency. The frequency is higher for a close-by object (a) and it becomes smaller for larger distances to the obstacles (b and c). This is in line with the findings from the numerical simulation. The general shape of the curves (a), (b), and (c) follows the reference bearing derived from GNSS data and is not of interest here.
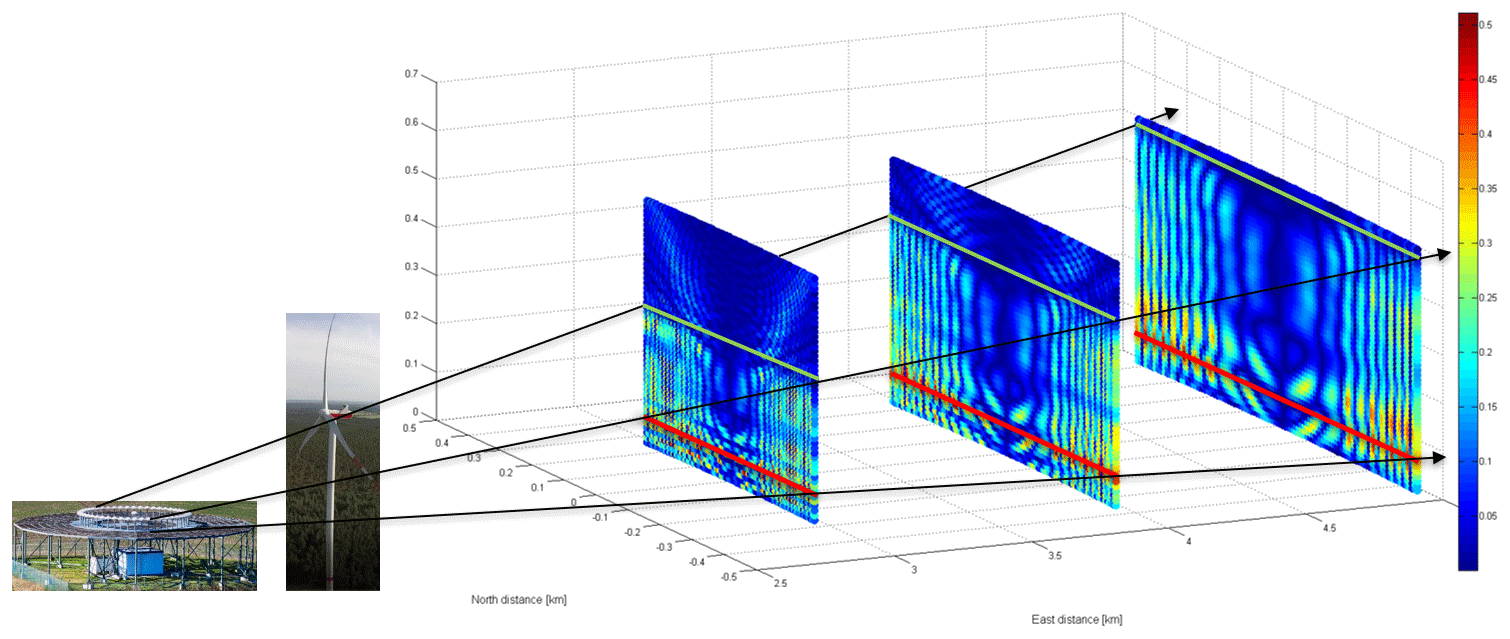
Figure 14Vertical planes indicating the simulated bearing error (range from 0 to 0.5) propagation into space. Distance DVOR – WT 2 km, first plane in 3 km distance to the DVOR, second and third plane in 4 and 5 km, respectively. The error distributions shown give the impression of an error projection.
The necessary expansion of renewable energies requires an enormous increase in photovoltaic and wind energy plants in order to guarantee a secure power supply in the future. As wind turbines increase in size due to power conversion efficiency, their possible interference with terrestrial navigation and radar systems has to be investigated. Many building permits for new wind turbines have already not been issued because a danger to air traffic in accordance with § 18a Air Traffic Act could not be ruled out. The Federal Supervisory Office for Air Navigation Services (BAF) decides each building application on an assessment result by the German Air Traffic Control (DFS).
To investigate the possible interference between wind turbines (WT) and terrestrial navigation and radar installations we measured the true signal-in-space up to 600 m altitude in various distances to those obstacles e.g. WT. We used a commercial frame of an octocopter, which we improved according to our needs. This octocopter was equipped with state-of-the-art RF electronics to measure time-resolved data (signal-in-space) of navigation systems. The data is then stored synchronously with time stamp and actual position onboard the unmanned aerial system (UAS). Special measures were taken to improve the installation of the antennas onto the UAS as well as the communication to the operator using a tablet computer. Due to the visibility of the UAS to air traffic controllers using U-CON made available by DFS we have been able to measure at an airport without closing down a runway.
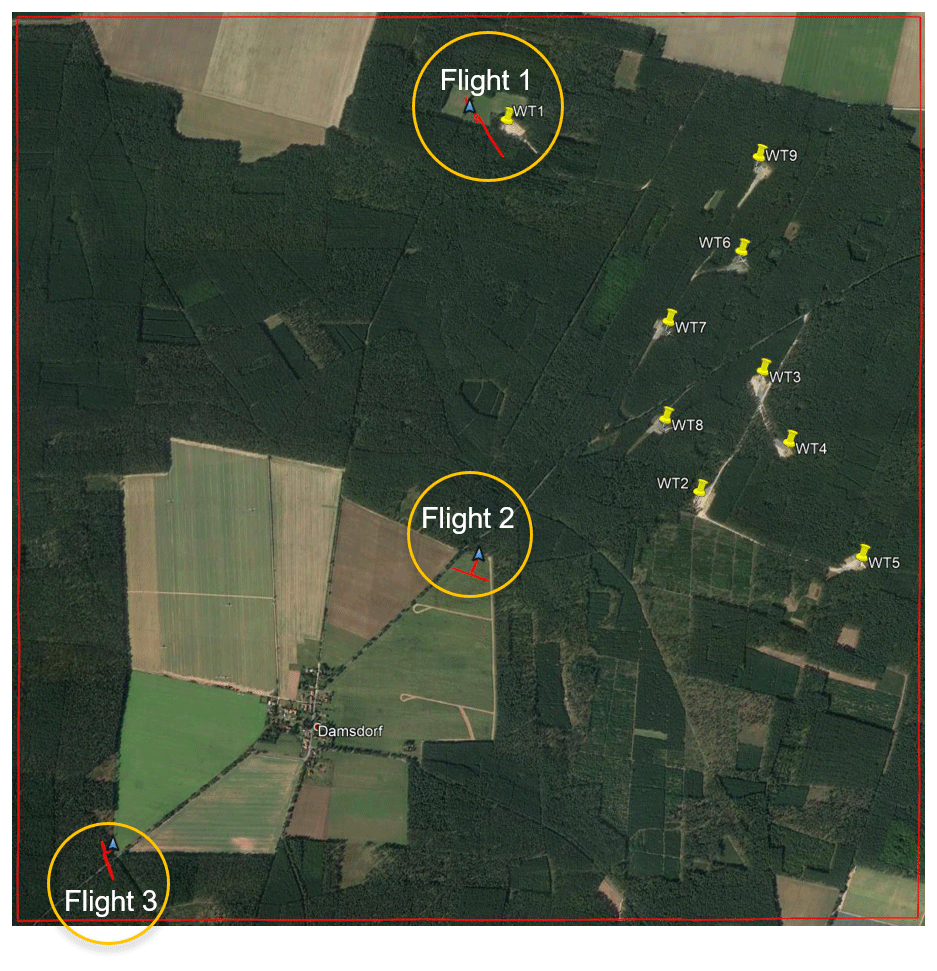
Figure 15Setup of nine wind turbines (marked as yellow dots). The map is oriented with respect to geographic North. UAS measurement paths are indicated with red lines (flight 1 about 100 m behind a WT, flight 2 about 1 km behind the wind park, flight 3 about 3 km behind the wind park). The DVOR is located in the North-East in about 8 km distance (Map picture from ©Google Earth).
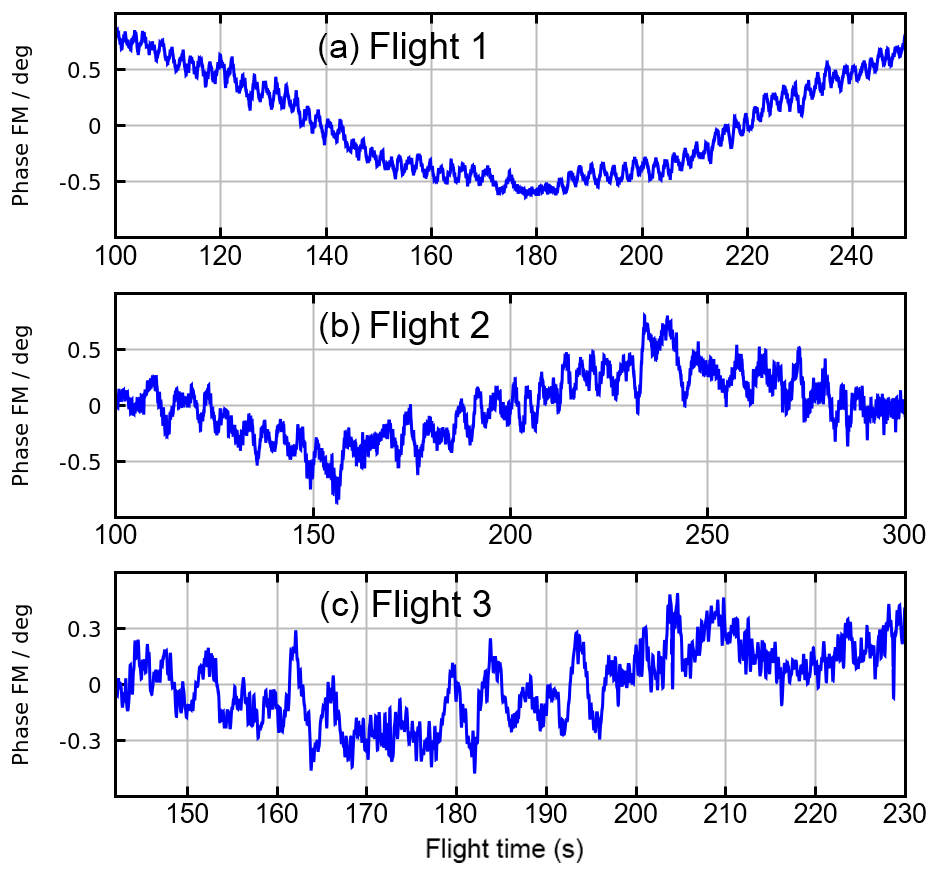
Figure 16Measurements of the signal-in-space behind nine large wind turbines (WT) in about 8 km distance to the DVOR (setup cp. Fig. 15). (a) (flight 1) is about 100 m behind a WT, (b) (flight 2) is in 1 km distance behind the wind park and (c) (flight 3) is in 3 km distance behind the wind park.
We have traceably calibrated the UAS with installed antennas for electrical field strength and have validated the calibration with field strength measurements. For that purpose, we designed a dipole reflector antenna (DRA), emitting electromagnetic fields under a slant angle of 15.8∘. Its far-field gain was calculated using the Method of Moments. From gain and input power we have calculated the power density in 600 m distance and up to 280 m height. We found good agreement between measurements of the power density using the calibrated UAS and our calculations within 1 dB.
Deploying the UAS, we were able to measure the time-resolved signals of the two components of a DVOR, the amplitude modulated (AM) reference signal and the frequency modulated (FM) bearing signal. The phase difference between the AM- and the FM signal conveys the course indication to the aircraft. Measurements of the AM and FM signal phase components close to a Doppler-VOR (DVOR) showed the phase resolution to be better than 0.01∘, which is roughly ten times better than the uncertainty of the bearing error to be investigated.
Numerical simulations of the bearing error for a large WT indicated the impression of an optical projection of the error mask into space. Measurements with the UAS on a set of nine WTs with 140 m hub height and 112 m rotor diameter showed good correlation with very laborious numerical simulations. So far, the largest bearing error of DVOR was found in the direction of forward scattering, only few degrees off the radial from DVOR to the WT.
First work to come up with a prediction of the influence of wind turbines on DVOR using a simple model has been very promising as it shows reasonable correlation with measurements.
Measurements on a conventional CVOR indicated much larger interferences with WT than DVOR. This was observed e.g. during horizontal rotation of the UAS during a hover flight first facing the CVOR in 2.5 km distance. At 90∘ rotation angle of the UAS, we observed the largest deviation of the bearing angle for this setup. When the dipole antenna was facing towards the two WTs at the side, we did not only obtain the largest bearing angle deviation of several degrees, but simultaneously we noticed a receiver level drop of 12 dB. This is in line with the dipole pattern of the UAS' antenna and as well in line with the expectation that the largest bearing error of CVOR is to be found in 90∘ to the obstacle.
The data contains several 100 GB and is therefore only available upon request.
TS, JB, CS, TKO, and HG designed the experiments. JB, MM, and TS designed the hardware. Author and coauthors carried out the experiments and interpreted the results. MM and TS performed the flights. DU, MM, and TKO analyzed the measurement uncertainty. SS and HG developed the model code and performed the simulations. TS prepared the manuscript with contributions from all coauthors.
The authors declare that they have no conflict of interest.
This article is part of the special issue “Kleinheubacher Berichte 2018”. It is a result of the Kleinheubacher Tagung 2018, Miltenberg, Germany, 24–26 September 2018.
The authors thank DFS Deutsche Flugsicherung GmbH, DWD Deutscher Wetterdienst, and Bundesaufsichtsamt für Flugsicherung (BAF) for continuing support and ongoing discussions.
This research has been supported by the German Federal Ministry for Economic Affairs and Energy on the basis of a decision by the German Bundestag (grant no. FZ 0325644A-D).
This paper was edited by Michael Vogt and reviewed by two anonymous referees.
Balanis, C.: Antenna Theory – Analysis and Design, New York, John Wiley & Sons, 1997.
BMWi: Bundesministerium für Wirtschaft und Energie, available at: http://www.erneuerbare-energien.de/EE/ Redaktion/DE/Downloads/zeitreihen-zur-entwicklung-der-erneuerbaren-energien-in-deutschland-1990-2016.pdf?__blob=publicationFile&v=12 (last access: 30 January 2019), 2016.
Bredemeyer, B. and Schrader, T.: Employing UAS to Perform Low Altitude Navaids Measurements, International Flight Inspection Symposium (IFIS), Monterey, California, 2018a.
Bredemeyer, J. and Schrader, T.: Signal-in-space Measurements using Microcopters, 19th International Flight Inspection Symposium (IFIS), Belgrade, Serbia, Conference Proceedings, 2016.
Bredemeyer, J. and Schrader, T.: Radar echoes of individual wind turbines measured in L, S and C band, Electromagnetic Waves and Wind Turbines, Delft, the Netherlands, 2018b.
Bredemeyer, J., Mihalachi, M., and Schrader, T.: Universal UAS-based platform for measurements of Radar signals-in-space, Specialist Meeting: Electromagnetic Waves and Wind Turbines, Wachtberg, Germany, 2016.
Bredemeyer, J., Schrader, T., Mihalachi, M., and Ulm, D.: Effects of Wind Turbines on Radar signals, in: Specialist Meeting: Electromagnetic Waves and Wind Turbines, Braunschweig, Germany, https://doi.org/10.7795/810.20180227, 2017.
Bredemeyer, J., Schrader, T., and Sandmann, S.: Measurements for classification of single wind turbine echoes, 19th International Radar Symposium IRS, Bonn, Germany, 2018.
Claudepierre, L., Douvenot, R., Chabory, A., and Morlaas-Courties, C.: Probabilistic VOR error due to several scatterers – Application to wind farms, 11th European Conference on Antennas and Propagation (EuCAP), 2017.
Geise, R.: Min-VOR-Win, Elektromagnetische Verträglichkeitsanalyse von Windenergieanlagen und Navigationssystemen der Luft- und Schifffahrt – Entwicklung von Verfahrensweisen mit skalierten Messungen und Hypothesentests mit 1:1 Validierungsflügen, Braunschweig, Germany, 2018.
Geise, R., Zimmer, G., Neubauer, B., and Enders, A.: Investigating Multipath Propagation for Navigation Systems in a Miniaturized Airport Environment ILS and extensions to VOR, 18th International Flight Inspection Symposium, IFIS 2014, Oklahoma City, Oklahoma, USA, 2014.
Greving, G.: Über Numerische 3D-Systemsimulationen und Systeme für Windkraftanlagen, Specialist Meeting: Electromagnetic Waves and Wind Turbines, Braunschweig, Germany, 2017.
Greving, G., Biermann, W., and Mundt, R.: Modelling and Numerical Analysis of Rotating Antennas and Rotating Scatterers Applied to Aeronautical System Simulations, 6th European Conference on Antennas and Propagation (EuCAP), Prague, 2012.
Heidger, R.: UTM in Germany – A connected vision, World ATM Congress (WAC), Madrid, Spain, 2018.
ICAO DOC 8071: Manual on Testing of Radio Navigation Aids, 4th Edn., Vol. I – Testing of Ground-based Radio Navigation Systems, 2000.
ICAO EUR DOC 015: European Guidance Material on Managing Building Restricted Areas, 3rd Edn., 1–8, plus annexes, 2015.
Mihalachi, M.: Vor-Ort-Antennen- und Feldstärke-Messtechnik: Fortschritte im Projekt WERAN, 311th PTB Seminar, PTB-Seminar, Braunschweig, Germany, 1–26, https://doi.org/10.7795/810.20180612, 2018.
Sandmann, S. and Garbe, H.: Uncertainty contribution of a wind turbine to the electric field of a DVOR antenna as a function of wind direction and rotor position, Adv. Radio Sci., 14, 17–24, https://doi.org/10.5194/ars-14-17-2016, 2016.
Schrader, T., Bredemeyer, J., Stupperich, C., Garbe, H., Mihalachi, M., Ulm, D., and Sandmann, S.: WERAN – Interaction of Windturbines with Terrestrial Navigation Systems and Radar, IEEE Symposium on Electromagnetic Compatibility, Dresden, Germany, https://doi.org/10.7795/810.20180227, 2015.
Schrader, T., Bredemeyer, J., Mihalachi, M., Rohde, J., and Kleine-Ostmann, T.: Concept and design of a UAS-based platform for measurements of RF signal-in-space, Adv. Radio Sci., 14, 1–9, https://doi.org/10.5194/ars-14-1-2016, 2016a.
Schrader, T., Bredemeyer, J., Stupperich, C., Garbe, H., Mihalachi, M., and Sandmann, S.: WERAN: Interaction of Wind Turbines and Terrestrial Navigation/Radar Systems, Specialist Meeting: Electromagnetic Waves and Wind Turbines, Wachtberg, Germany, 2016b.
Schrader, T., Bredemeyer, J., Mihalachi, M., Ulm, D., and Kleine-Ostmann, T.: WERAN: Messung der Wechselwirkung von Windkraftanlagen mit terrestrischer Navigation/Radar, 303rd PTB Seminar, PTB-Seminar, Braunschweig, Germany, 1–28, https://doi.org/10.7795/810.20170703, 2017a.
Schrader, T., Bredemeyer, J., Stupperich, C., Garbe, H., Mihalachi, M., Ulm, D., and Sandmann, S.: Interaction of Wind Tur, Specialist Meeting: Electromagnetic Waves and Wind Turbines, Braunschweig, Germany, https://doi.org/10.7795/810.20180227, 2017b.
Schrader, T., Bredemeyer, J., Mihalachi, M., and Kleine-Ostmann, T.: Measuring the Interaction of Wind Turbines with Terrestrial Navigation and Radar Systems Deploying UAS, 11th European Conference on Antennas and Propagation (EUCAP), 45 Paris, France, 2017c.
Schrader, T., Bredemeyer, J., Mihalachi, M., and Kleine-Ostmann, T.: Precision Signal-in-space Measurements of terrestrial Navigation Systems using Multicopter, Specialist Meeting: Electromagnetic Waves and Wind Turbines, Delft, the Netherlands, 1–23, 2018.