 | 19 Sep 2019
Results from the national intercomparison for rise time and bandwidth measurements within the German Calibration Service (Deutscher Kalibrierdienst – DKD)
Kai Baaske
Thomas Kleine-Ostmann
Thorsten Schrader
An intercomparison in the framework of the German Calibration Service (Deutscher Kalibrierdienst – DKD) was carried out. Two different travelling standards were used to measure the 10 % to 90 % rise time of a pulse generator and the 10 % to 90 % rise time, −3 dB bandwidth and attenuation at 500 MHz of an oscilloscope. Fourteen participants performed the measurements from September 2015 until May 2016.
- Article
(956 KB) - Full-text XML
- BibTeX
- EndNote


In communications industry, measurement devices for high speed digital signals are a key equipment. The temporal measurement of these time traces requires calibrated oscilloscopes as well as pulse generators as sources. One key parameter of these devices is the bandwidth and the corresponding 10 % to 90 % rise time. It is obvious that a full knowledge of the transfer function of these devices is preferable, but that calibration procedure is more demanding. Therefore, in an industrial context, the single parameter rise time (or bandwidth) is commonly used. Nonetheless, both parameters have to be measured traceable to the International System of Units (SI) with a measurement uncertainty which is derived according to the rules of the Guide to the expression of uncertainty in measurement (GUM, 2008).
Due to the importance of these temporal parameters an intercomparison in the framework of the German Calibration Service (Deutscher Kalibrierdienst – DKD) was organised by the German National Metrology Institute, Physikalisch-Technische Bundesanstalt (PTB), and 13 laboratories accredited for rise time measurements by the German Accreditation Service (Deutsche Akkreditierungsstelle – DAkkS) took part.
At the 40th annual meeting of the DKD technical committee “High Frequency and Optics” on 30 April 2015 a decision was made to carry out a national intercomparison between September 2015 and May 2016 organised by PTB.
2.1 Participants
PTB and 13 accredited laboratories participated in the intercomparison: Kalibriercentrum Bayern in Egmanting, GfM Gesellschaft für Metrologie mbH in Ottobrunn, esz AG in Eichenau, Rohde & Schwarz Messgerätebau GmbH in Memmingen, Testo Industrial Services GmbH in Kirchzarten, Trescal GmbH in Darmstadt, Rohde & Schwarz GmbH & Co. KG in Köln, Tektronix GmbH in Köln, 1A Cal GmbH – Gesellschaft für Metrologie in Kassel, DB Systemtechnik GmbH Kalibrier und Prüfstelle in Chemnitz, Atlas Copco Tools Central Europe GmbH in Kiel, Kalibrierzentrum der Bundeswehr in Kiel and Atlas Copco Tools Central Europe GmbH in Wetzlar. The order of the participants is not linked to the numbering in the results section to ensure anonymity.
2.2 Travelling standards

For the intercomparison two different travelling standards were used:
A pulse generator from Picosecond Pulse Labs PSPL 4015C with a remote pulse head 4015 RPH with a nominal 10 %–90 % rise time of 15 ps. For those participants who cannot measure such short pulses a low-pass risetime filter PSPL 5910-350 with a nominal rise time of 350 ps from the same company was provided.
The second standard was a Rohde & Schwarz R & S RTE1052 oscilloscope with a nominal −3 dB bandwidth greater than 500 MHz and a rise time shorter than 700 ps, respectively. For this device the measurands 10 %–90 % rise time, −3 dB bandwidth and attenuation at 500 MHz compared to the attenuation at a reference frequency of 10 MHz had to be measured.
2.3 Measurands
The measurement procedures for the measurands rise time and bandwidth are based on the technical guideline VDI/VDE/DGQ/DKD 2622 Blatt 4, Kalibrieren von Messmitteln für elektrische Größen – Oszilloskope (VDI, 2014).
2.4 Data evaluation
The EN value (DIN EN ISO/IEC 17043, 2010) is a figure of merit for the concordance of two calibration results within their measurement uncertainties. It is applied as well in intercomparisons conducted by the EA (European Cooperation for Accreditation) and shall be calculated as follows:
with KLab the measured value of the laboratory, KRef the reference value of PTB, U(KLab) the expanded measurement uncertainty of the calibration factor of the laboratory and U(KRef) the expanded measurement uncertainty of the calibration factor of PTB.
Achieving a result of the EN value of demonstrates that the laboratory has measured correctly specifying a realistic measurement uncertainty and both results can be considered as equivalent. An EN=0 means a perfect match of the measured value of the laboratory with the reference value in consideration of their uncertainties.
The reference value was calculated from the arithmetic mean of three measurements from PTB. These measurements took place at the beginning, in the middle and at the end of the intercomparison. As expanded measurement uncertainty of the reference value the lowest uncertainty of all three measurements was taken due to correlations in the consecutive measurements.
For the measurands −3 dB bandwidth and attenuation at 500 MHz none of the measurement values of the participants including PTB were appropriate to use as a reference value. Therefore, the data evaluation was carried out with the approach of using a Comparison Reference Value (CRV) and evaluating the results by using a Degree of Equivalence (DoE) to the CRV (Cox, 2002).
These factors were calculated as:
with
The results ki of each laboratory i are weighted with their declared measurement uncertainty to obtain a reference value with attached uncertainty.
The Degree of Equivalence with related uncertainty denotes the conformance of each laboratory with the CRV:
In the following section the results for the different measurands are presented.
3.1 Stability of the standards
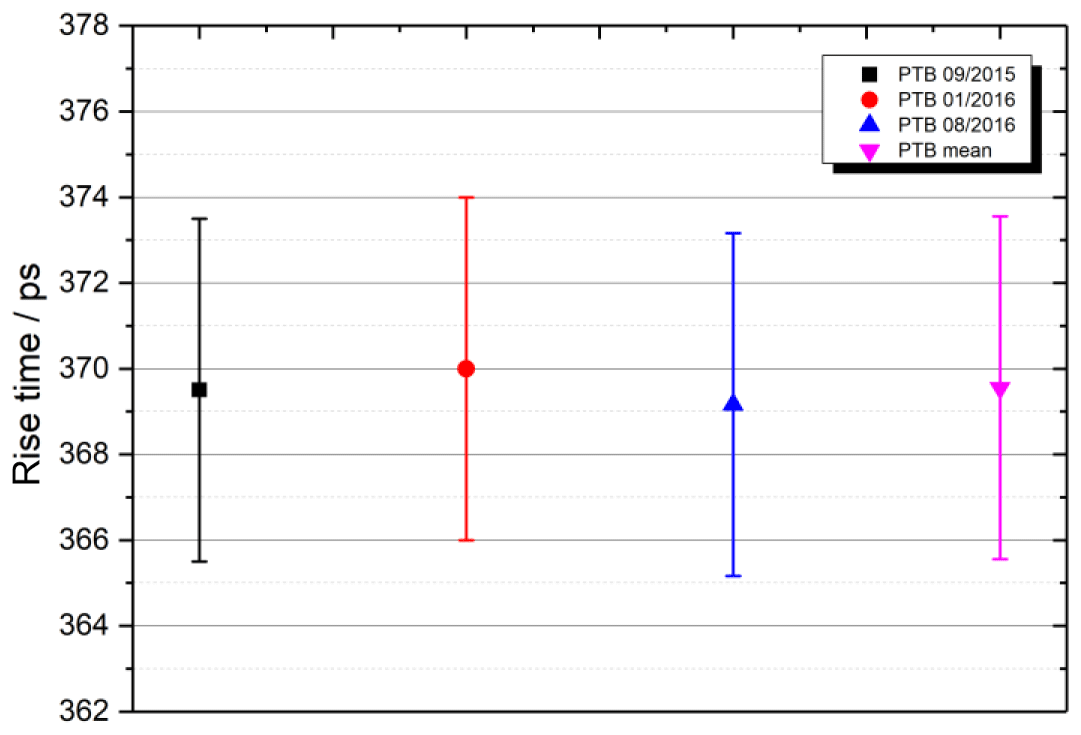
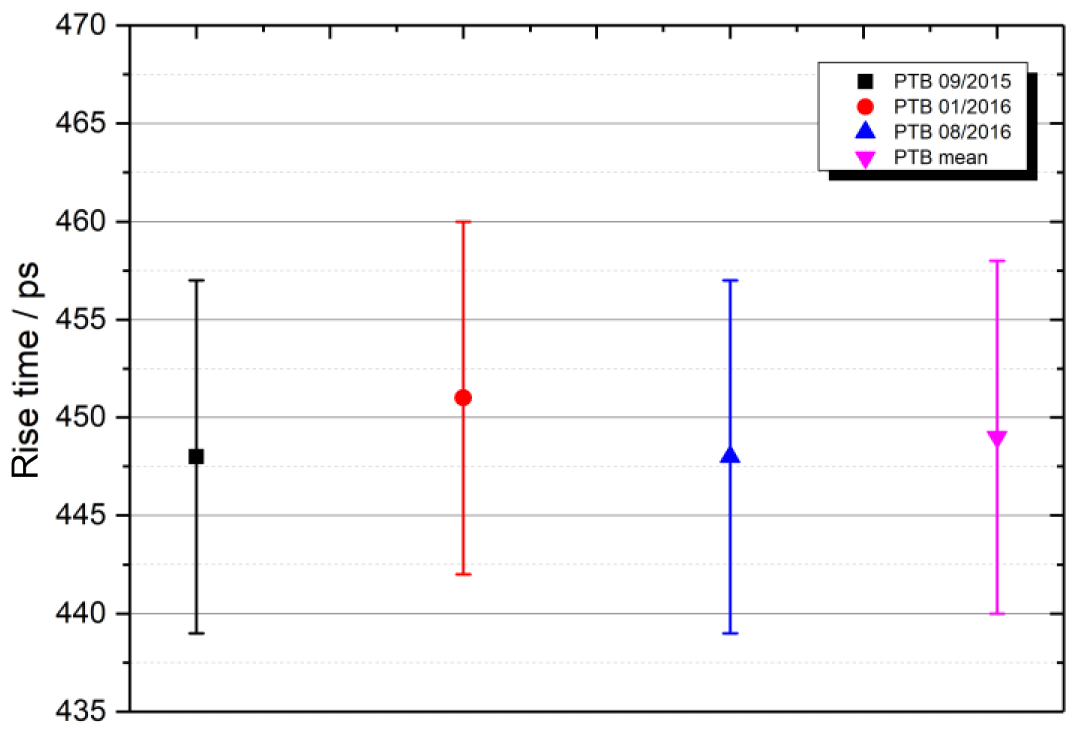
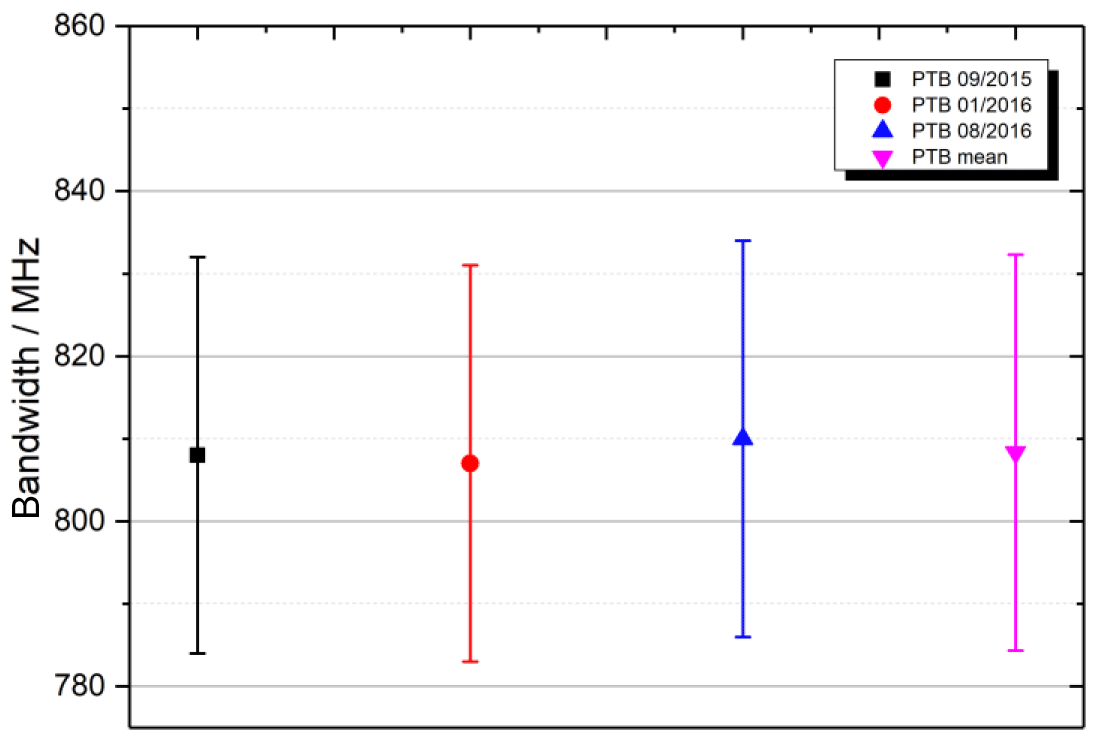
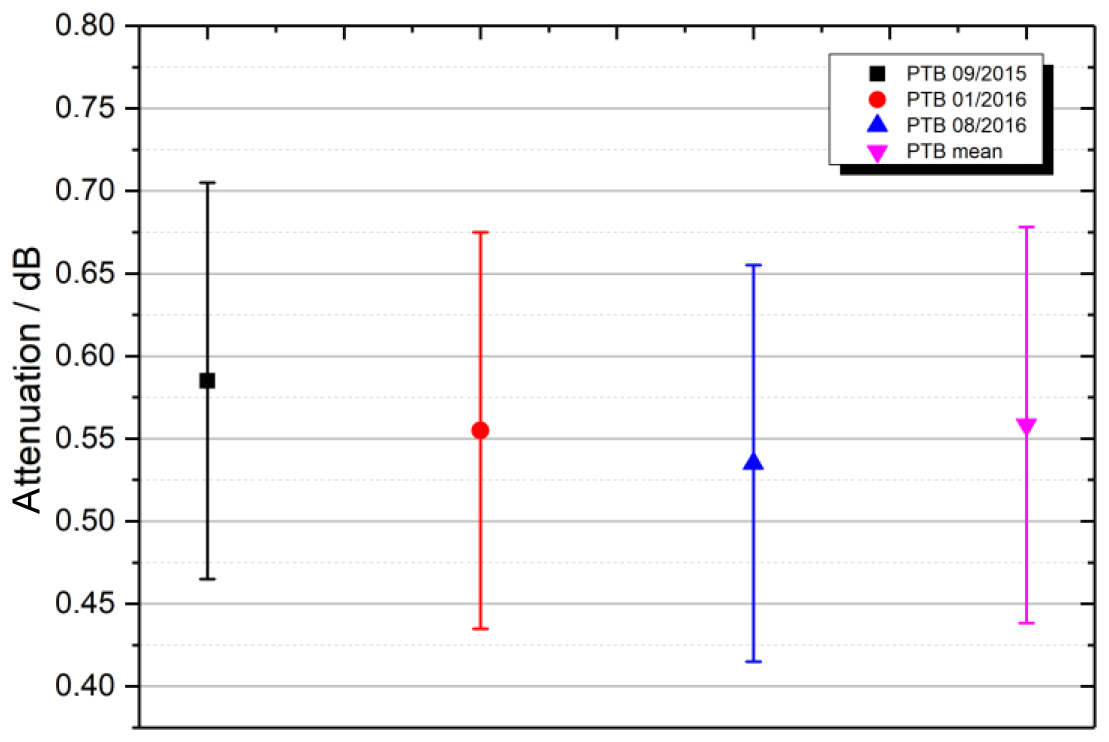
Both travelling standards are measured at PTB at the beginning, midterm and at the end of the intercomparison to evaluate the stability of the standards. In Figs. 1 to 5 the results of the stability measurements are shown. They demonstrate that the variation of the characteristic values of the standards were sufficiently small.
3.2 Rise time of the pulse generator
Figures 6 and 7 show the PSPL 4015C pulse generator rise time measurements. The short rise times were measured by seven of the 14 participants and only one laboratory reported a too short rise time corresponding to an EN value greater than one. Ten laboratories measured the longer rise times applying the additional low pass filter. In this case three laboratories exceeded the EN=1 limit.
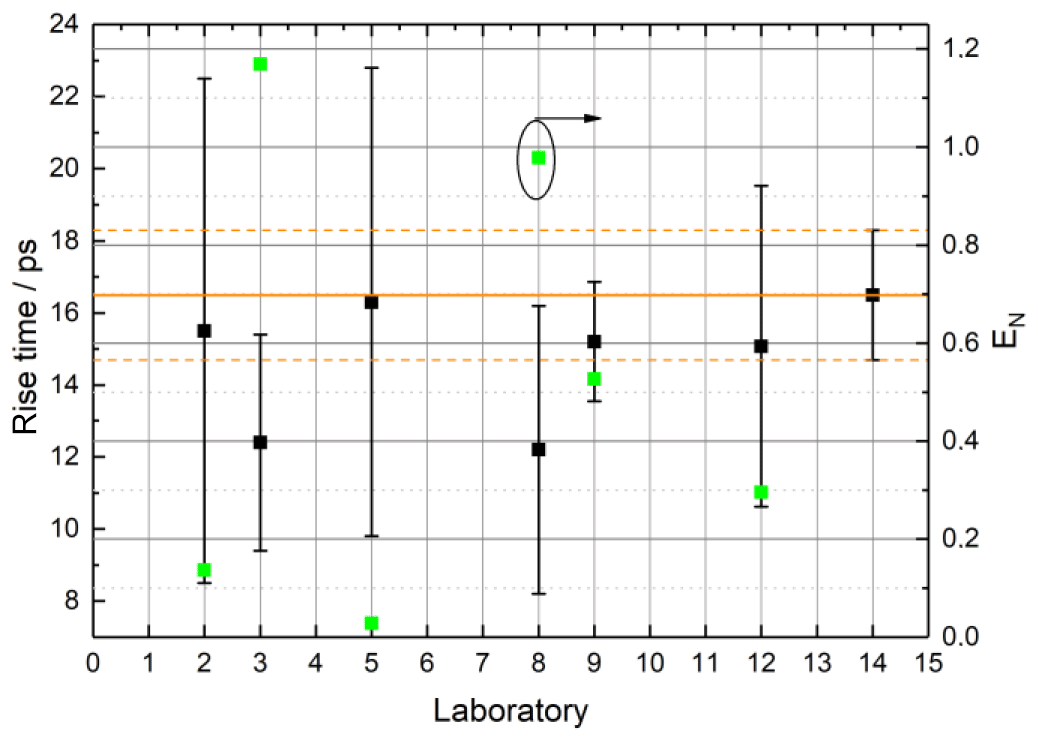
Figure 6Results of the laboratories measuring the rise time of the PSPL 4015C. The solid orange line indicates the reference value whereas the dashed lines indicate the corresponding expanded uncertainty. The green squares plotted the calculated EN values which is indicated by the ellipse with arrow as guidance.
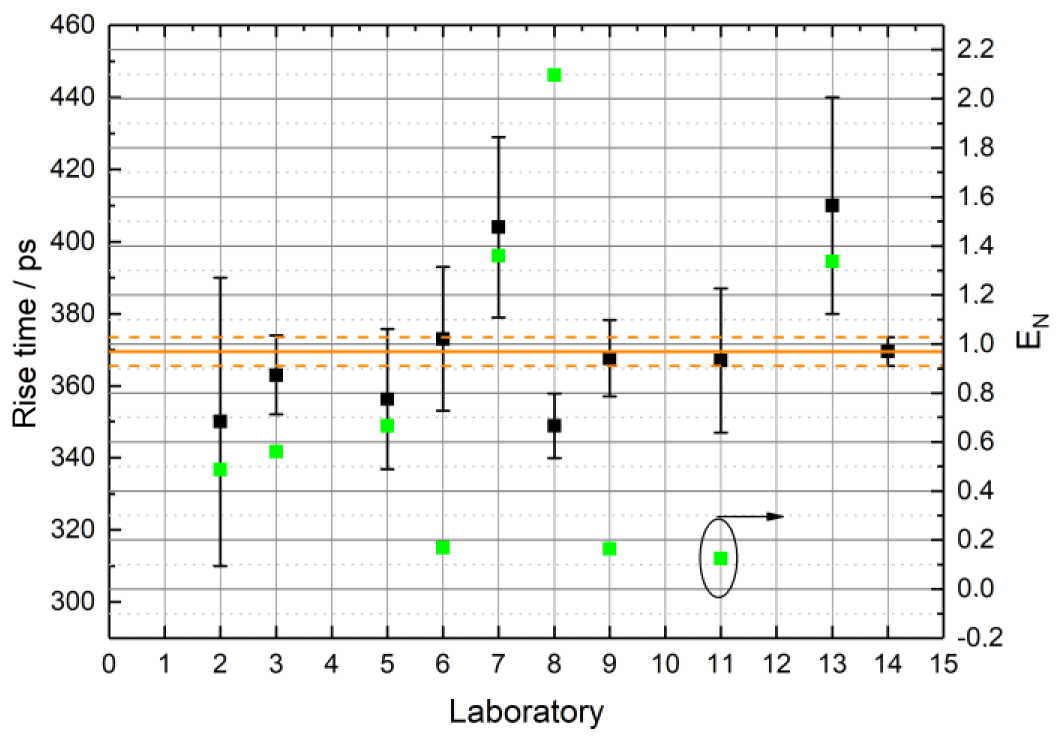
Figure 7Results of the laboratories measuring the rise time of the PSPL 4015C with connected low pass rise time filter. The solid orange line indicates the reference value whereas the dashed lines indicate the corresponding expanded uncertainty. The green squares plotted the calculated EN values which is indicated by the ellipse with arrow as guidance.
3.3 Rise time of the oscilloscope
Figure 8 shows the results for the rise time measurements of the RTE 1052 oscilloscope. All participants conducted this measurement with good agreement to the reference value. Only one laboratory measured a significantly different rise time which was explained afterwards by an error during the measurement procedure.
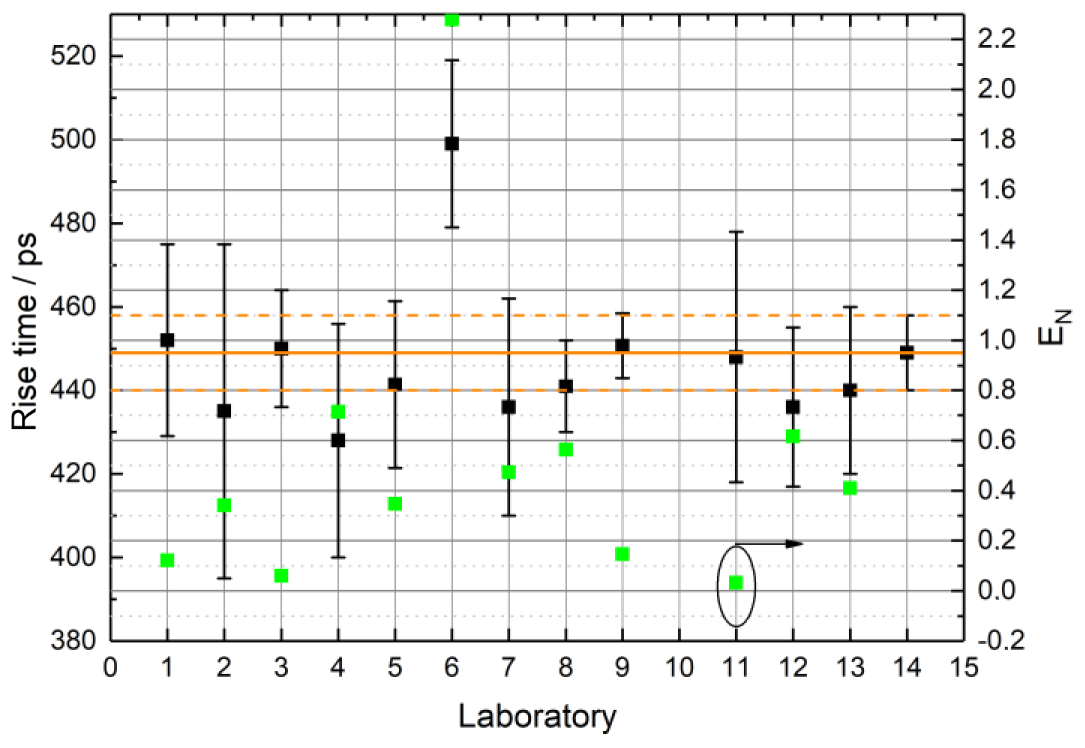
Figure 8Results of the laboratories measuring the rise time of the RTE 1052 oscilloscope. The solid orange line indicates the reference value whereas the dashed lines indicate the corresponding expanded uncertainty. The green squares plotted the calculated EN values which is indicated by the ellipse with arrow as guidance.
3.4 Bandwidth of the oscilloscope
Figure 9 shows the Degree of Equivalence for the −3 dB bandwidth measurements of the RTE 1052 oscilloscope. All participants except one conducted this measurement with good agreement to the reference value. Only one laboratory reported no result.
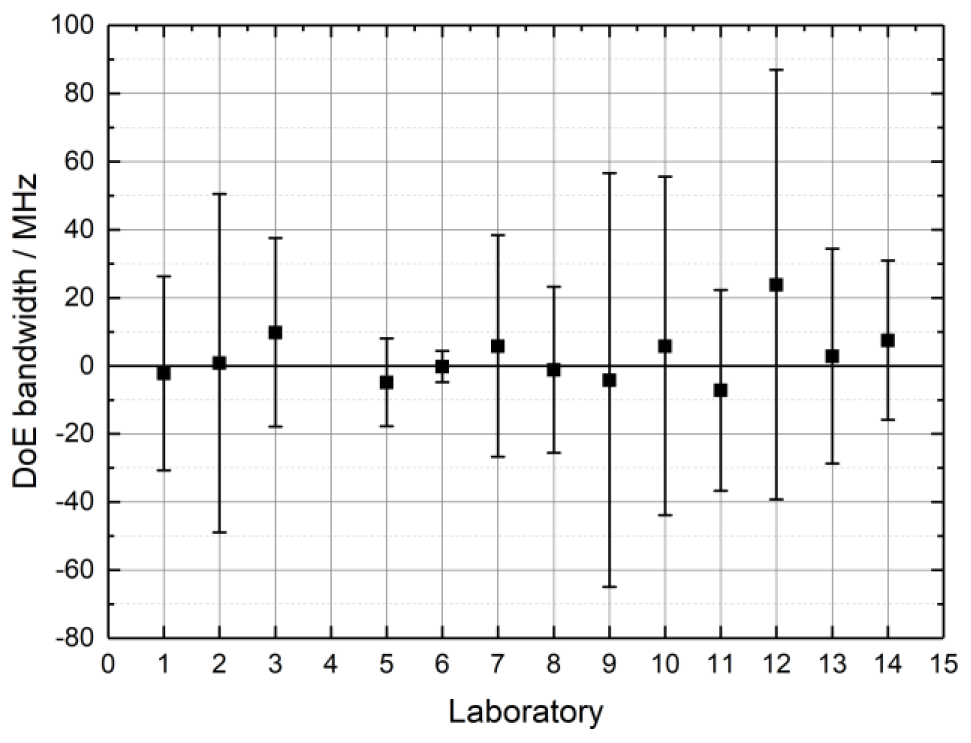
Figure 9DoE results of the laboratories measuring the −3 dB bandwidth of the RTE 1052 oscilloscope.
3.5 Attenuation at 500 MHz of the oscilloscope
Figure 10 shows the Degree of Equivalence for the attenuation measurements of the RTE 1052 oscilloscope. In this case the attenuation at 500 MHz related to the attenuation at 10 MHz (reference frequency) was measured.
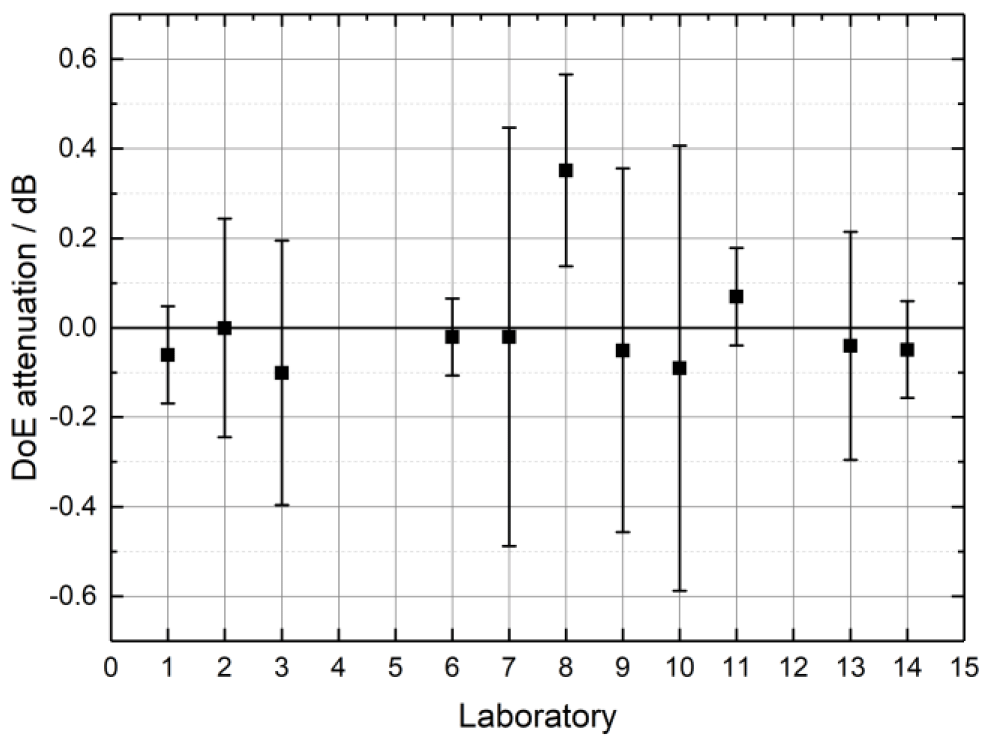
Figure 10DoE results of the laboratories measuring the attenuation at 500 MHz of the RTE 1052 oscilloscope.
11 participants except one conducted this measurement with good agreement to the reference value. Only one laboratory exceeded the limit because the error bar was not overlapping with the solid DoE line. One laboratory reported no result.
The overall results of the national intercomparison show that the measurements of the participating laboratories are in good agreement with the reference values. The bandwidth was measured correctly by every laboratory which reported results. At the other measurands at least one laboratory exceeds the EN or DoE respectively.
In a few cases the non-conformity with the limits are significant. Therefore, the concerned laboratories shall verify their uncertainty budgets and recheck their measurement procedures.
The underlying data sets are property of the participating laboratories and are not made available to the public.
The authors declare that they have no conflict of interest.
The autors thank all participating laboratories for providing the data.
This paper was edited by Michael Vogt and reviewed by Reinhard Stolle, Bianca Will, and one anonymous referee.
Cox, M. G.: The evaluation of key comparison data, Metrologia, 39, 589–595, 2002.
DIN EN ISO/IEC 17043: Konformitätsbewertung – Allgemeine Anforderungen an Eignungsprüfungen, Deutsche Institut für Normung e.V. (DIN), Berlin, 2010.
GUM: Evaluation of measurement data – Guide to the expression of uncertainty in measurement, GUM 1995 (with minor correc-tions), JCGM 100, 2008.
VDI: VDI/VDE/DGQ/DKD 2622 Blatt 4: Kalibrieren von Messmitteln für elektrische Größen – Oszilloskope, Verein Deutscher Ingenieure, Düsseldorf, May 2014.