 | 10 Dec 2020
Respiration parameter determination with non-obstructive methods
Christian Siebauer
Jan Ringkamp
Kirsten J. Dehning
Stefan Zimmermann
Jens Langejürgen
Measuring respiratory parameters like the breathing frequency or the tidal volume is essential in intensive care to ensure an optimal and lung protecting ventilation. A common practice in artificial ventilation of sensitive patients like infants or neonates is the use of uncuffed endotracheal tubes in combination with continuous positive airway pressure (CPAP). This comes with the disadvantage of an unknown leakage making it difficult to detect spontaneous breathing or to measure the tidal volume reliable. A novel non-obstructive method to determine respiratory parameters as well as dynamic changes of thoracic parameters has recently been presented and uses a pair of coupled UHF (ultra high frequency) antennae. In this paper, a respective setup is investigated numerically using finite difference time domain method and experimentally using an artificial lung phantom. Both approaches show that the investigated method seems capable of allowing a contactless triggering to synchronize natural and artificial breathing. The results are compared to derive a better understanding of influencing factors and opportunities for an optimisation.
- Article
(944 KB) - Full-text XML
- BibTeX
- EndNote


Medical respirators have become an integral part of nowadays intensive care. In order to ensure an optimal ventilation that is lung protecting, essential respiratory parameters like the breathing frequency or the tidal volume have to be monitored reliably and continuously. The parameters are of significant importance for controlling the respirator with respect to a correct pressure and tidal volumes. Additionally, the detection and support of a spontaneous inhalation is crucial – especially for sensitive patients like infants or neonates. Due to their low tidal volumes, their relative high breathing frequency and their sensitive skin, a precise measurement of essential respiratory parameters is technically challenging, which leads to a reduced control quality of the respiration parameters. The use of continuous positive airway pressure (CPAP) together with uncuffed endotracheal tubes is a common practice in artificial ventilation of premature infants in order to prevent the development of respirator induced lung injuries, like volu- or barotrauma (Mahmoud et al., 2015). The disadvantage of this practice is an unknown time-varying leakage which makes a detection of spontaneous breathing or the measurement of tidal volume very difficult. Besides flow and pressure monitoring, other measurement methods like electrical impedance tomography (EIT) are also inadequate since they require electrodes connected to the sensitive skin or are of obstructive nature.
A promising approach to overcome the most important technical burdens of measuring the respiratory parameters are electromagnetic modalities, because they are leakage independent and unobtrusive. There are approaches measuring the dielectrical changes of the thorax by capacitive means (Teichmann et al., 2013; Kundu and Kumagai, 2013; Oum et al., 2008) or measuring induced currents in the thorax by inductive means (Teichmann et al., 2013, 2015). Another approach is using radar-based methods were the displacement of the chest due to respiration is measured either via ultra wide-band radar or continuous wave radar (Leonhardt et al., 2018). In contrast to radar, which measures reflection of the chest wall, recently a novel setup to measure the transmission through the thorax was presented (Ringkamp et al., 2020). With this setup dynamic changes of thoracic parameters due to breathing are determined with a pair of coupled UHF (ultra high frequency) antennae. This setup seems to be well suited for contactless triggering to synchronize natural and artificial breathing, especially in case of infants and neonates.
In this contribution, the electromagnetic aspects of this approach are investigated in numerical and metrological manner. The aim of the numerical field calculations is to get further insight into the influencing factors of this setup. The pair of coupled antennae operates in the UHF band, which covers the frequency range from 300 MHz to 3 GHz or the wavelength range from 1 m to 100 mm respectively (Meinke and Gundlach, 1992). While the distance dant=90 mm between the two antennae seems to be comparably small regarding the wavelength λ, it can be assumed that the receiving antenna is not placed in far field region, but in the radiating nearfield, the so-called Fresnel Region (Balanis, 2016). Thus, a numerical model based on field calculations is necessary. This model is underpinned with a defined experimental setup consisting of a ventilated thorax phantom and a set of antennae. Special attention is paid to the coupling between the antennae as well as to the resonance behaviour of the coupled antenna pair with respect to the change of air volume in a lung phantom.
2.1 UHF antenna approach
In this contribution, the physics of measuring respiratory parameters with a pair of coupled UHF antennae is investigated with numerical methods. This is necessary to get further insight into the wave propagation and occurring effects. Typically, the receiving antenna of a wireless transmission system is placed in the far field region of the transmitting antenna, where the radiated electromagnetic (EM) field propagates as a transversal electromagnetic (TEM) wave. This means, that the propagating wave has got only transverse field components (perpendicularly orientated to the propagation direction), but no field component in propagation direction. Furthermore, the electric field E and the magnetic field H are also orientated perpendicular to each other. The free space wave impedance
is a constant value in the far field region (Schelkunoff, 1938) and the Poyting vector
has got only a component in propagation direction, since both, the electric and the magnetic field strength have none in propagation direction.
In a first step, we will investigate whether the receiving antenna is placed in the reactive near field region (Rayleigh region), the radiating near field region (Fresnel region) or the far field region (Fraunhofer region). Different definitions for the boundaries of the regions could be found in literature, which have in common that the largest dimension of the antenna Dmax and the operating frequency f or the corresponding wavelength λ have to be taken into consideration, respectively. The IEEE standard definition of the antenna regions defines the reactive near field region in a distance smaller than λ∕2π and the far field region in a distance greater than (IEEE Standard #145, 1969), whereas Balanis mentioned 0.62 and for the distances of the antenna regions (Balanis, 2016). Nevertheless, these definitions are only valid for an antenna that is large compared to the wavelength (Dmax>λ).
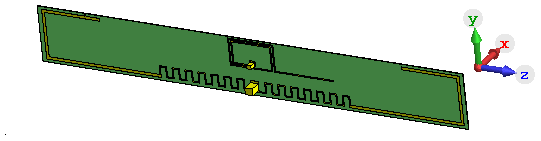
Figure 1Simulation model of the used UHF antenna: The planar antenna is realized as a slightly meandered dipole on a flexible PCB with the physical dimensions 79 mm × 10 mm, specified for ISM applications in the frequency range of from 863 to 870 and 902 to 928 MHz.
In our approach, we use two identical UHF antennae models based on a commercially available meandered dipole antenna on printed circuit board (PCB) with a physical length of 79 mm and a width of 10 mm. The chosen antenna is designed and specified for the transmission in the frequency range of from 863 to 928 MHz. This antenna type forms an electrical small radiator, since its largest dimension Dmax=79 mm is significantly smaller than the corresponding wavelength λ, which covers a range from 347.4 to 323.7 mm. Balanis defines a distance of as the boundary of the far field region in case of an electrical small radiator (Balanis, 2016), which leads to a minimal distance of 51.5 mm for far field region in case of the highest specified operating frequency of 928 MHz. The calculated distance to the far field region can be verified due to numerical field calculations. Therefore, the UHF antenna is placed in free space as illustrated in Fig. 1 and the radiated electromagnetic field is calculated in different observation points situated on a line parallel to the positive x-axis. Since the UHF antenna's dipole axis is orientated parallel to the z-axis, Ez is expected to be the dominant component in the far field region. Figure 2 shows the three components of the numerical calculated electric field vector E for a frequency of 900 MHz. Hereby, Ex represents the component in propagation direction, which should be as a rule of thumb 100 times or 40 dB smaller than the dominant transverse components Ez in far field region (Laybros and Combes, 2004). The simulations point out that Ex is the largest component for distances from 5 to 85 mm with respect to the antenna, thus it can be assumed that the minimal distance to the far field region is definitely underestimated and must be larger than 51.5 mm. Figure 3 presents the simulated electric field in an observation point located in a distance of 55 mm. The transverse component Ez becomes the major component in the frequency range above 1 GHz, which seem to be reasonable due to the decreasing wave length λ. Nevertheless, the 40 dB-criteria is not fulfilled, which means that neither the infant's thorax nor the receiving antenna are placed in the far field region of the transmitting antenna, especially if positioned in close vicinity to each other. This first investigation leads to the finding to carry out further numerical field calculations in order to understanding the physics of this setup better. Furthermore, not only the magnitude of the transfer function between both UHF antennae might be of interest for measuring the breathing parameter, but also the phase information, since both the transmitting and the receiving antennae will be detuned due to their mutual physical presence as well as the infant's thorax.

Figure 2Radiated electric field for 900 MHz: Ex denotes the component in propagation direction, whereas Ez is the transverse component orientated parallel to the dipole axis.
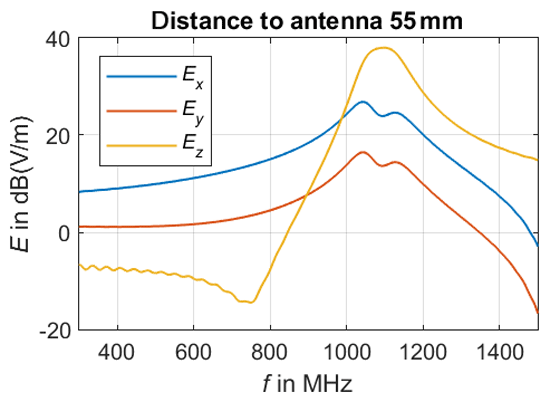
Figure 3Radiated electric field in a distance of 50 mm: Ex denotes the component in propagation direction, whereas Ez is the transverse component orientated parallel to the dipole axis.
2.2 Numerical Field Calculation
Numerical field calculations were carried out with a 3D electromagnetic simulation tool that is based on the finite difference time domain (FDTD) method (Troescher et al., 2004). Figure 4 illustrates the simulation model of the infant's thorax and the UHF antennae arrangement. As transmitting and receiving antennae serve the UHF antennae, which are also used in the real measurement setup and have been described more detailed in Sect. 2.1 already. Simple geometries have been chosen for modeling the infant's thorax and the lung. The simplified thorax and lung are modeled with only two compartments each with homogenous material distribution in accordance with the experimental lung phantom. The thorax is represented by a cuboid filled with water, which includes a second cuboid forming an air pocket as lung model. Both cuboids are rounded at their edges in order the reduce resonance effects. The lung's physical dimensions are varied during the simulation in order to model to dynamic changes of thoracic parameters due to breathing. The dimensions are listed in Table 1 and depend on the volume of the lung VLung given in the unit mL.
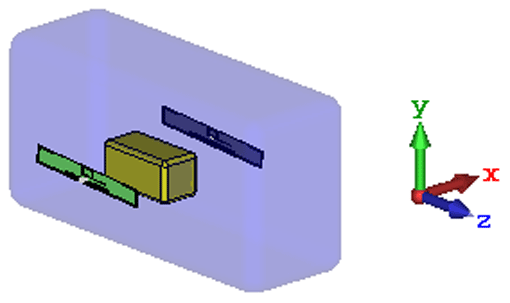
Figure 4Simulation model of the infant's thorax and the UHF antennae arrangement: The infant's thorax is modeled as a cuboid filled with water, which includes an air pocket representing the lung. The lung's physical dimensions are varied during the simulation in order to model to dynamic changes of thoracic parameters due to breathing.

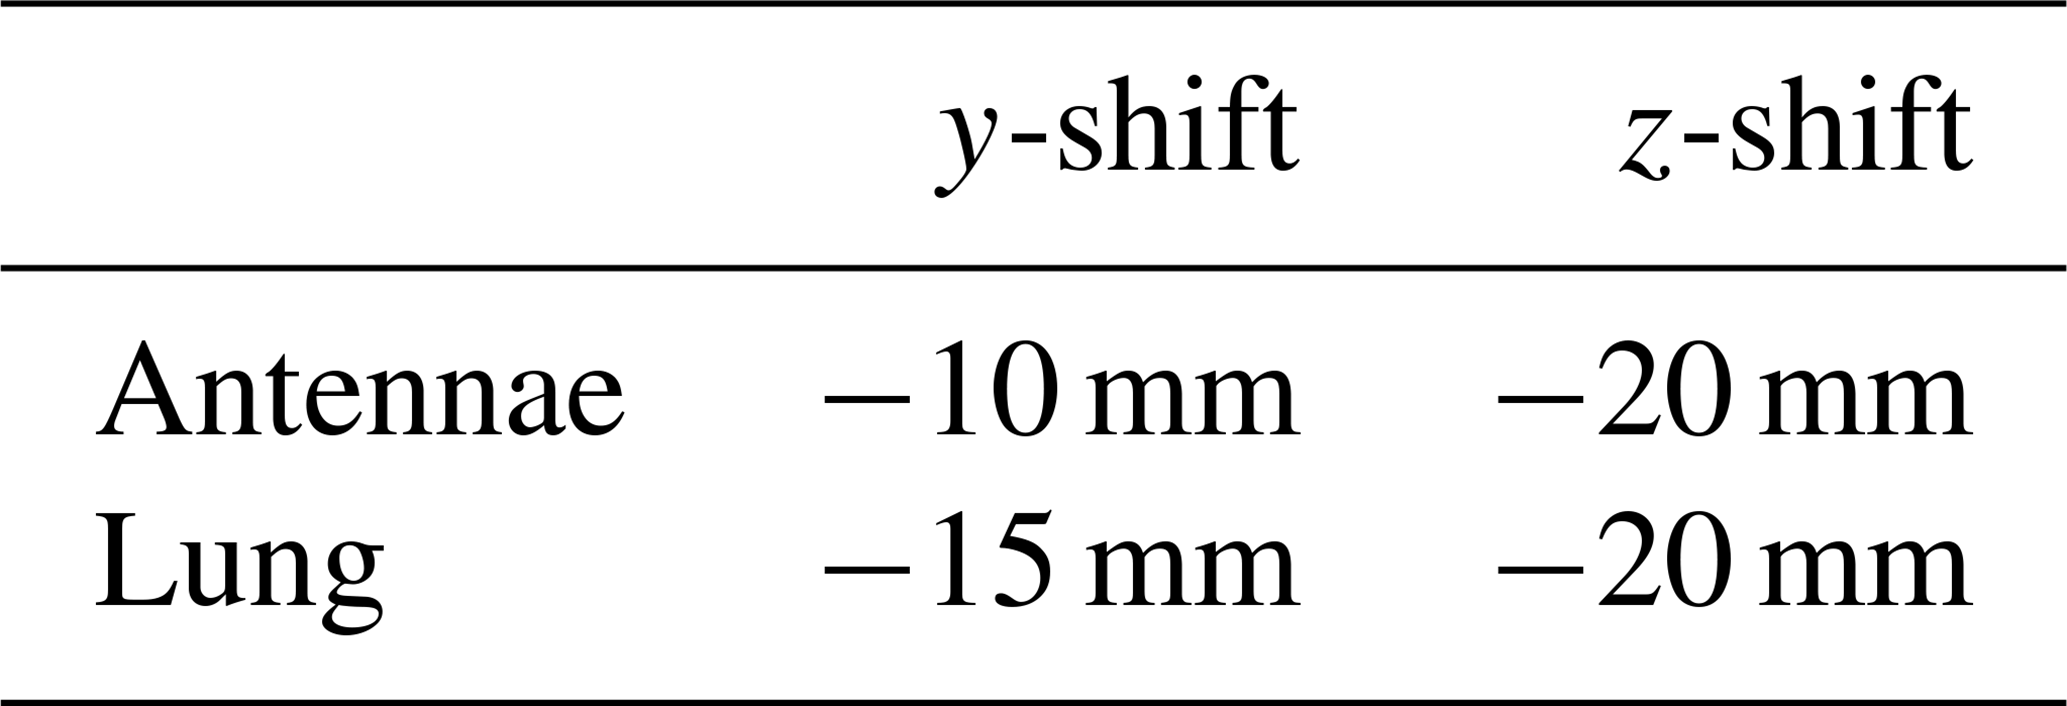
The antennae were placed at a distance of 10 mm from the thorax. Since a symmetrical simulation arrangement carries the risk of unwanted geometry-related interferences, the antennae and the lungs were shifted out of the symmetry axis of the thorax according to Table 2. In addition, the antennae were tilted slightly by 3∘.
In the simulation model, the thorax is modeled as a water filled cuboid with a relative permittivity of er=78 and an electrical conductivity of . An air pocket serves as lung. The simulations were carried out with the transient solver in the frequency range from 300 to 1500 MHz.
2.3 Experimental Setup
We developed a dynamic artificial lung phantom in order to provide reproducible conditions for an experimental validation of the simulation as described in a previous publication (Ringkamp et al., 2020). The dimensions are chosen to model an infant's lung within the thorax. The outer dimensions of the phantom are 135 mm × 76 mm × 65 mm with a wall thickness of 2.4 mm. The dynamic respiration process is modelled with a 3D printed artificial lung that consists of two compartments separated by an elastic diaphragm. Filling the artificial lung with air, the volume ratio of the two compartment changes, which influences the transmission path between the antennae.
An elastic diaphragm separates the two compartments. The lower compartment contains water to simulate the electrical properties of an infant's thoracic tissue and a balloon. The antennae are mounted in 10 mm distance to the lower compartment filled with water. Figure 5 contains a technical drawing of the setup. The inflatable balloon inside the water compartment serves as artificial lung. The phantom was mounted in an upright position to centre the balloon by buoyancy. The balloon was filled from approximately 2 mL up to approximately 22 mL in 5 mL steps using a plastic syringe.
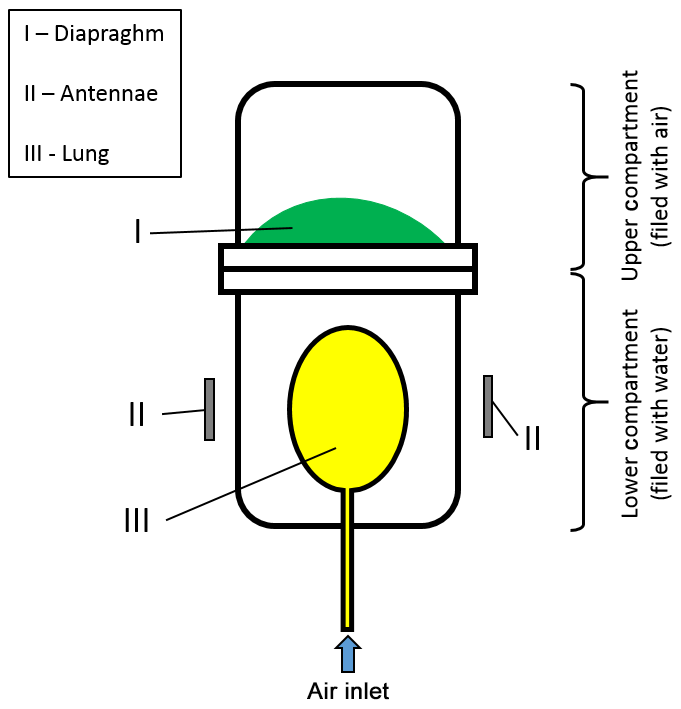
Figure 5Technical drawing of the used lung phantom. The phantom consists of two plastic compartments. The lower compartment is filled with water to model the electric properties of thoracic tissue. The upper compartment is filled with air and in this work serves no special purpose. An elastic diaphragm (I) separates the two compartments. The antennae (II) are mounted at a distance of 1 cm next to the lower compartment. A balloon (III) inside the lower compartment serves as artificial lung. By inflating the balloon the diaphragm dilates and is pushed in the upper compartment.
The antennae system consists of two identical UHF antennae strips (meandered dipole on flexible PCB with 79 mm × 11 mm). Scattering parameters S11 and S21 of the antennae system are measured using a vector network analyser (PicoVNA 106, Pico Technology). Two 1 m long U.FL cables connected the antennae to the vector network analyser. The setup was calibrated by using two U.FL cable of the same length and type to compensate the attenuation and phase delay caused by the cables.
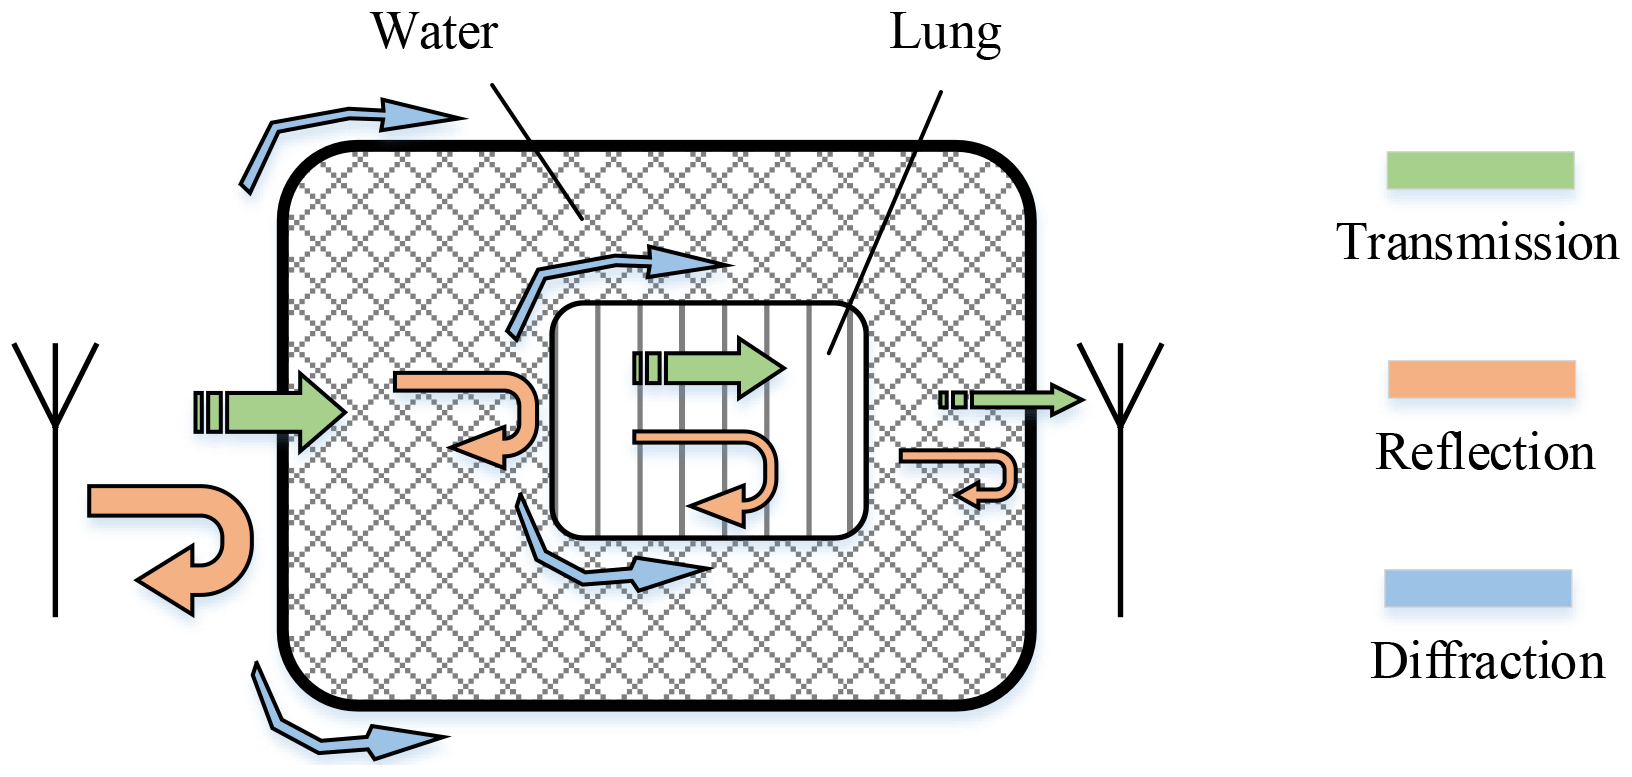
We evaluated the simulation by comparing trends in the magnitude of the scattering parameters S11 and S21 derived from the simulation and the experiment, which represent the input reflection coefficient of the transmitting antenna and the transmission function between both antennae. The air volume in both modalities was varied beginning from a start volume V0 (in the case of the experiment the start volume is unknown, in the simulation V0=20 mL). The simulation for V0+10 mL did not converge and is therefore excluded from the further examination. Figure 6 illustrates the electric field strength distribution in the x-z-plane calculated numerical for a 900 MHz continuous wave (CW) excitation signal. The antennae are located at the two horizontal lines, whereas the other black lines indicate the boundaries of the thorax and the lung. In the close vicinity of the transmitting antenna, large field strength values arise. It points out that the electric field propagates on different paths from one antenna to the other. The first path is the direct transmission through the thorax and lungs on the shortest route. In the second path, the electric field propagates into the thorax and diffracts around the lungs, illustrated as grey arrows in Fig. 6. On the third path, the propagation wave does not penetrate, but diffracts around the thorax like a surface wave. The field distribution shown in Fig. 7 delivers comparable results in the x-y-plane. Here, the three propagation paths can be recognized as well. A principle diagram of the different transmission mechanisms within and outside the thorax is shown in Fig. 8.
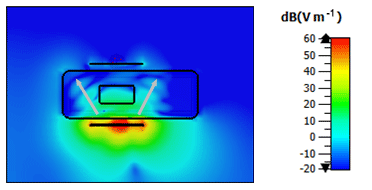
Figure 6Electric field strength distribution x-z-plane: The black lines show the boundaries of the antennae and the thorax model with the lung. The white arrows illustrate the wave propagation from the transmitting antenna to the receiving antenna when excited with a 900 MHz CW signal.
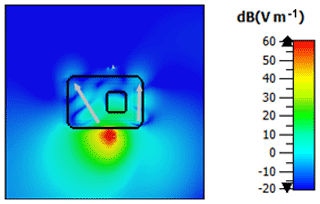
Figure 7Electric field strength distribution x-y-plane: The black lines show the boundaries the thorax model with the lung. The dipole axes of the antennae are orientated perpendicular to the cutting plan, at which the transmitting antenna is located in the red colored region. The white arrows illustrate the wave propagation from the transmitting antenna to the receiving antenna when excited with a 900 MHz CW signal.
When comparing the magnitude of the transmission factor between the antennae S21, it is visible that the passband frequency and the maximum differ in the experiment and the simulation, see Fig. 9. The simulation tends to have a lower passband edge roughly 2 MHz higher and a passband roughly 30 dB lower. Furthermore, the passband in the simulation tends to be broader. However, simulation and experiment both show an erratic behaviour concerning the dependence on the air volume. There is no clear trend whether the overall magnitude increases or decrease by increasing the air volume.
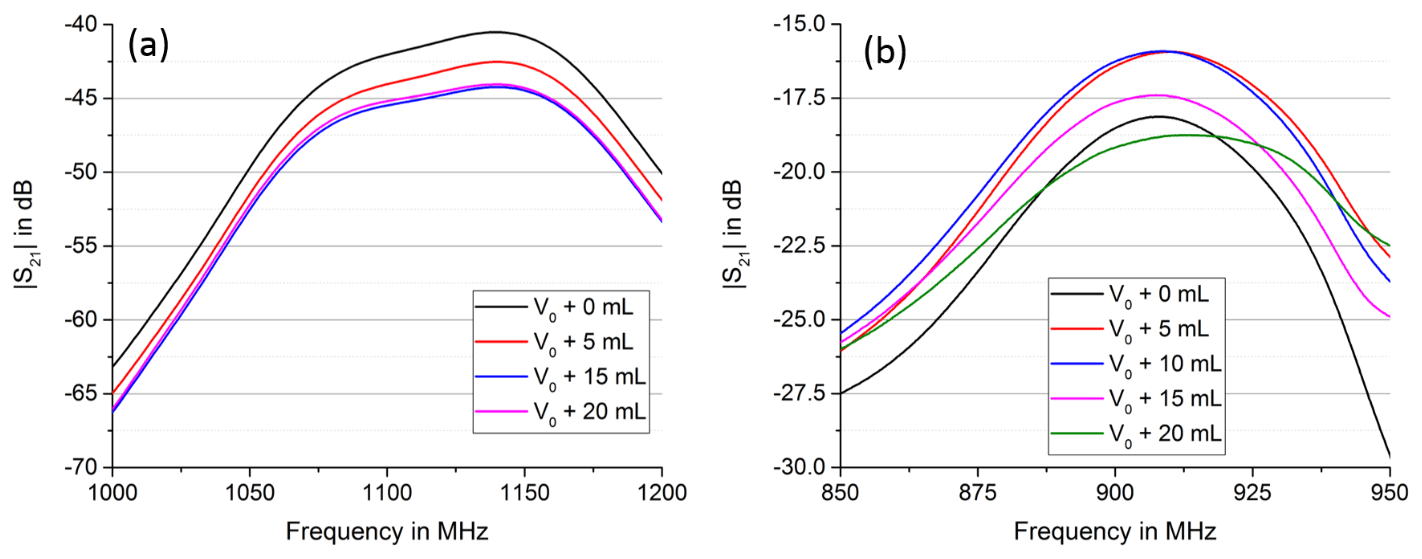
Figure 9Comparison of simulation (a) and experiment (b), magnitude S21. Simulation and experiment both show an erratic behavior concerning the trend of the maximum. Depending on the current volume, a further increase in volume can lead to a global increase of S21 or a global decrease.
Figure 10 shows the input reflexion S11 of the transmitting antennae, which has two volume dependent resonances in simulation and experiment. The behaviour of the volume dependent resonance is the same in simulation and experiment, even though the simulated volume dependent resonance frequencies are approx. 160 MHz higher than the measured ones. The resonance at the lower frequency decreases in magnitude with an increase in volume, while the resonance at the higher frequency increases in magnitude with increase in air volume. S11 in the experiment shows a much stronger resonance leading to a better load matching of the antenna. This most likely causes the 30 dB increase of the experiments passband in S21.
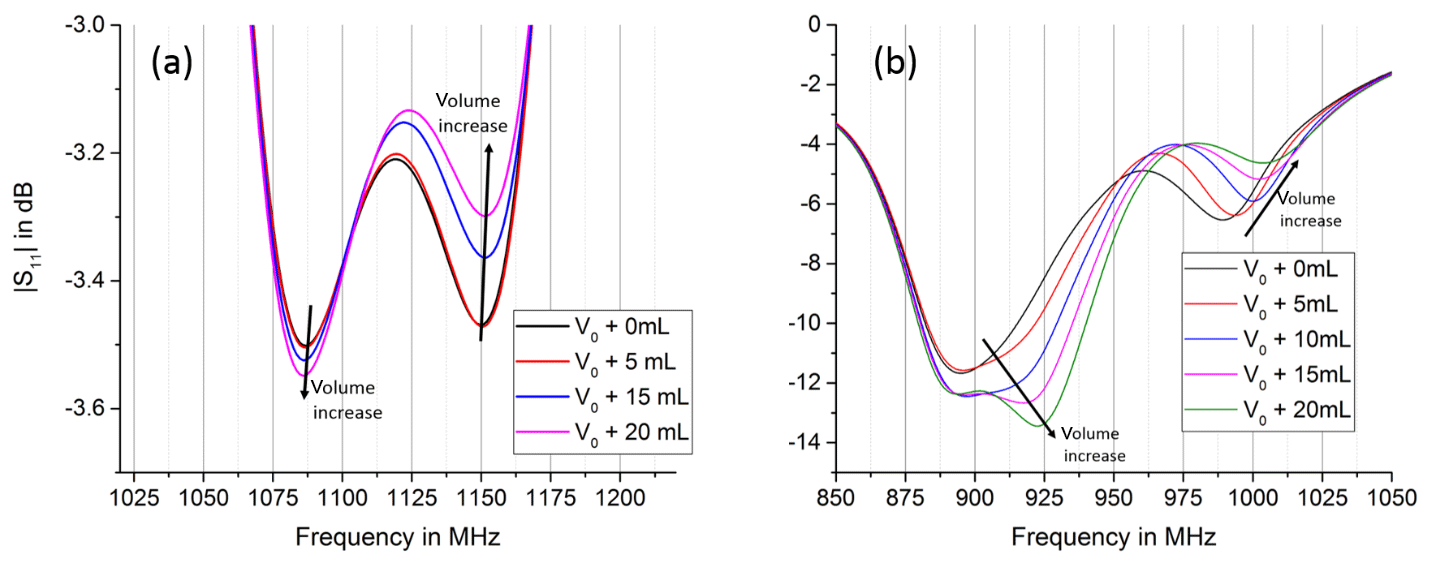
Figure 10Comparison of simulation (a) and experiment (b), magnitude S11. Simulation and experiment show two volume dependent resonances, which show the same trend in simulation and experiment. The resonance at lower frequencies decreases with an increase in volume, while the resonance at higher frequencies increases.
The two volume dependent resonances in the experiment tend to shift more in frequency compared to the simulation and differ also much more in magnitude. This leads to a second passband at slightly higher frequencies in the experiment, which is not present in the simulation. The second passband shifts with an increase in volume to even higher frequency but decreases in magnitude; see Fig. 11.
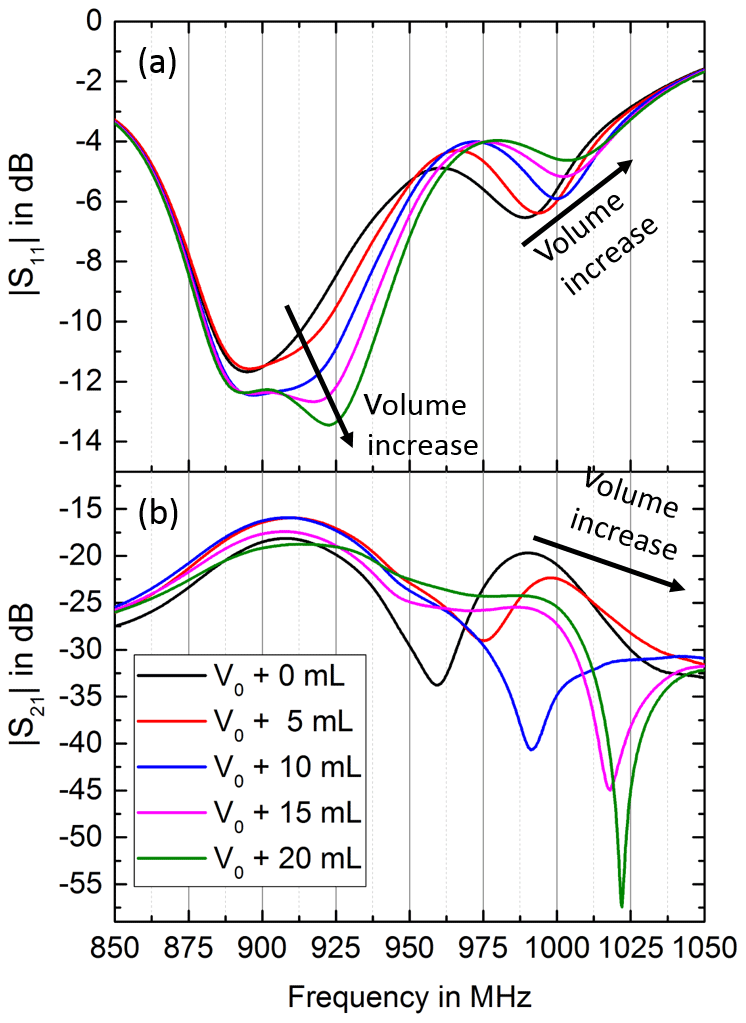
Figure 11Comparison of the magnitude responses of S11 (a) and S21 (b) in the experiment for varying air volumes. The volume dependent resonance at the higher frequency in S11 leads to a second volume dependent passband in S21, which shifts to higher frequencies with increase in air volume but decreases in magnitude.
In this contribution, we investigated a measuring principle for contactless respiratory parameters determination, which uses a pair of coupled UHF antennae. Therefore, we carried out numerical field calculations with a simplified thorax model as well as experiments by means of a 3D-printed thorax phantom. The investigations point out that the transfer function between the UHF antennae is influenced by the dynamic change of the lung volume. Both, simulation and experimental results show similar resonances in S11 and S21 as well as trends in these parameters with a change in air volume within the lung. Differences in the simulated and measured S11 and S21 could be caused by the simulation model and the lung phantom used for the measurements, since they differ in their geometrical dimensions, the shape of the lung and the antenna orientation. A shift in S11 can be mainly attributed to a detuning of the antenna caused by a variation of the effective dielectric in close vicinity. However, S21 is influenced by multiple factors when the air volume is changed. These are the respective and potentially different detuning of transmitting and receiving antenna, a change in absorption, a change in reflection and diffraction, and a change in phase offset of the different fractions of the electromagnetic waves as they interfere. For these reasons, the S21 magnitude shows an erratic behavior and a prediction of the air volume with only this parameter is not possible. However, S11 magnitude as well as S21 phase show a more consistent trend and are potentially useful for a dynamic prediction of air volume. Future work will focus on a systematic evaluation of these parameters in a more realistic experimental setup as well as a respective numerical model.
The data are available from the corresponding author upon request.
SF, CS and KJD carried out numerical field calculations, JR performed the experiments and the data analysis. SZ and JL supervised the research project and gave scientific and conceptual advice. All authors contributed to discussions and the manuscript.
The authors declare that they have no conflict of interest.
This article is part of the special issue “Kleinheubacher Berichte 2019”. It is a result of the Kleinheubacher Berichte 2019, Miltenberg, Germany, 23–25 September 2019.
The publication of this article was funded by the open-access fund of Leibniz Universität Hannover.
This paper was edited by Lars Ole Fichte and reviewed by two anonymous referees.
Balanis, C. A.: Antenna Theory: Analysis and Design, John Wiley & Sons, Hoboken, NJ, USA, ISBN 978-1-118-642060-1, 2016.
IEEE Standard #145: Definitions of Terms for Antennas, in: IEEE No 145-1969, 1–10, 12 January 1969, https://doi.org/10.1109/IEEESTD.1969.7366531, 1969.
Kundu, S. K. and Kumagai, S.: A Wearable Capacitive Sensor for Monitoring Human Respiratory Rate, Jpn. J. Appl. Phys., 52, 04CL05, https://doi.org/10.7567/JJAP.52.04CL05, 2013.
Laybros, S. and Combes, P. F.: On radiating-zone boundaries of short, λ∕2, and λ dipoles, IEEE Antenn. Propag. M., 46, 53–64, 2004.
Leonhardt, S., Leicht, L., and Teichmann, D.: Unobtrusive Vital Sign Monitoring in Automotive Environments – A Review, Sensors, 18, 3080, https://doi.org/10.3390/s18093080, 2018.
Mahmoud, R., Proquitté, H., Hadhood, S., and Schmalisch, G.: Effect of endotracheal tube leakage on respiratory function monitoring: Comparison of three neonatal ventilators, Journal of Pediatric Intensive Care, 01, 61–69, https://doi.org/10.3233/PIC-2012-012, 2015.
Meinke, H. H. and Gundlach, F. W.: Taschenbuch der Hochfrequenztechnik, Band 1: Grundlagen, 5. Auflage, herausgegeben von Klaus Lange und Karl-Heinz Löcherer, Springer-Verlag, Berlin, Heidelberg, New York, 1992.
Oum, J. H., Lee, S. E., Kim, D.-W., and Hong, S.: Non-contact heartbeat and respiration detector using capacitive sensor with Colpitts oscillator, Electron. Lett., 44, 87, https://doi.org/10.1049/el:20082336, 2008.
Ringkamp, J., Radler, P., Lebhardt, P., and Langejürgen, J.: A novel non-invasive, non-conductive method for measuring respiration, J. Sens. Sens. Syst., 9, 27–32, https://doi.org/10.5194/jsss-9-27-2020, 2020.
Schelkunoff, S. A.: The impedance Concept and Its Application to Problems of Reflection, Refraction, Shielding and Power Absorption, Bell Syst. Tech. J., 17, 17–48, https://doi.org/10.1002/j.1538-7305.1938.tb00774.x, 1938.
Teichmann, D., Foussier, J., Jia, J., Leonhardt, S., and Walter, M.: Noncontact monitoring of cardiorespiratory activity by electromagnetic coupling, IEEE Trans. Biomed. Eng., 60, 2142–2152, https://doi.org/10.1109/TBME.2013.2248732, 2013.
Teichmann, D., de Matteis, D., Bartelt, T., Walter, M., and Leonhardt, S.: A bendable and wearable cardiorespiratory monitoring device fusing two noncontact sensor principles, IEEE J. Biomed. Health, 19, 784–793, https://doi.org/10.1109/JBHI.2015.2417760, 2015.
Troescher, M., Jakubus, U., and Steinmair, G.: Combined PEEC/MoM solution technique for efficient electromagnetic emission calculations of PCBs in metallic enclosures, International Symposium on Electromagnetic Compatibility 2004, IEEE, 266–270, https://doi.org/10.1109/ISEMC.2004.1350038, 2004.