 | 17 Dec 2021
A novel Technique for Improving the Angular Accuracy of Doppler VOR Receivers
Karsten Schubert
Jens Werner
Jens Wellhausen
Doppler VOR (D-VOR) transmitters are used as navigation aids in aviation. They transmit an omnidirectional phase reference in an amplitude-modulated (AM) sideband and directional phase information on a frequency-modulated (FM) subcarrier. In an airborne D-VOR navigation receiver, a directional information (azimuth angle) related to the position of the aircraft and the location of the transmitter can be derived from the difference of these two phase signals. In this work, the accuracy of AM and FM phase signals is firstly investigated analytically and afterwards verified by measurements. It will be shown that in established procedures, phase inaccuracy is dominated by the AM signal, since the FM signal is about 21 dB less noisy. Subsequently, a novel method is presented that improves the accuracy of the azimuth angle by orders of magnitude in case of D-VOR transmitters. This new method inherently reduces noise of the AM phase and thus yields a significant increase in accuracy. As a result, the remaining FM phase uncertainty becomes dominant for the total uncertainty of the bearing indication. Finally, the application of the new method to real measured signals confirms the theoretical expectations.
- Article
(2036 KB) - Full-text XML
- BibTeX
- EndNote


Within the framework of “WERAN plus” research project (Schrader, 2019), interactions between wind turbines and various radio and navigation services are being investigated. Here, a strong focus is on very high frequency omni-directional range transmitters (VOR). Currently (2020–2021), large-scale investigations of radio channels with regard to interference from wind turbines are being carried out using the research aircraft (Wellhausen, 2020) of Jade University of Applied Sciences. The general objective is to investigate the effect of wind turbines – e.g. by reflected or scattered signals – on radio and navigation services (in addition to conventional and Doppler VOR also radar, AIS, etc.) by means of precise measurements. This publication presents the analysis of measurement data obtained during an orbital flight around the Bremen D-VOR in July 2020 (Werner et al., 2021).
Special measurement hardware is being developed at Jade University for these tasks. The receiving hardware is comprised of a radio frequency (RF) front end and a digital back end using analogue to digital conversion (ADC) and field programmable gate array circuits (FPGA). This software defined radio (SDR) architecture allows to stream the captured data via ethernet to an external computer. The SDR is optimised with regard to synchronicity with highly accurate time stamps, dynamic range (>90 dB) and coherence of parallel receiving paths for different antenna polarisation. Data is recorded complex valued as in-phase and quadrature (IQ) baseband data. All clock frequencies and local oscillators are derived from a single frequency standard (Oven Controlled Crystal Oscillator (OCXO) locked onto GPS time reference). In addition to the airborne SDR, another identical receiving system was set up on the ground near the D-VOR transmitter. Since both systems are synchronised by GPS, ground-based and airborne measurements can be performed quasi-synchronously. Among other things, this allows the momentary frequency fluctuations of the transmitter to be eliminated in a post-processing step.
A D-VOR transmits a modulated signal in a VHF radio channel. An airborne receiver can determine the direction towards the transmitter without direction finding equipment, as the directional information is encoded by the transmitter in the modulation of the signal. This modulated signal contains several components which are transmitted omnidirectionally as a reference and direction-dependent as azimuth information.
This azimuth angle (also named bearing or radial) can be determined in the receiver by calculating the phase difference between directional and non-directional signal components. Ideally, the measured phase difference corresponds to the actual radial. In practice, however, there is an uncertainty in the measurement due to the respective D-VOR facility itself and the topological environment of the D-VOR. Uncertainty due to the D-VOR system itself is system-specific. The uncertainty due to the environment (buildings, trees, mountains, …) is site-specific. The impact of the real environment was insufficiently assessed in the past. This led to the fact that in an approval process for construction of new buildings (especially wind turbines) too high influences were suspected and in the end approval was denied.
From an aviation safety point of view, it must be ensured that the uncertainty does not exceed a certain threshold (e.g. 3.5∘). To evaluate this uncertainty in advance, a calculation method is required that reliably predicts the impact of constructions. The long-term goal of the “WERAN plus” investigation is to establish such a prediction model.
During the analysis of recorded data, a novel technique was developed which yields a significantly improved accuracy for the reference phase in a D-VOR receiver. This technique is presented in Sect. 4. The improvement with respect to short-term stability is about two orders of magnitude.
Following this introduction, signals transmitted by a D-VOR are described in time and frequency domain in Sect. 2. Then, in Sect. 3, the demodulation of the FM subcarrier and the advantage of FM modulation gain are discussed. The fundamental idea of the new methodology is described in Sect. 4. Afterwards, based on actual measurements, the accuracy of azimuth calculation by traditional and novel techniques is presented.
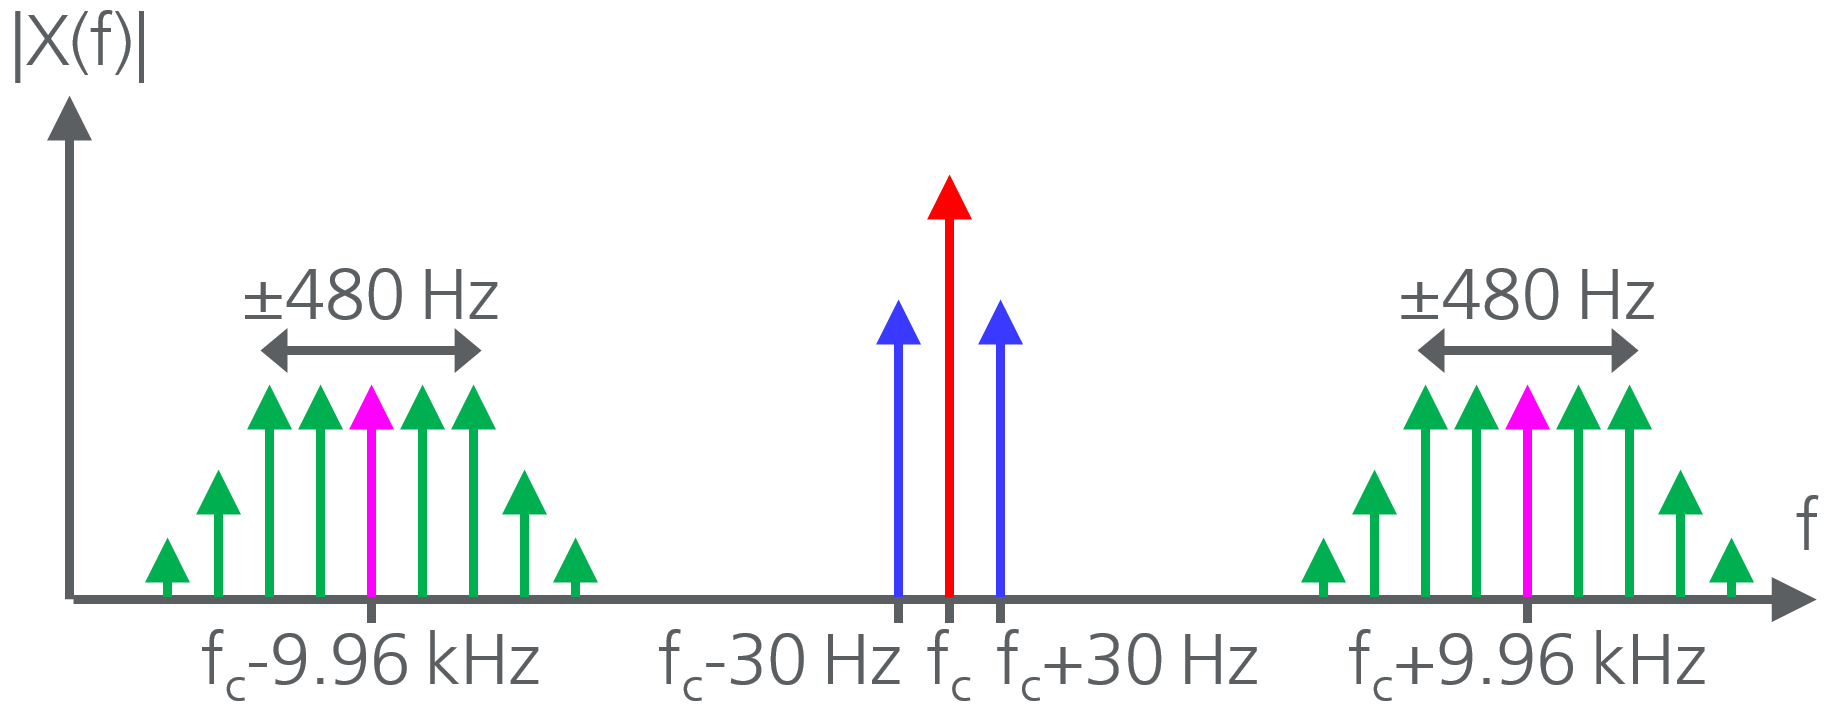
Figure 1 illustrates the spectrum of a D-VOR transmitter. According to ICAO (2018), the carrier frequency (red arrow) is in the frequency range from 108 to 117.95 MHz. The carrier is amplitude modulated with a 30 Hz cosine signal having a constant phase (blue arrows). Furthermore, a subcarrier of 9.96 kHz is modulated onto the VHF carrier in AM (pink arrows). This subcarrier itself is frequency modulated with a 30 Hz signal having a variable phase. The nominal frequency deviation is ±480 Hz (green arrows). In a D-VOR receiver mounted on an aircraft for navigational purposes, the phase difference between the 30 Hz AM spectrum and the 30 Hz FM spectrum on the subcarrier is evaluated to determine the azimuth, i.e., the bearing, on which an aircraft is located with respect to the D-VOR transmitter. In Fig. 1 the spectrum of an additional audio identification (speech or Morse code) is not shown, as it is not relevant for the following considerations. For a complete description of the D-VOR system, the reader is referred to references Flühr (2012), Kanen (1978), and Thales (2004).
In time domain, the signal of a D-VOR can be described by Eq. (1):
Here, fc is the carrier frequency (108…117.95 MHz), Hz the angular frequency of the 30 Hz AM sidebands, m=0.3 the modulation depth of the AM, Hz the angular frequency of the FM subcarrier, and η=480 Hz/30 Hz = 16 the FM modulation index. The azimuth or radial angle θ=0…2π is expressed by the variable phase of the frequency modulation. In this equation the signal x(t) is dimensionless and normalized to unit amplitude (see also Flühr, 2012).
Equation (2) describes the frequency modulation of the subcarrier term given in Eq. (1) as a series expansion with Bessel functions of 1st kind Jk(η) (Schafheitlin, 1908). The constant 332 corresponds to the ratio of the subcarrier frequency to the 30 Hz component (332=9960 Hz/30 Hz). For the summand term with index k=0, it becomes apparent that this term is independent of the azimuth information θ. It is therefore possible to obtain the reference phase for the angular information not only from the 30 Hz AM component, but alternatively from the FM subcarrier by filtering appropriately.
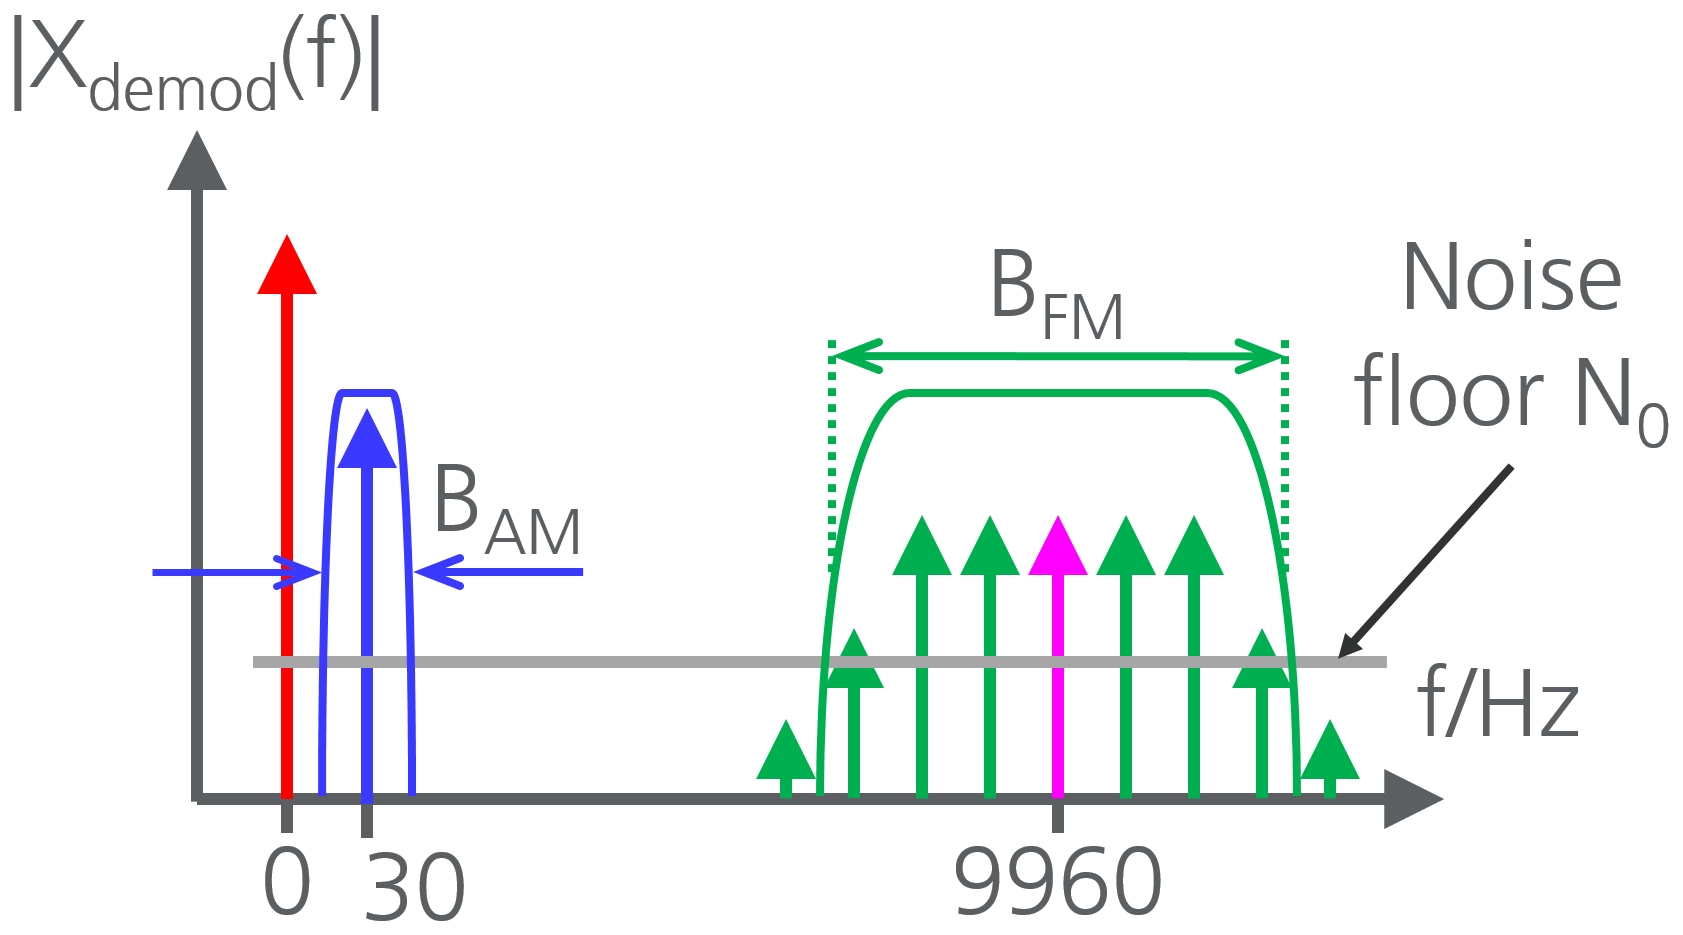
After demodulating the AM spectrum, the signal described by Eq. (3) in time domain is obtained as a baseband signal. PC denotes the power of the carrier signal, PAM and PFM respectively the power of the AM and FM spectra. Figure 2 illustrates the corresponding spectrum. The DC component (red arrow) is not of interest here. At 30 Hz (blue arrow) the reference signal is shown and at 9960 Hz (pink arrow) the FM subcarrier. For any further signal processing, filter bandwidths BAM and BFM are also shown in this illustration and have to be taken into account with regard to the noise power spectral density.
The bandwidth BAM may be reasonably in the range 0.1…30 Hz for digital signal processing. For very small filter bandwidths, the settling time must be taken into account. In this work, low-frequency 30 Hz signals are always filtered with a bandpass filter corresponding to Fig. 4 and being specified in Fig. 5. For this filter shape the equivalent noise bandwidth is 9.31 Hz.
For the FM subcarrier spectrum, Hz Hz is chosen. This corresponds precisely to the Carson bandwidth (Carson, 1922).
Assuming a frequency-independent noise power density N0 and considering the filter bandwidths, the noise power for the AM or FM signal results in:
Furthermore, the noise power can be used to specify the signal-to-noise ratio (SNR) and the carrier-to-noise ratio (CNR):
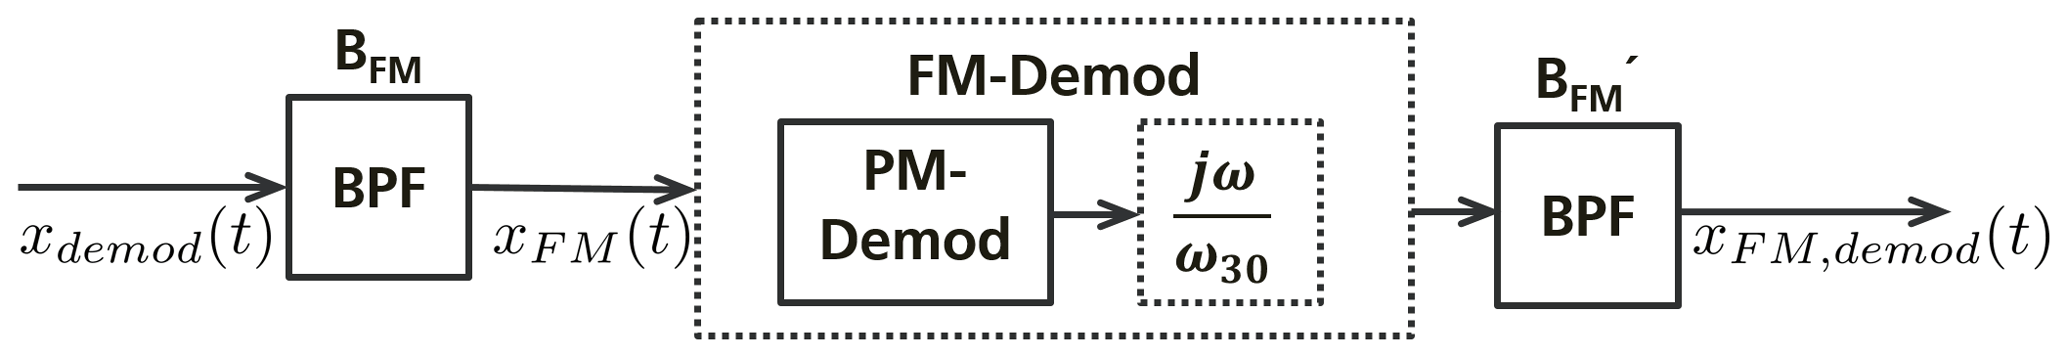
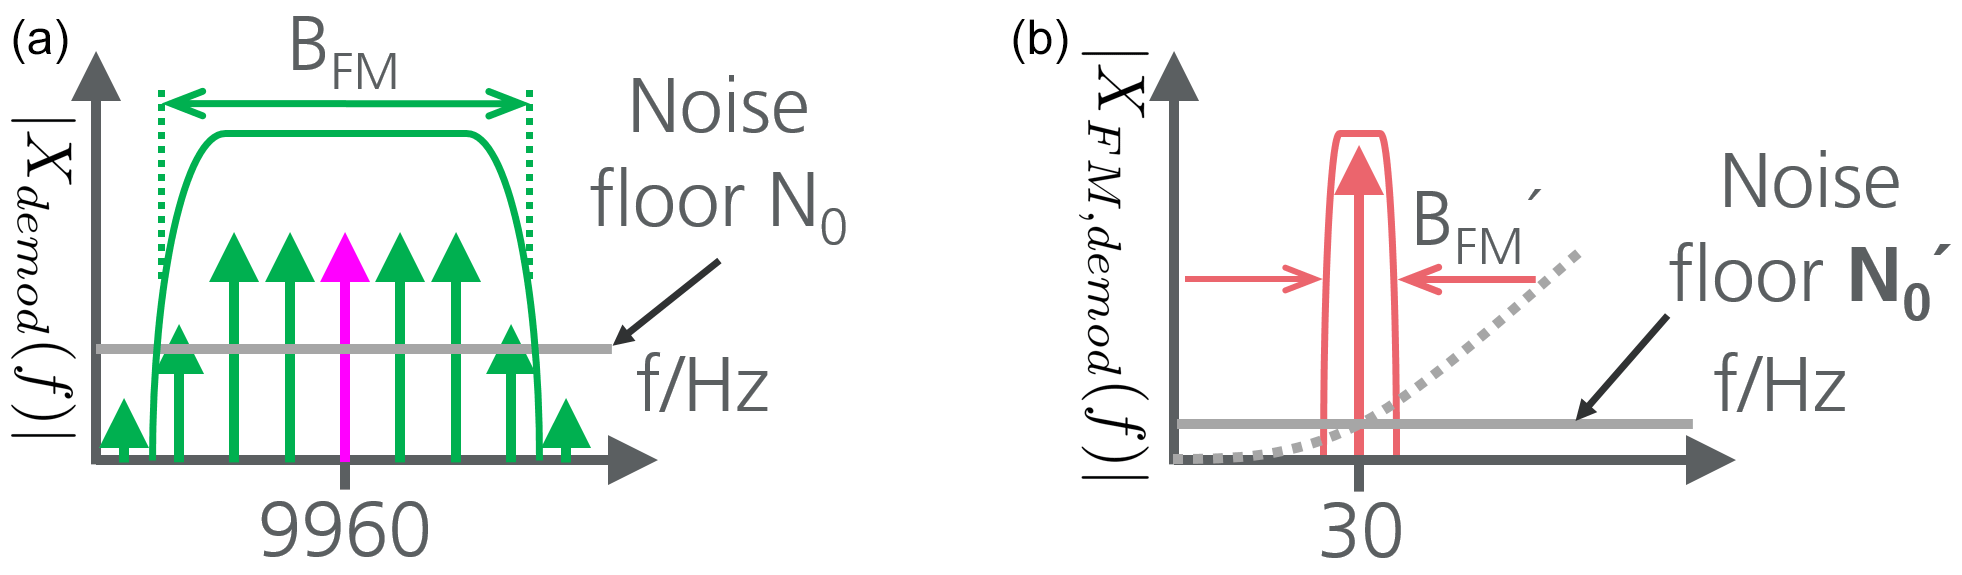
For the subsequent demodulation of the FM subcarrier, the baseband signal xdemod(t) is initially filtered with the above-mentioned filter bandwidth BFM and then fed to an FM demodulator (see Fig. 3). In the implementation used in this work, FM demodulation takes the form of phase demodulation (PM) followed by differentiation. The demodulated signal passes through another bandpass filter (center frequency 30 Hz, bandwidth ) and is then available as xFM,demod(t) (Eq. 8). The signal is represented here again in a dimensionless and normalized form.
The associated dimensionless normalized power as mean square value follows to:
Using considerations from Rudolph (1922), the signal-to-noise ratio of the demodulated FM subcarrier can be described as given in Eq. (10):
Choosing identical filter bandwidths () and assuming equal power (PAM=PFM), the modulation gain results to:
With the 30 Hz AM component and the FM subcarrier modulated onto the VHF carrier with the same modulation depth m=0.3, the power in the AM and FM spectra is the same: PAM=PFM. Thus, frequency modulation basically yields here a signal-to-noise ratio that is 21 dB better than for amplitude modulation. In practice, this means that first of all the uncertainty of the AM phase limits the overall radial angular accuracy.
Retardation
During the orbital flight around Bremen D-VOR, the distance between aircraft and D-VOR transmitter is about 25 km, which is significantly larger than the wavelength of the transmitted signal. Therefore, for a correct phase representation, retardation must be taken into account (Eq. 12). Distance d between aircraft and transmitter follows from the vectorial difference of the two vectors rap and rVOR. The former is the vector from an arbitrary reference point to the aeroplane, the latter to the D-VOR position. Furthermore, c0 is the speed of light and t′ is known as retarded time.
The description of demodulated signal components, under consideration of the retardation, can now be taken from Eqs. (13) and (14). These are applied in Sect. 5 in the analysis of measurement data. For the 30 Hz components, this leads to an angular change of 1∘/27.777 km.
The term with index k=0 in Eq. (14) is independent of azimuth angle θ. Therefore it is possible, with suitable filtering, to derive the reference phase for the azimuth determination not only from the 30 Hz AM component, but alternatively from the FM subcarrier. For this purpose, the pure subcarrier is isolated from the signal xdemod(t) through a bandpass filter (fc=9960 Hz, B=9.31 Hz) and divided down in frequency by a factor of 332 (see Fig. 6). This is achieved in the digital signal processing of the IQ baseband data by taking the 332nd root. In doing so, the correct solution from the multitude of 332 possible complex results must be determined. The reference phase depends only on the distance. To resolve the ambiguity of the 332 solutions, an averaging of the AM reference phase can be carried out. It is important that during averaging the distance between D-VOR and receiver remains approximately constant (e.g. during orbital flight). The required solution of the all 332 solutions is the nearest neighbour to the average value. During this root extraction, phase noise (or phase uncertainty) is automatically reduced by a factor of 332. Since the phase information is an amplitude quantity, in theory there is an improvement in accuracy by 20⋅log (332)= 50.4 dB.
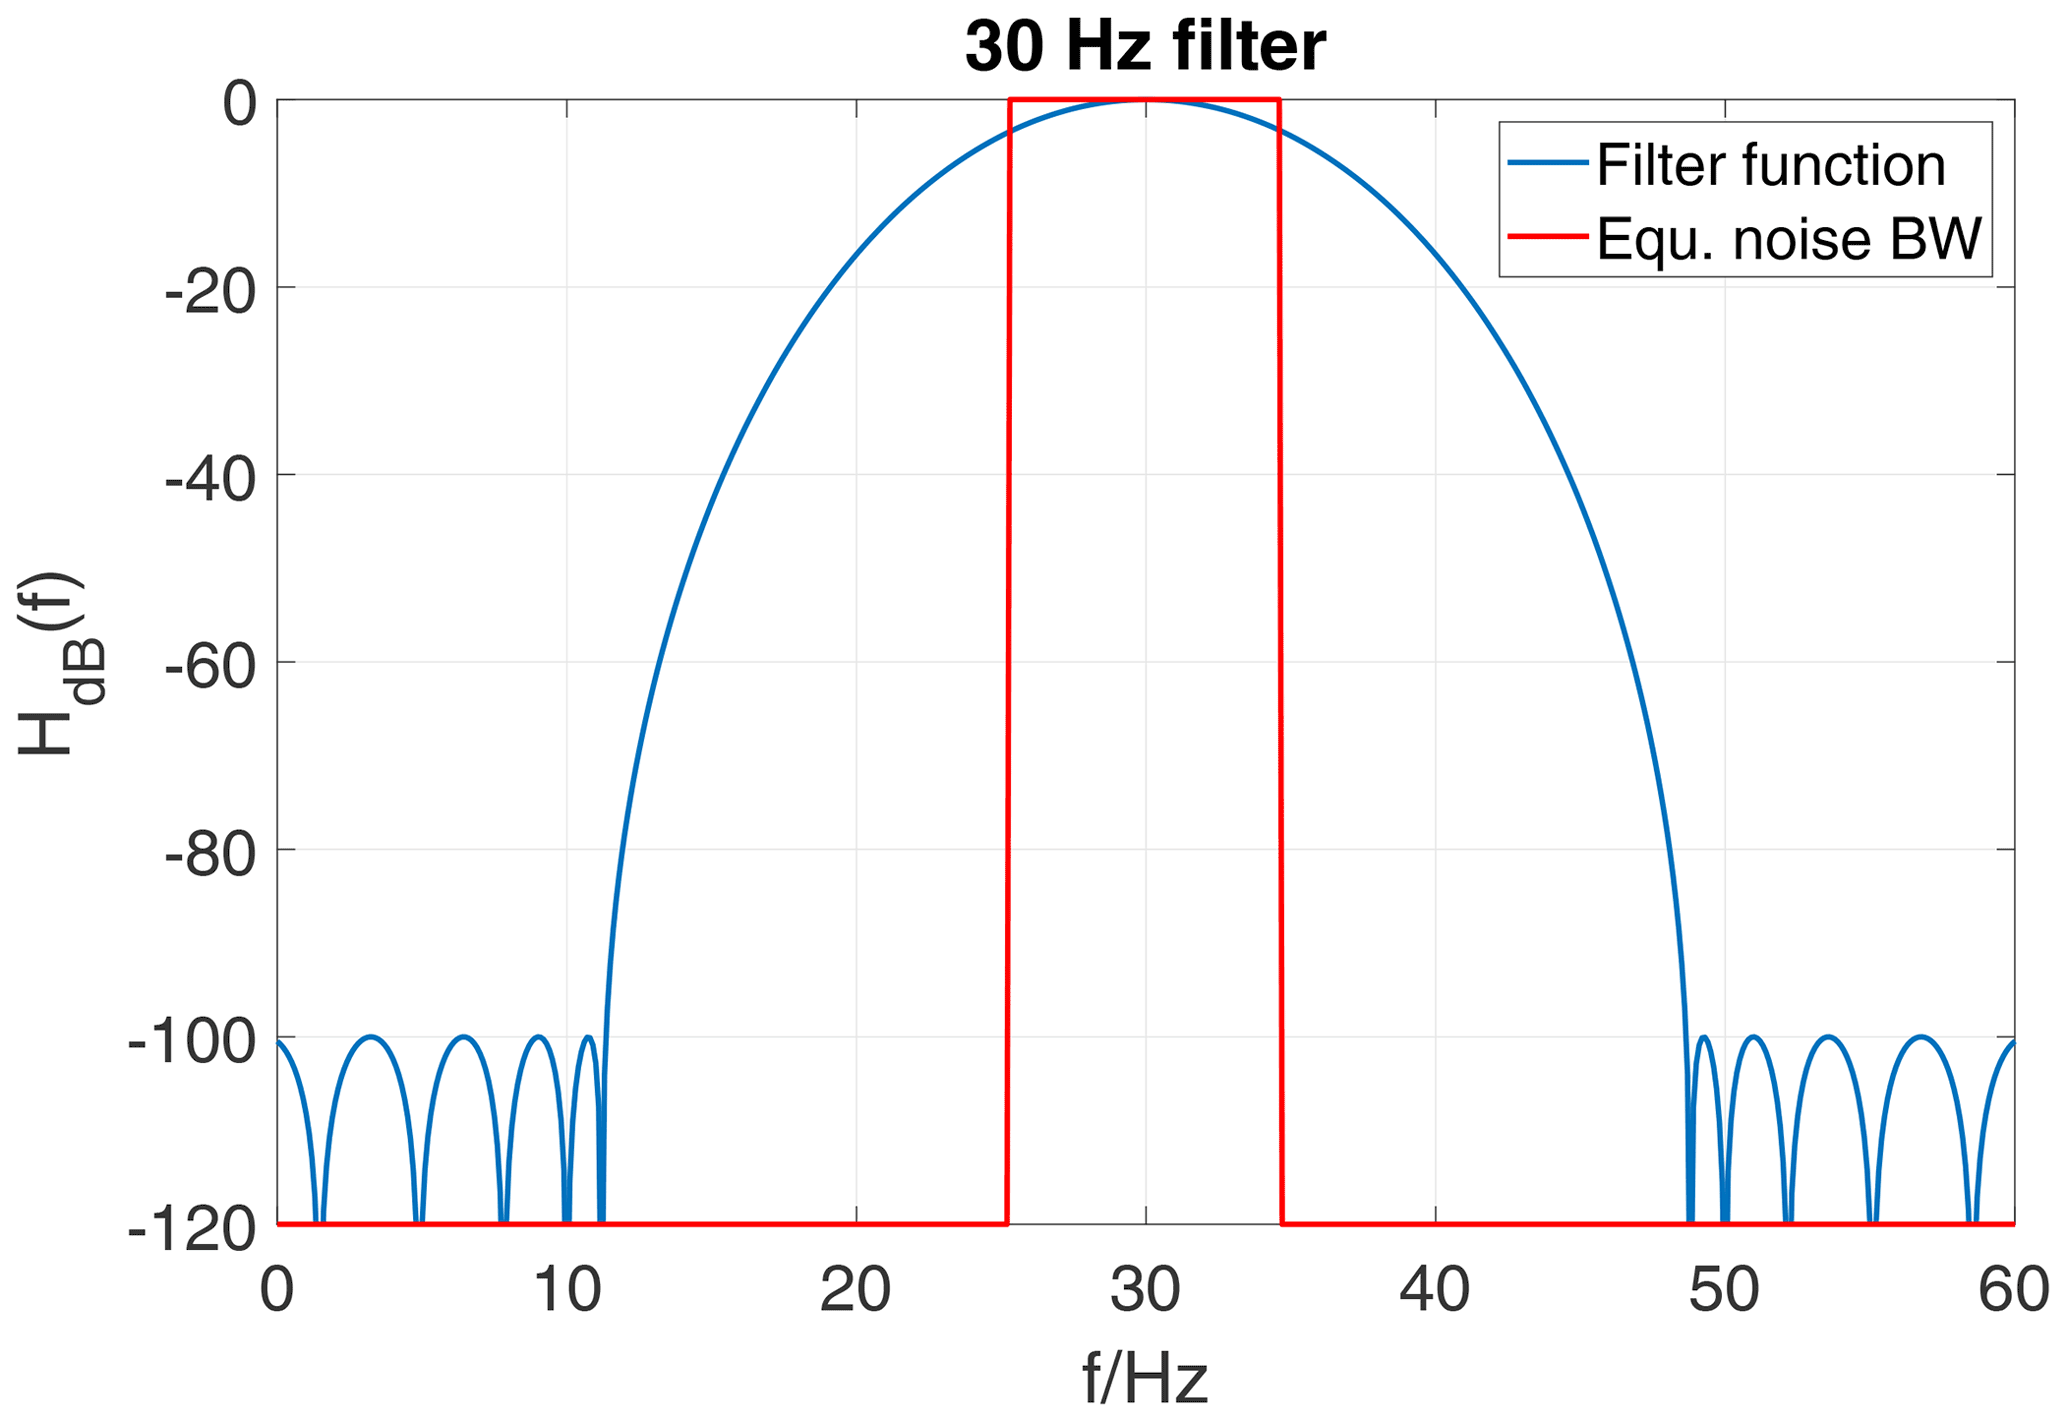
Figure 5Actual filter characteristic and equivalent noise bandwidth (BW=9.31 Hz) of band pass filter.
For measurements carried out in July 2020 at Bremen D-VOR, a software defined radio (SDR) receiver was mounted in the underwing pods of a HK 36-TTC ECO Diamond Aircraft touring motor glider. During the flight mission VHF signals were received, down-converted, captured and stored as digital IQ baseband data (Werner et al., 2021).
5.1 Comparing AM and FM Phase
In a D-VOR, the direction-independent reference phase is transmitted by the 30 Hz AM component, while the direction-dependent information (azimuth) is found in the modulation of the FM subcarrier. In a receiver, the actual bearing is determined by subtracting the two phases from each other. For the resulting accuracy of the displayed azimuth, both phases must therefore be investigated.
5.1.1 AM Reference Phase
Figure 7 shows the temporal variation of the reference phase. Shown in blue, with the strongest fluctuations, is the phase derived from the 30 Hz AM reference signal. After AM demodulation, this signal was filtered by a bandpass filter (fc=30 Hz, BWeq=9.31 Hz) (see Fig. 5). The red curve shows the same signal, yet averaged over a period of 10 s. For comparison, the theoretically expected phase based on GPS position is depicted in green. While the aircraft approaches towards the D-VOR (approximately up to t=1500 s), the phase increases steadily by 1∘/27.777 km due to the change in distance. After that, an orbital flight begins. This was flown approximately circularly, around the D-VOR at a nearly constant distance. In fact, this circular orbit was approximated by a polygon with 24 straight sections, so that the very small radial distance variation from the D-VOR causes a very small change in the calculated reference phase. This is visible in the period 1500 s < t < 5300 s as a very small ripple with 24 periods on the green curve.
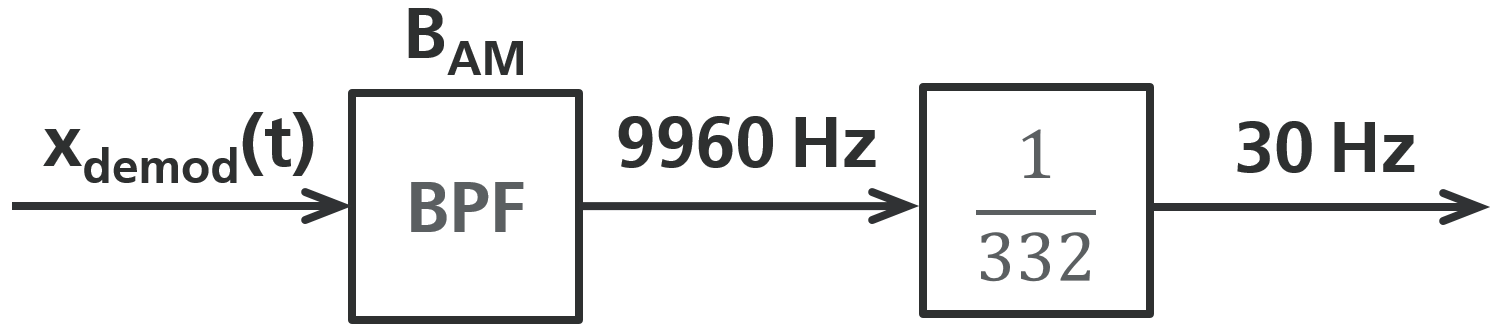
Figure 6After AM demodulation of the VHF carrier the baseband signal is passed through a bandpass filter (fc=9960 Hz, BWeq=9.31 Hz) into a frequency divider. The output provides a 30 Hz reference signal independent of azimuth angle θ.
Taking mean values from the red curve, the standard deviation of the AM phase (blue curve) can be determined to σAM=1.06∘ (see also Eq. A1 in the Appendix).
5.1.2 FM-Phase
To obtain the radial direction-dependent phase information, the FM subcarrier is demodulated and filtered with the same bandpass (fc=30 Hz, BWeq=9.31 Hz) as in AM demodulation. In an orbital flight, the phase θ of the FM subcarrier sweeps the entire range from 0 to 360∘. For better comparison, the graphs in Figs. 8 and 9 show the difference with respect to the true azimuth (θFM−θtrue). The latter is calculated from the GPS-based position of the aircraft. Just as in Fig. 7, the range from −5 to +5∘ is covered on the ordinate. The blue curve represents the FM phase normalized to true azimuth. Compared to the AM reference phase, a significantly lower noise is obvious. The standard deviation against the red curve averaged over 10 s is σFM=0.085∘. It is thus 22 dB lower than σAM. Looking at the FM modulation gain according to Eq. (11), this is close to the theoretical value of 21 dB.
Now, if the accuracy of the azimuth indication in a D-VOR receiver is to be improved, a new method must first and foremost provide a more accurate reference phase than the previously used method. This is described in the following section on the basis of real measured values.
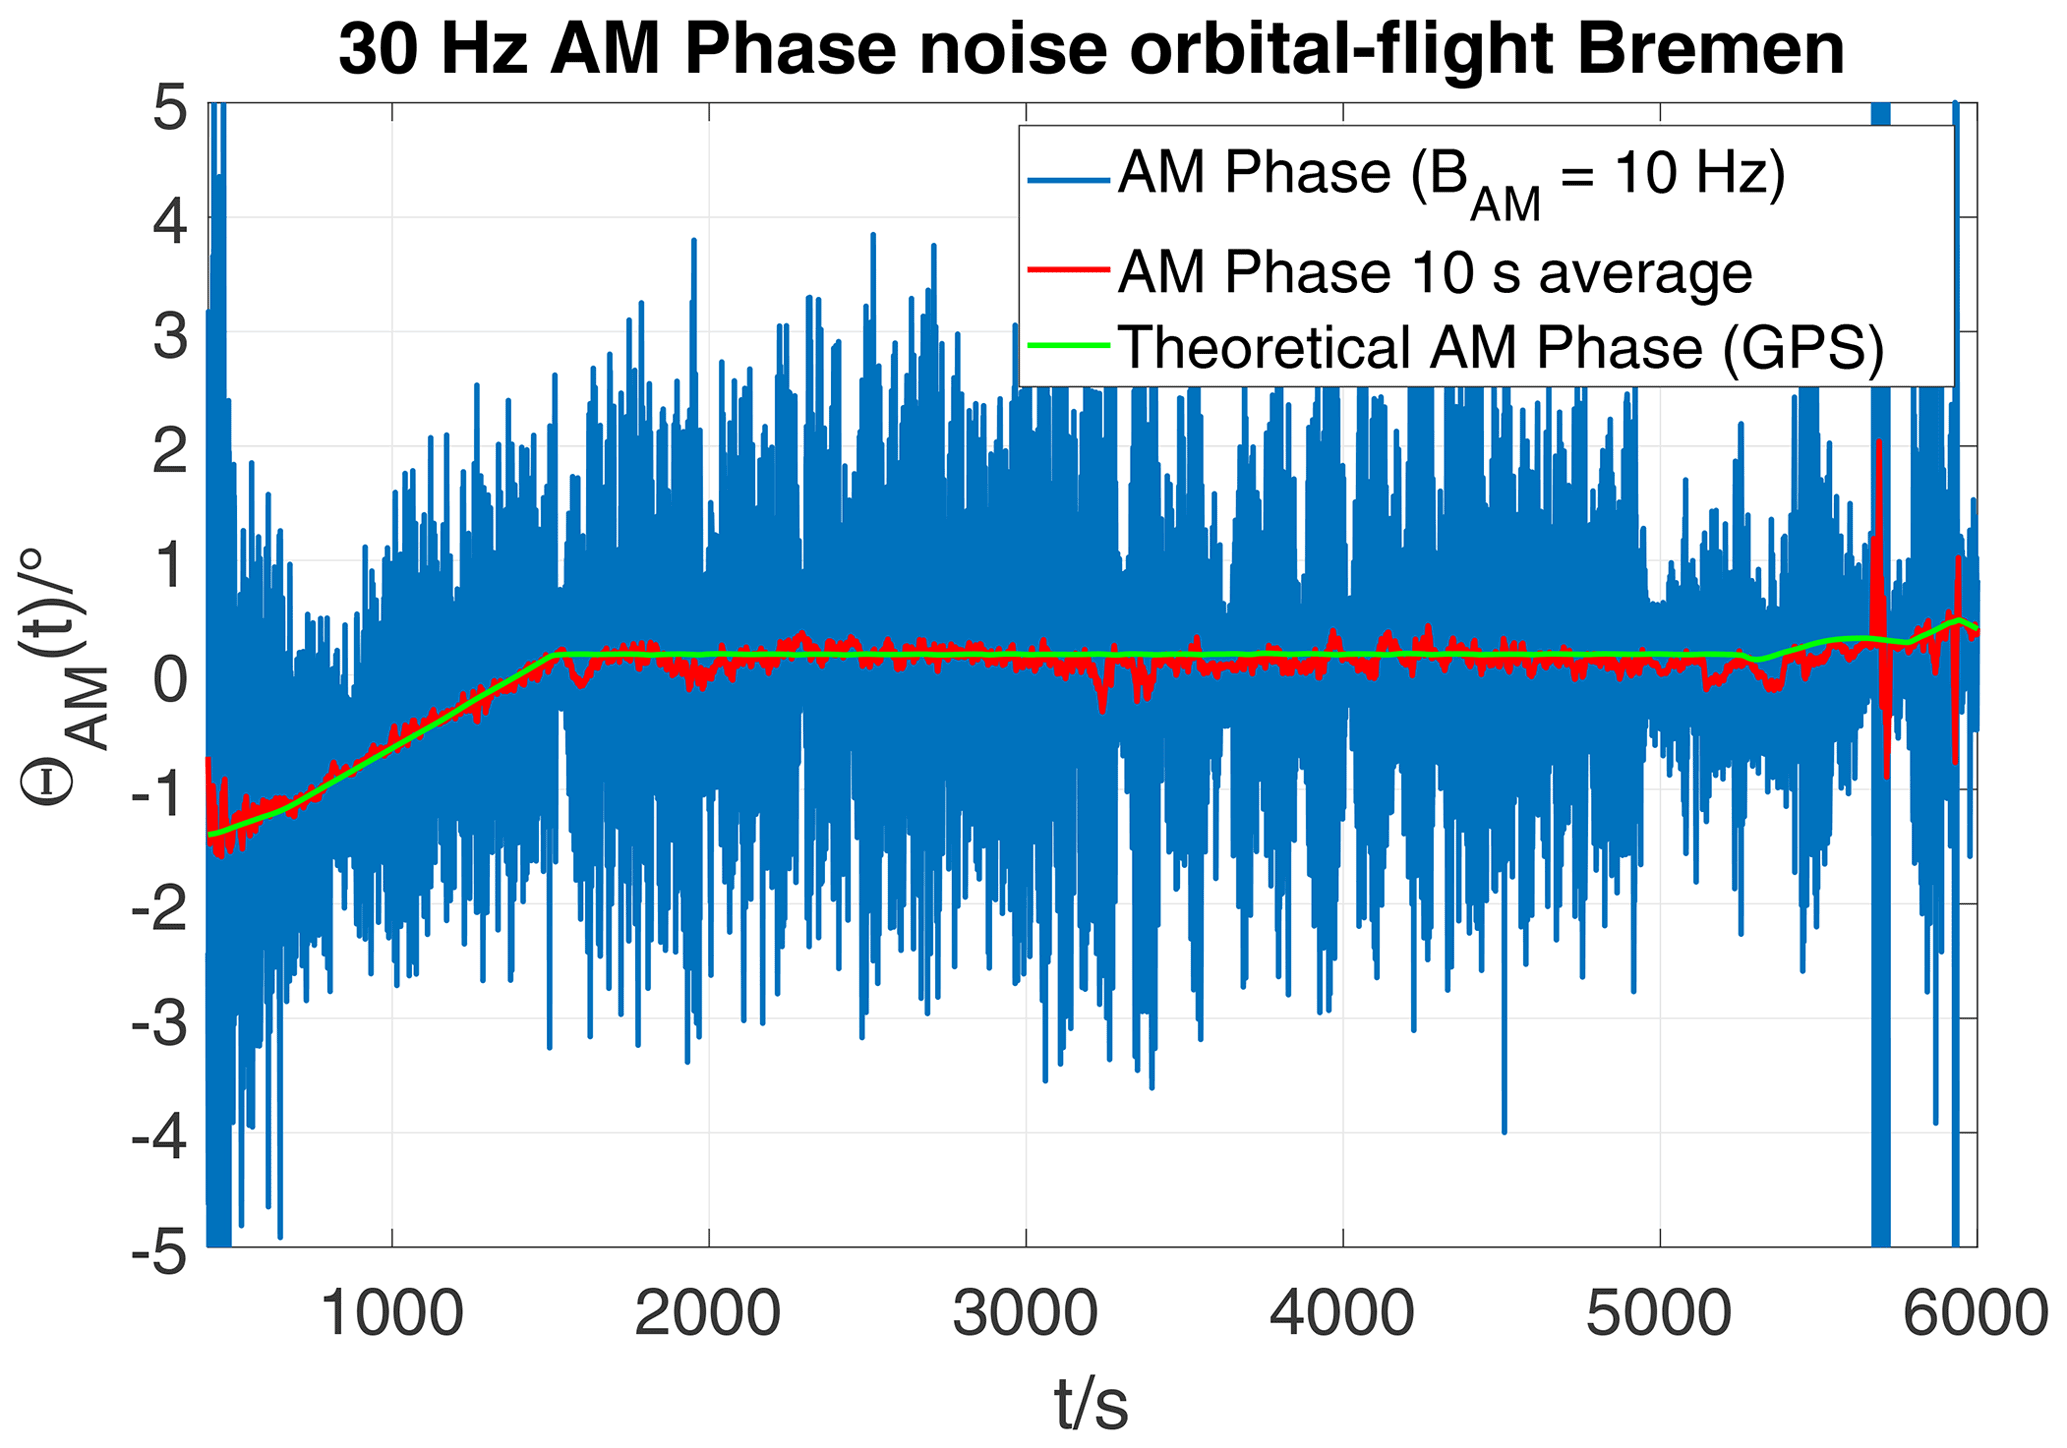
Figure 7Phase variation of 30 Hz AM signal during approach and orbital flight at Bremen D-VOR.
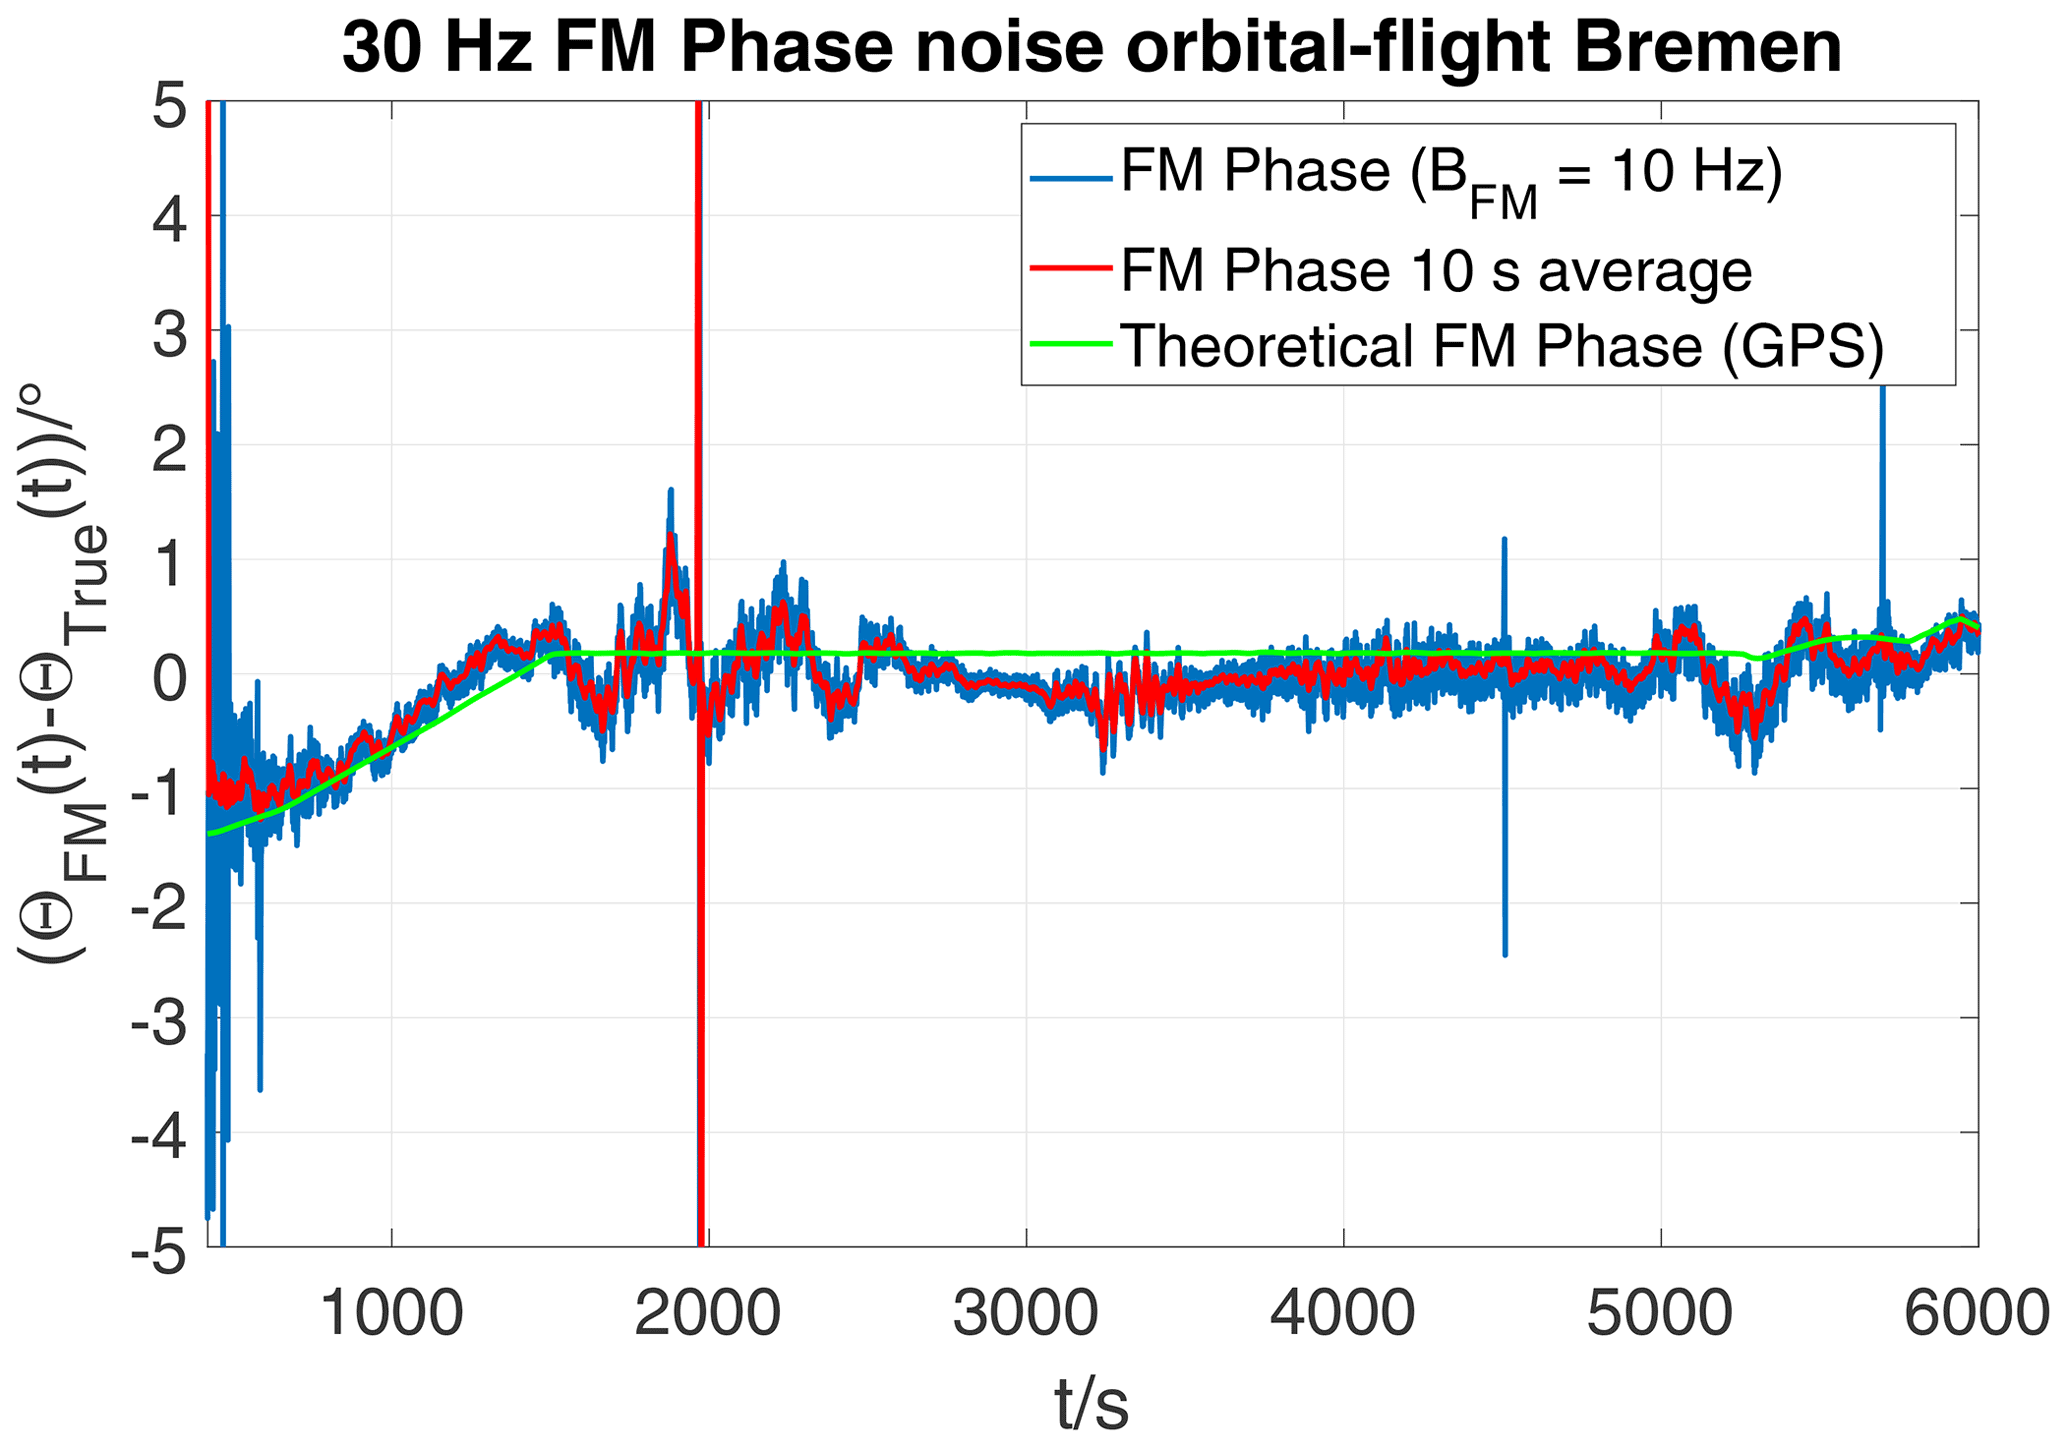
Figure 8Difference between azimuth from FM subcarrier and true bearing from GPS data during approach and orbital flight at Bremen D-VOR (1∘/div).
5.2 Phase Reference based on FM Subcarrier with Frequency Division
Following the procedure described in Sect. 4, the FM subcarrier is isolated by a bandpass filter (fc=9960 Hz, BWeq=9.31 Hz) after AM demodulation in the baseband at 9960 Hz. This bandpass filter has the same bandwidth and shape as the one shown in Fig. 5, except that it is shifted to the centre frequency of 9960 Hz.
Figure 10 shows the variation over time of the reference phase from four different signal sources.
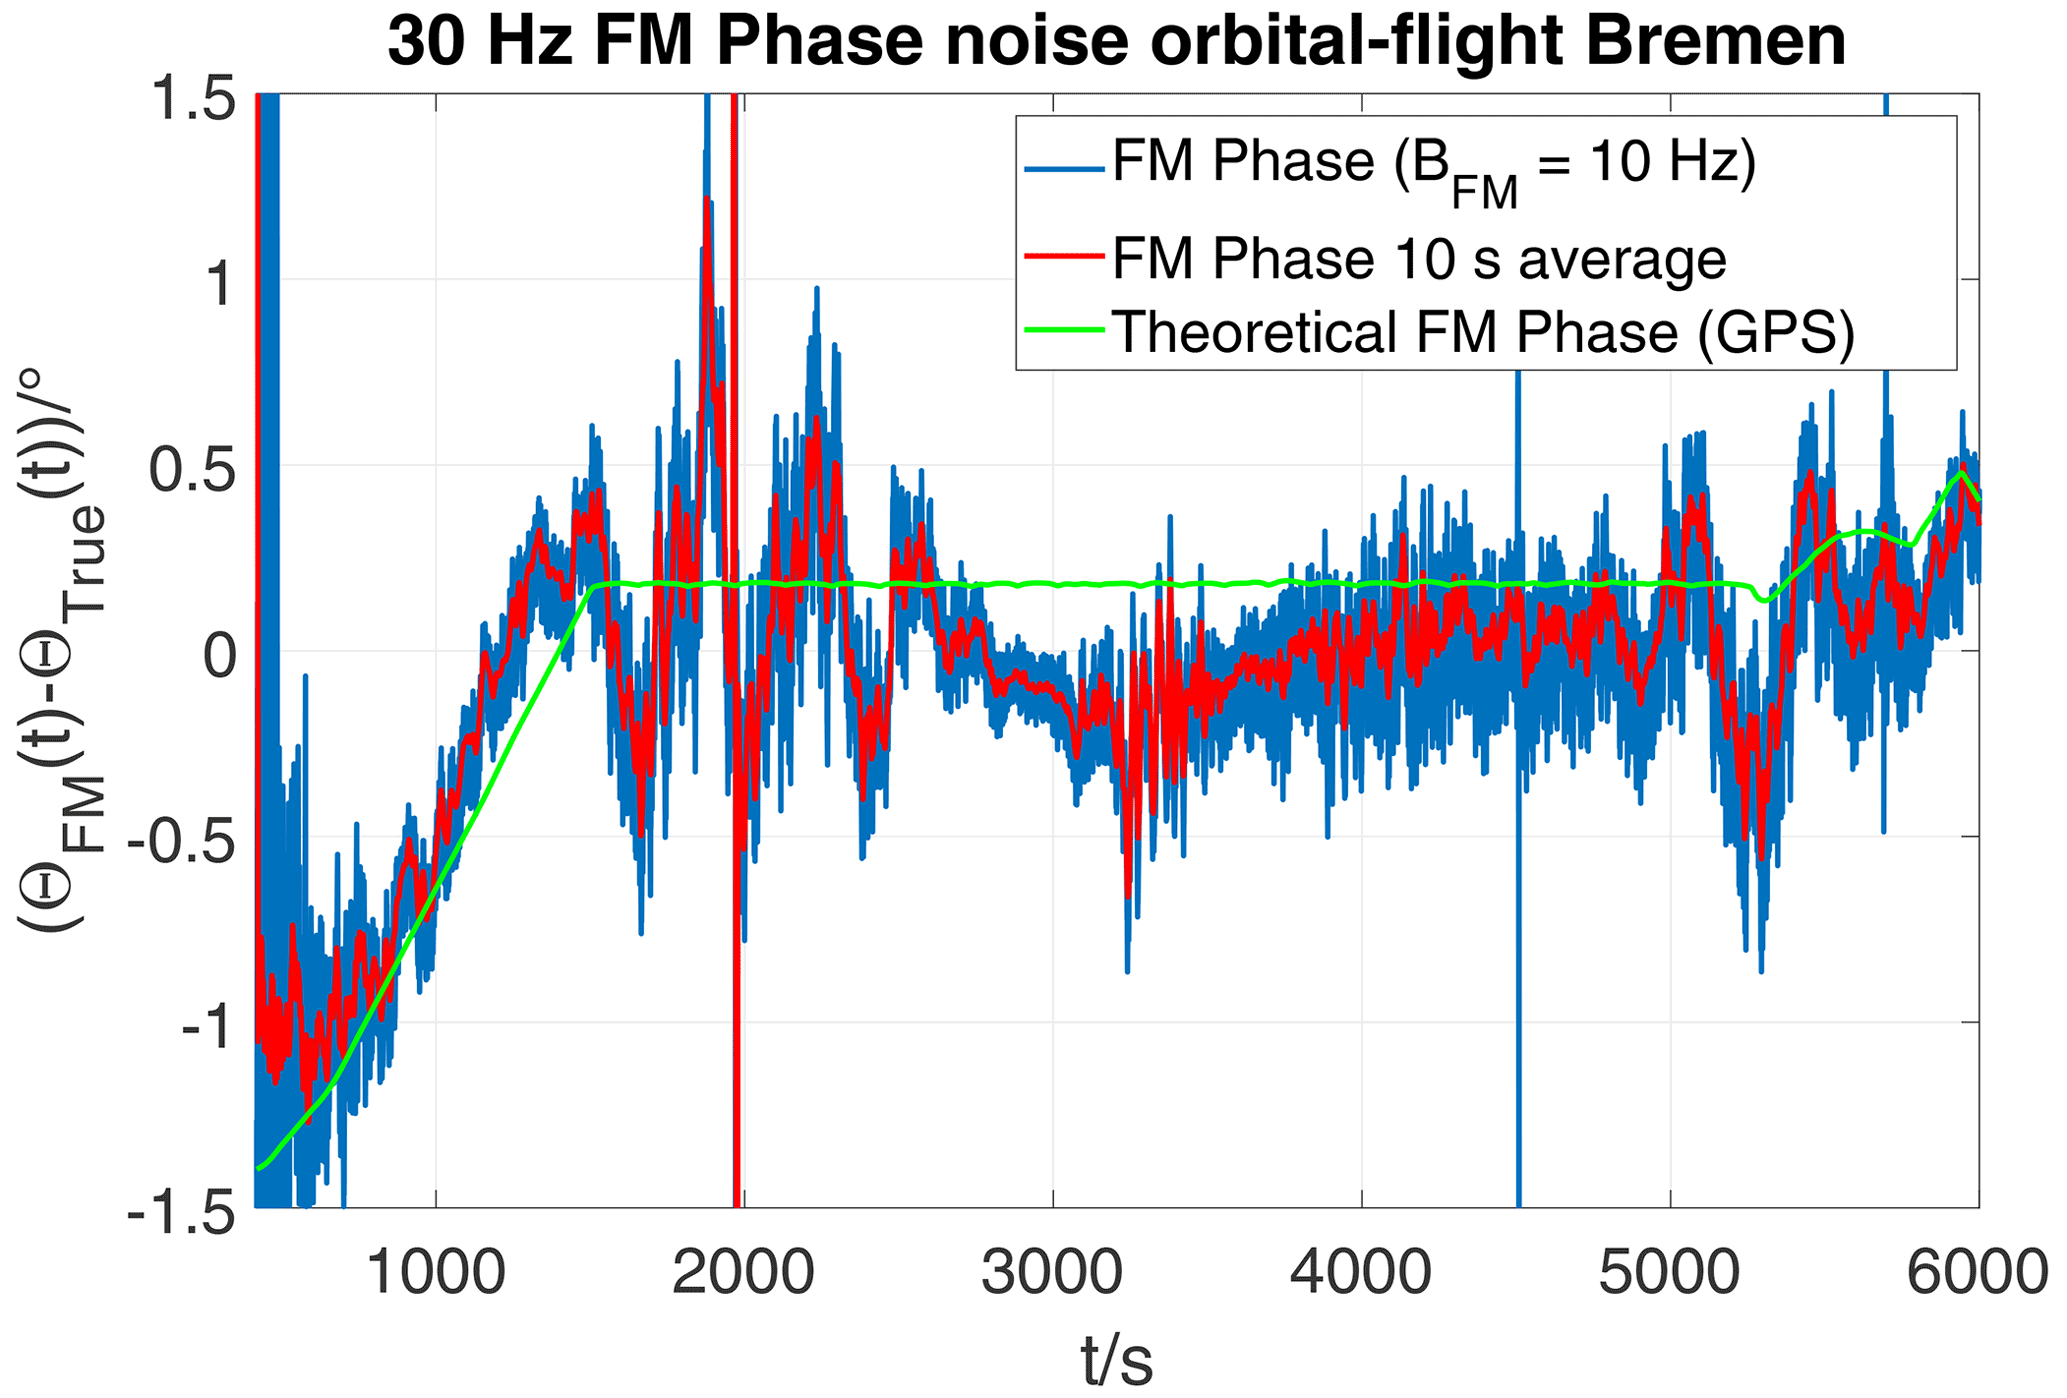
Figure 9Difference between azimuth from FM subcarrier and true bearing from GPS data during approach and orbital flight at Bremen D-VOR (0.5∘/div).
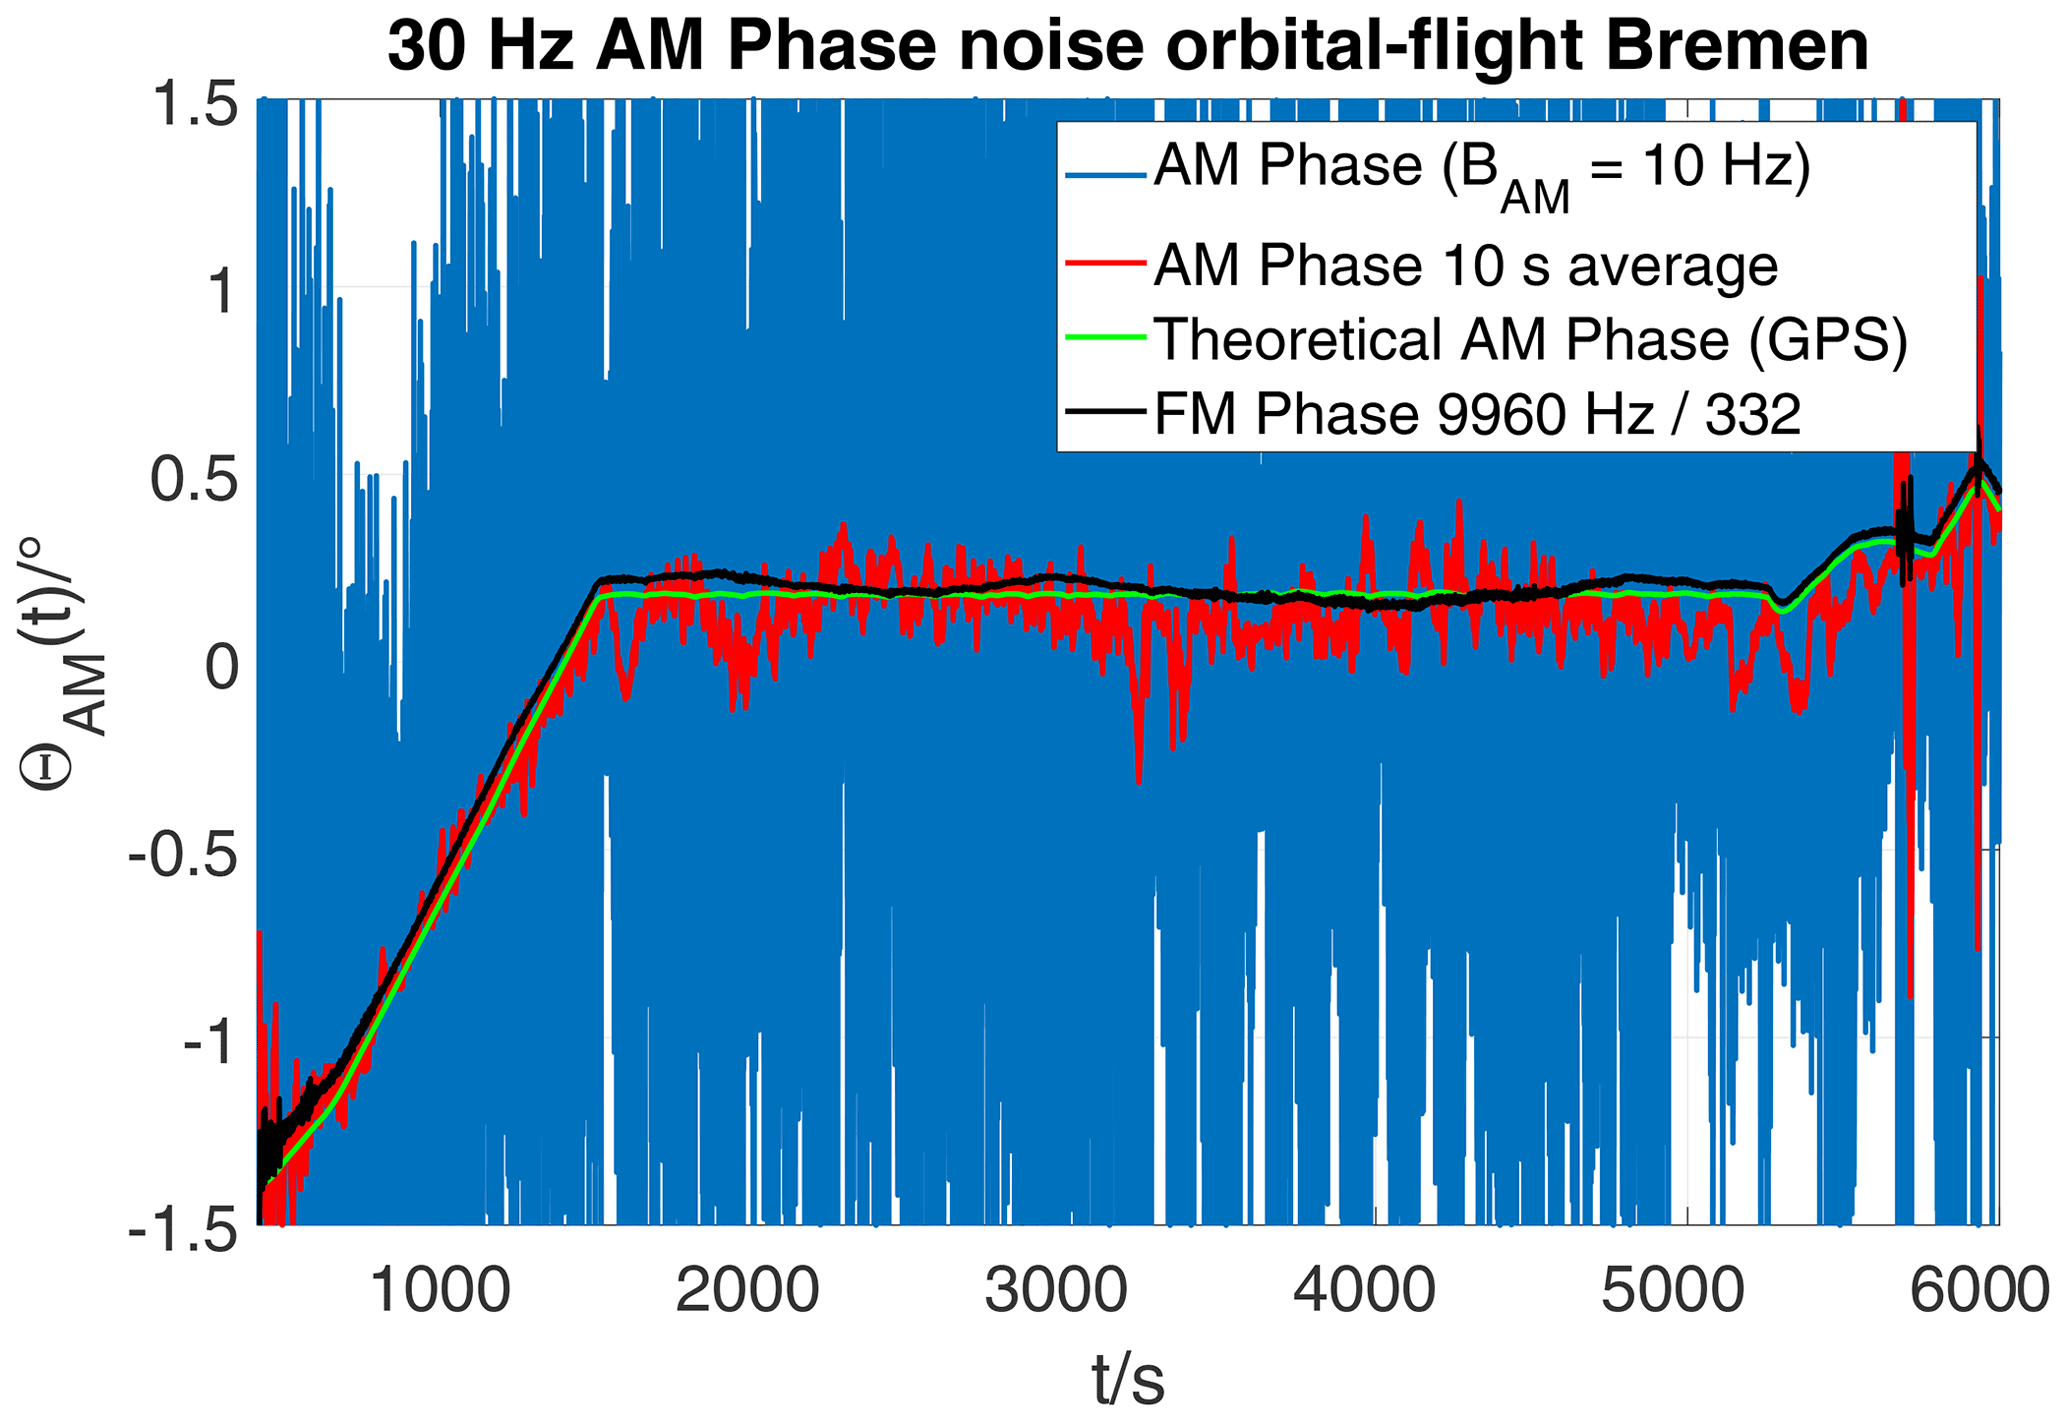
Figure 10Approach and orbit flight, Bremen D-VOR: Reference phase derived from FM subcarrier by frequency division (black), GPS position (green) and from 30 Hz AM signal (blue and red).
Shown in blue, with the strongest fluctuations, is the reference signal derived from the 30 Hz AM. The curve shown in red is based on the same signal, however, smoothed by averaging over 10 s. Using the GPS-based position of the aircraft, the theoretically expected phase progression was calculated via the distance to the D-VOR and drawn in green.
While approaching towards the D-VOR (approximately up to t=1500 s), the phase increases due to the change in distance. After that, the orbital flight begins, approximately circular, around the D-VOR at an almost constant distance.
The theoretically expected reduction of phase inaccuracy by 50.4 dB through frequency division by a factor of 332 is actually visible in the curve shown in black. The standard deviation here is only 0.003∘. For the AM reference phase in this measurement the standard deviation is by a factor of 353.3 (51 dB) larger which is close to the theoretical value of 332 (50.4 dB).
If the reference phase in a D-VOR receiver was obtained according to the novel method presented here, the accuracy could be improved by orders of magnitude.
This paper describes airborne measurements on D-VOR signals. Analytical and practical analysis of the spectral signal components show that for a standard D-VOR receiver the dominant phase error originates from the AM reference component. The standard deviation σAM is larger than σFM by 22 dB in measurement and 21 dB in theory – which can be explained by the derivation of the FM modulation gain. Thus, the noise component of the AM signal dominates the accuracy of the derived azimuth angle in previous methods. Here, a novel approach to extract the phase reference was presented that enables a significant reduction in angular uncertainty. This novel method is based on the fact that the isolated FM subcarrier contains no azimuth information, and when it is divided down to 30 Hz, the phase noise is reduced by a factor of 332 (50.4 dB). Measurements here yield the value 353.3 (51 dB), demonstrating the practical applicability of this new method. Thus, an alternative, highly accurate phase reference for D-VOR system is now available.
In previous sections calculated values for standard deviation of azimuth angle θ were given. Those were derived from time discrete samples according to this formula:
Here, Nmax is the total number of samples during the orbital flight. N5 s is the number of samples during a period of 5 s. Hence, the standard deviation is calculated against a moving average over 10 s.
IQ baseband data as well as IMU and GPS position and time stamps for the described orbital flight at Bremen DVOR can be accessed at Zenodo open-access repository: https://doi.org/10.5281/zenodo.4481998 (Werner et al., 2021).
KS, and JWer designed the experiments. All authors executed the experiments. KS analysed the baseband data and developed the new methodology. JWer prepared the manuscript with contributions from all coauthors. All authors read and approved the final manuscript.
The authors declare that they have no conflict of interest.
Publisher’s note: Copernicus Publications remains neutral with regard to jurisdictional claims in published maps and institutional affiliations.
This article is part of the special issue “Kleinheubacher Berichte 2020”.
The authors would like to thank Martin Kumm, Pascal Janßen and Yannik Schildt for their support and dedication during flight and measurement missions.
This research has been supported by the German Federal Ministry for Economic Affairs and Energy on the basis of a decision by the German Bundestag (grant no. 0324252C)
This paper was edited by Madhu Chandra and reviewed by Heyno Garbe and one anonymous referee.
Carson, J. R.: Notes on the theory of modulation, Proc. IRE, Vol. 10, no. 1, 57–64, 1992. a
Flühr, H.: Avionik und Flugsicherungstechnik – Einführung in Kommunikationstechnik, Navigation, Surveillance, Springer-Verlag, Berlin Heidelberg, https://doi.org/10.1007/978-3-642-33576-1, 2012. a, b
ICAO (International Civil Aviation Organization): Annex 10 to the Convention on International Civil Aviation, Aeronautical Telecommunications, Volume I, Radio Navigation Aids, 7th Edn., 2018. a
Kanen, G. M.: VHF Omnidirectional Radio Range (VOR) Electromagnetic Spectrum Measurements, Technical Note, U.S. Department of Transportation, Federal Aviation Administration, 1978. a
Rudolph, D.: Modulation und Rauschen, Lecture notes, TFH Berlin – Telekom TT – IBH, available at: http://www.diru-beze.de/modulationen/skripte/SuS_W0506/Modulation_Noise_WS_0506.pdf (last access: 17 November 2021), 2005. a
Schafheitlin, P.: Die Theorie der Besselschen Funktionen, B.G. Teubner Verlag, Berlin, 1908. a
Schrader, T.: Projekt WERAN plus – Stand der Forschung; Braunschweig 2019, available at: https://www.ptb.de/cms/fileadmin/_migrated/user_upload/2019-12-19_WERAN_plus_Stand_der_Forschung_.pdf (last access: 17 November 2021), 2019. a
Thales: DVOR 432; VHF Omnidirectional Radio Range, Technical Manual Part 1, Equipment Description – Ed. 1.04, Thales, Stuttgart, available at: https://fccid.io/ANATEL/01057-13-08758 (last access: 17 November 2021), 2004. a
Wellhausen, J.: Das Forschungsflugzeug D-KWHV, available at: https://www.jade-hs.de/unsere-hochschule/fachbereiche/ingenieurwissenschaften/forschung-und-praxis/fernerkundung/das-forschungsflugzeug/ (last access: 17 November 2021), 2020. a
Werner, J., Schubert, K., Wellhausen, J., Kumm, M., Janßen, P., and Schildt, Y.: IQ baseband data, IMU and GPS time stamps for orbital flight around Bremen Doppler VOR (1.0), Zenodo [data set], https://doi.org/10.5281/zenodo.4481998, 2021. a, b, c
- Abstract
- Introduction
- D-VOR Spectrum
- Demodulation of FM Subcarrier
- Novel technique for high-precision reference phase by means of frequency division
- Measurements at Bremen D-VOR
- Conclusions
- Appendix A: A Note about Calculation of Standard Deviation
- Data availability
- Author contributions
- Competing interests
- Disclaimer
- Special issue statement
- Acknowledgements
- Financial support
- Review statement
- References