 | 27 Jul 2023
Vulnerability of Smart Grid-enabled Protection Relays to IEMI
Fernando Arduini
Marian Lanzrath
Samikshya Ghosalkar
Arash Nateghi
Sven Fisahn
Martin Schaarschmidt
The electricity sector has been undergoing transformations towards the smart grid concept, which aims to improve the robustness, efficiency, and flexibility of the power system. This transition has been achieved by the introduction of smart electronic devices (SEDs) and advanced automatic control and communication systems. Despite the benefits of such modernization, safety issues have emerged with significant concern by experts and entities worldwide. One of these issues is known as Intentional Electromagnetic Interference (IEMI), where offenders employ high-power electromagnetic sources to maliciously disrupt or damage electronic devices. One of the possible gateways for IEMI attacks targeting the smart grids is the microprocessor-based protection relays. On the one hand, the malfunctioning of these devices can lead to equipment damage, including high-voltage equipment (e.g., power transformers), which represent one of the most high-cost items of energy infrastructure. On the other hand, a possible misleading triggering of these devices could cause cascading effects along the various nodes of the power system, resulting in widespread blackouts. Thus, this study presents the possible recurring effects of IEMI exposure of a typical protection relay used in smart grid substations as part of the SCADA (Supervisory Control and Data Acquisition) system. For this purpose, a test setup containing a smart grid protective unit, a monitoring box, and the device's wiring harness is exposed to radiated IEMI threats with high-power narrowband signals using a TEM waveguide and horn antennas. The effects during the test campaigns are observed by means of an IEMI-hardened camera system and a software developed to real-time monitor the device's fibre optic communication link, which is established according to the IEC 60870-5-105 protocol. The results revealed failures ranging from display deviation to various types of protection relay shutdown. Moreover, the consequences of the identified failures in a power substation are discussed to feed into a risk analysis regarding the threat of IEMI to power infrastructures.
- Article
(2492 KB) - Full-text XML
- BibTeX
- EndNote


The increasing complexity and deployment of Smart Electronic Devices (SEDs) in the power system has enabled the system performance to be improved. Bi-directional flows of energy and information have allowed the insertion of new monitoring, control and operation strategies into the power system, facilitating a future power supply based on distributed and fluctuating renewable energy. In addition, the replacement of electromechanical devices (e.g. protection relays) with single multi-purpose digital units has simplified the commissioning and maintenance of substations, as well as enhanced the control and flexibility of the power system (Jayachandran et al., 2021; Alotaibi et al., 2020).
Concurrently, the increased penetration and reliance on SEDs in the power system has raised the number of potential gateways for terrorist attacks intended to cause electricity interruption and equipment damage. One of the most widespread acknowledged incidents was reported in 2015, where a cyber-attack caused a blackout in western Ukraine, rendering approximately 225 000 customers without electricity (Liang et al., 2016). In addition to cyber-attacks, a threat that is growing in concern by experts and entities around the world is the intentional use of electromagnetic interference to affect SEDs of critical power infrastructure (Oakes et al., 2018).
Known as Intentional Electromagnetic Interference (IEMI), criminals employ electromagnetic sources to intentionally disrupt or damage electronic devices by injecting or radiating disturbance signals. Unlike cyber-attacks, which require SEDs to be directly or at least indirectly connected to a public access network, an IEMI attack does not necessarily require electronic devices to be connected to a network, since the propagation of electromagnetic interference happens through the air or over power and communication cables (Radasky and Bäckström, 2014; Kasmi and Esteves, 2015). Moreover, in contrast to cyber-attacks, where possible attempts of intrusion can be identified and blocked by firewalls, IEMI attacks usually do not leave footprint on the target system and its effect is only felt when the attack has effectively happened (Gurevich, 2017; Sabath and Garbe, 2005).
To ensure acceptable levels of security for the power system, systematic IEMI management processes should also be included in power infrastructure security plans. According to ISO 31000:2009, a generic risk management process should follow a set of activities, which include risk assessment, risk treatment and monitoring, and risk communication. One of the most challenging steps is the risk assessment, given the numerous parameters regarding the target system, the source of interference, the coupling path, as well as the constructional and organizational characteristics of critical infrastructures. The risk analysis is necessary to identify three aspects, which are: the vulnerability of the target system caused by the IEMI environment; classification of the severity of the identified effects; the probability of these effects to happen in the IEMI environment (ISO, 2009).
In order to provide inputs to IEMI risk analysis, this paper presents an experimental IEMI vulnerability study of a typical digital protection relay used in smart grid substations as part of a SCADA (Supervisory Control and Data Acquisition) system. For this purpose, a test setup is developed and exposed to high-power narrowband radiated signals. The effects during the test campaigns are observed by means of an IEMI-hardened camera system and software developed to monitor the device's fibre optic communication link in real-time. The consequences of the protection unit effects observed in the experiments are discussed to feed into risk analysis regarding the IEMI threat to this type of critical power substation device.
The paper is organized as follows: Sect. 2 introduces the measurement campaign, including details of the System Under Test (SUT), the monitoring system for failures diagnosis, and the employed HPEM test environment. Section 3 presents the outcomes of SUT vulnerability study and discusses the potential consequences at a substation level regarding the identified failures. The main conclusions and future works are outlined in Sect. 4.
2.1 Test setup and monitoring system description
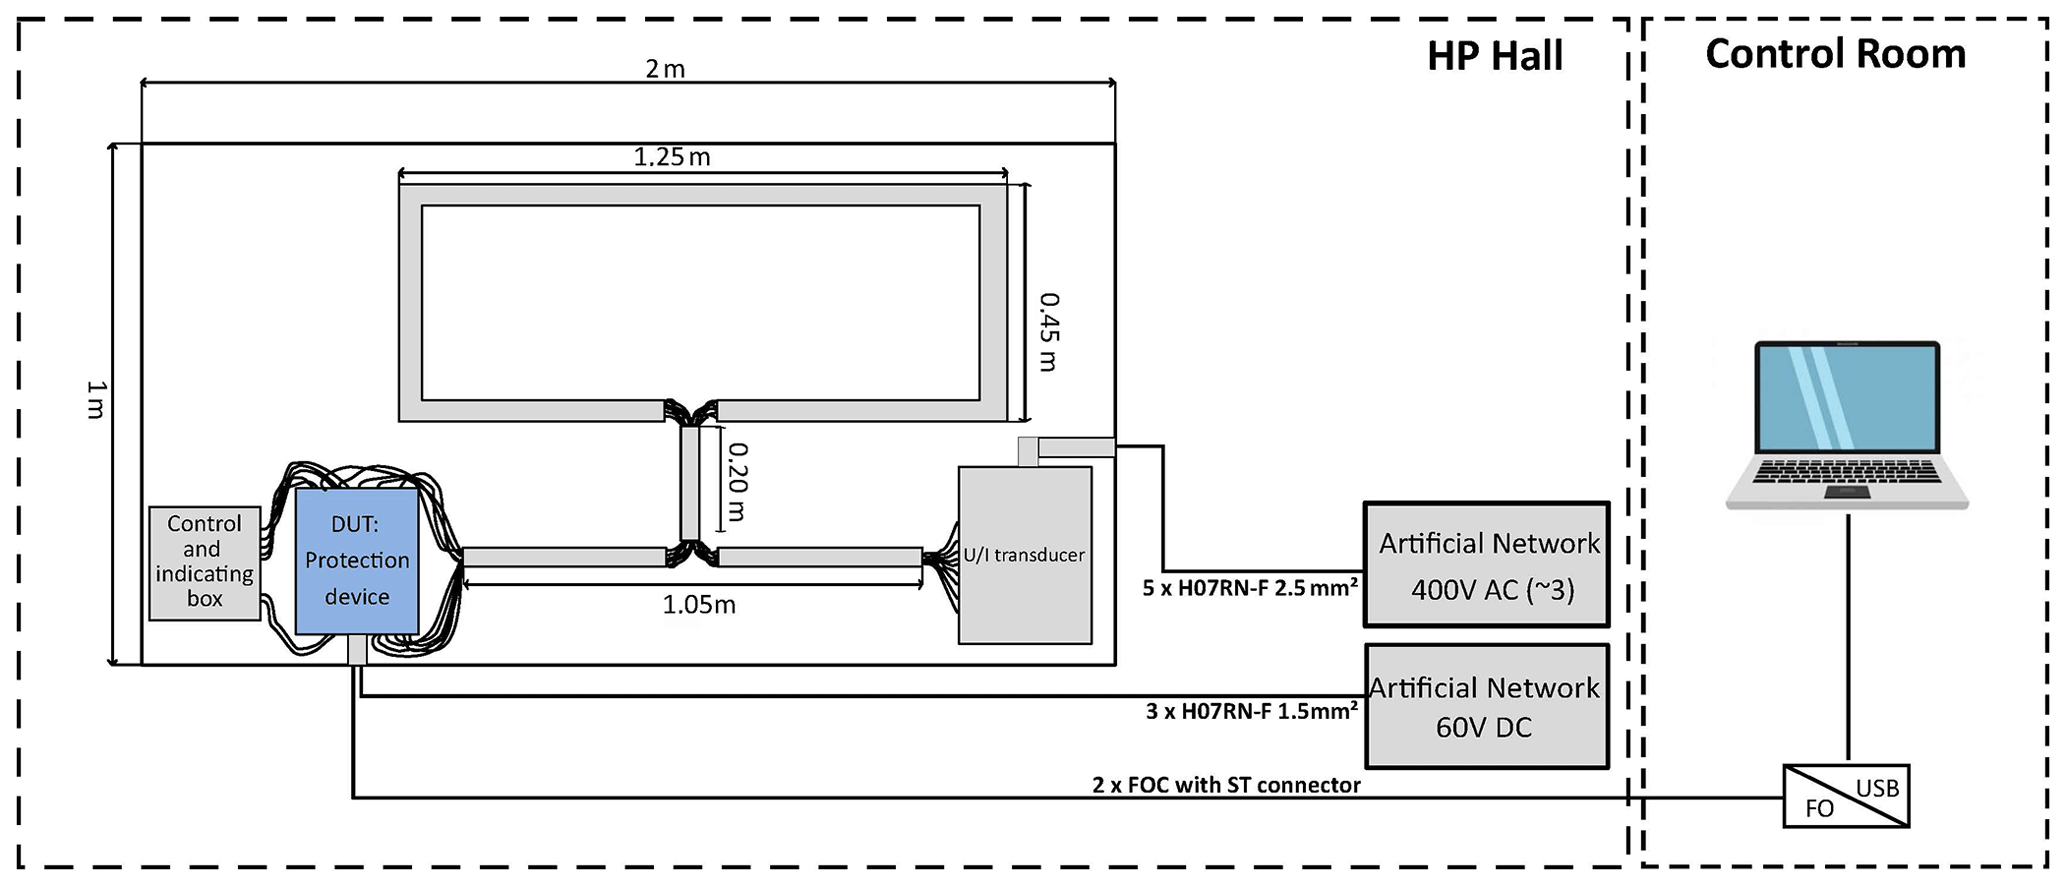
The investigated test setup consists of a Device Under Test (DUT), auxiliary equipment for the normal operation of the DUT as well as an interconnecting and power supply wiring loop (see Fig. 1). This cable topology may exist in real conditions depending on the topology and layout of the substation control rooms. All components are installed on a rigid foam base plate 50 mm thick and 1 m × 2 m in size.
The DUT is arranged on the lower left side of the plate. It is represented by a digital protection relay that performs the protection of substation switch-bays. For this purpose, the device was configured with an overcurrent function, in which a trip occurs as long as one of the measured three-phase currents exceeds a threshold current defined as approximately 90 % higher than the rated current. On the bottom right side of the plate, a transducer is installed to emulate the three-phase current and voltage signals typical of secondary substation systems. These signals are measured by the protection relay by means of a copper wire bundle with a cross-section of 2.5 mm2. This wire bundle has a loop layout at the top of the plate, where the longest and shortest cable sections measure 1.45 and 0.45 m, respectively. Next to the DUT, an auxiliary control and indication box is installed to monitor the status of the protective relay. The red and green LEDs of such box are connected to the relay output, which represents the terminal interface for the power switch. Under the proposed wiring scheme, the green LED states that the power switch is “On” and red that it is “Off”. In case the indicators change from green to red, it means there was an electric signal generated by the protection relay for tripping. Both DUT and grid emulator power supplies are copper wire based and are connected to artificial networks and filters outside the waveguide. The 60 V DC power lines for the SUT are brought from the left side of the test setup, while the 400 V AC lines for powering the grid emulator come from the right side.

A monitoring system for fault diagnosis consisting of two parts is proposed. The first part consists of a set of HPEM-hardened cameras to monitor the DUT display as well as the LEDs of the control and indicating box. The second part is an external laptop to track the output communication link of the digital protection device. For this purpose, a fibre optic connection is established between the DUT and a fibre optic converter positioned outside the waveguide. According to the IEC 60870-5-103 standard (IEC, 1997), which defines the communication from control rooms to protection devices, a software in Python was developed to display the communication status of the DUT in real time. Therefore, during the measurement campaign, an external laptop displayed the current, voltage and power readings, as well as indicated breakdowns in the DUT's communication flow.
2.2 HPEM test environment
For the measurement campaign carried out, field strengths well above the typical EMC requirements of 10 V m−1 were applied. The following test environments were used:
-
TEM waveguide with an appropriate field homogeneity, achieving full illumination of the test setup (IEC, 1997).
-
Horn antenna for illumination of local areas of the test setup.
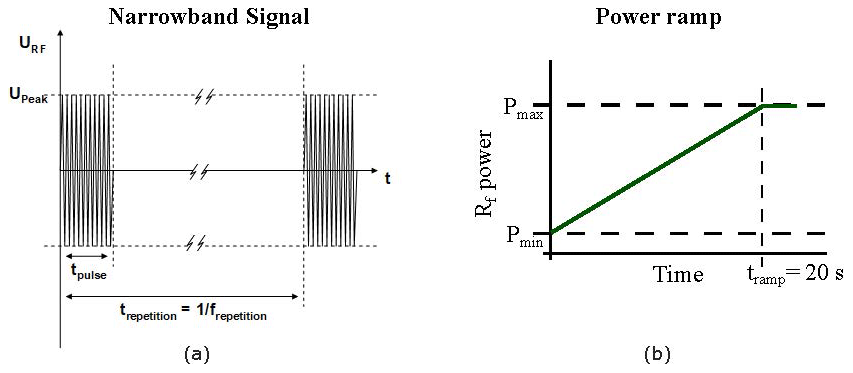
A high-power HPM oscillator operating in the frequency range from 140 to 3400 MHz was used as the power source for the TEM waveguide and the horn antenna. The waveform of the applied pulse is presented in Fig. 2a. It represents a typical narrowband or radar signal with pulse width of 1 s and repetition rate of 1 kHz. To identify failure thresholds, the output power followed a ramp function with duration of 20 s. The power starts with a minimum value, as the HPM oscillator needs some excitation for stable operation, and ends at the maximum achievable value (see Fig. 2b). For the horn antenna tests, Travelling Wave Tube (TWT) power amplifiers were employed, and consequently different size horn antennas were used.
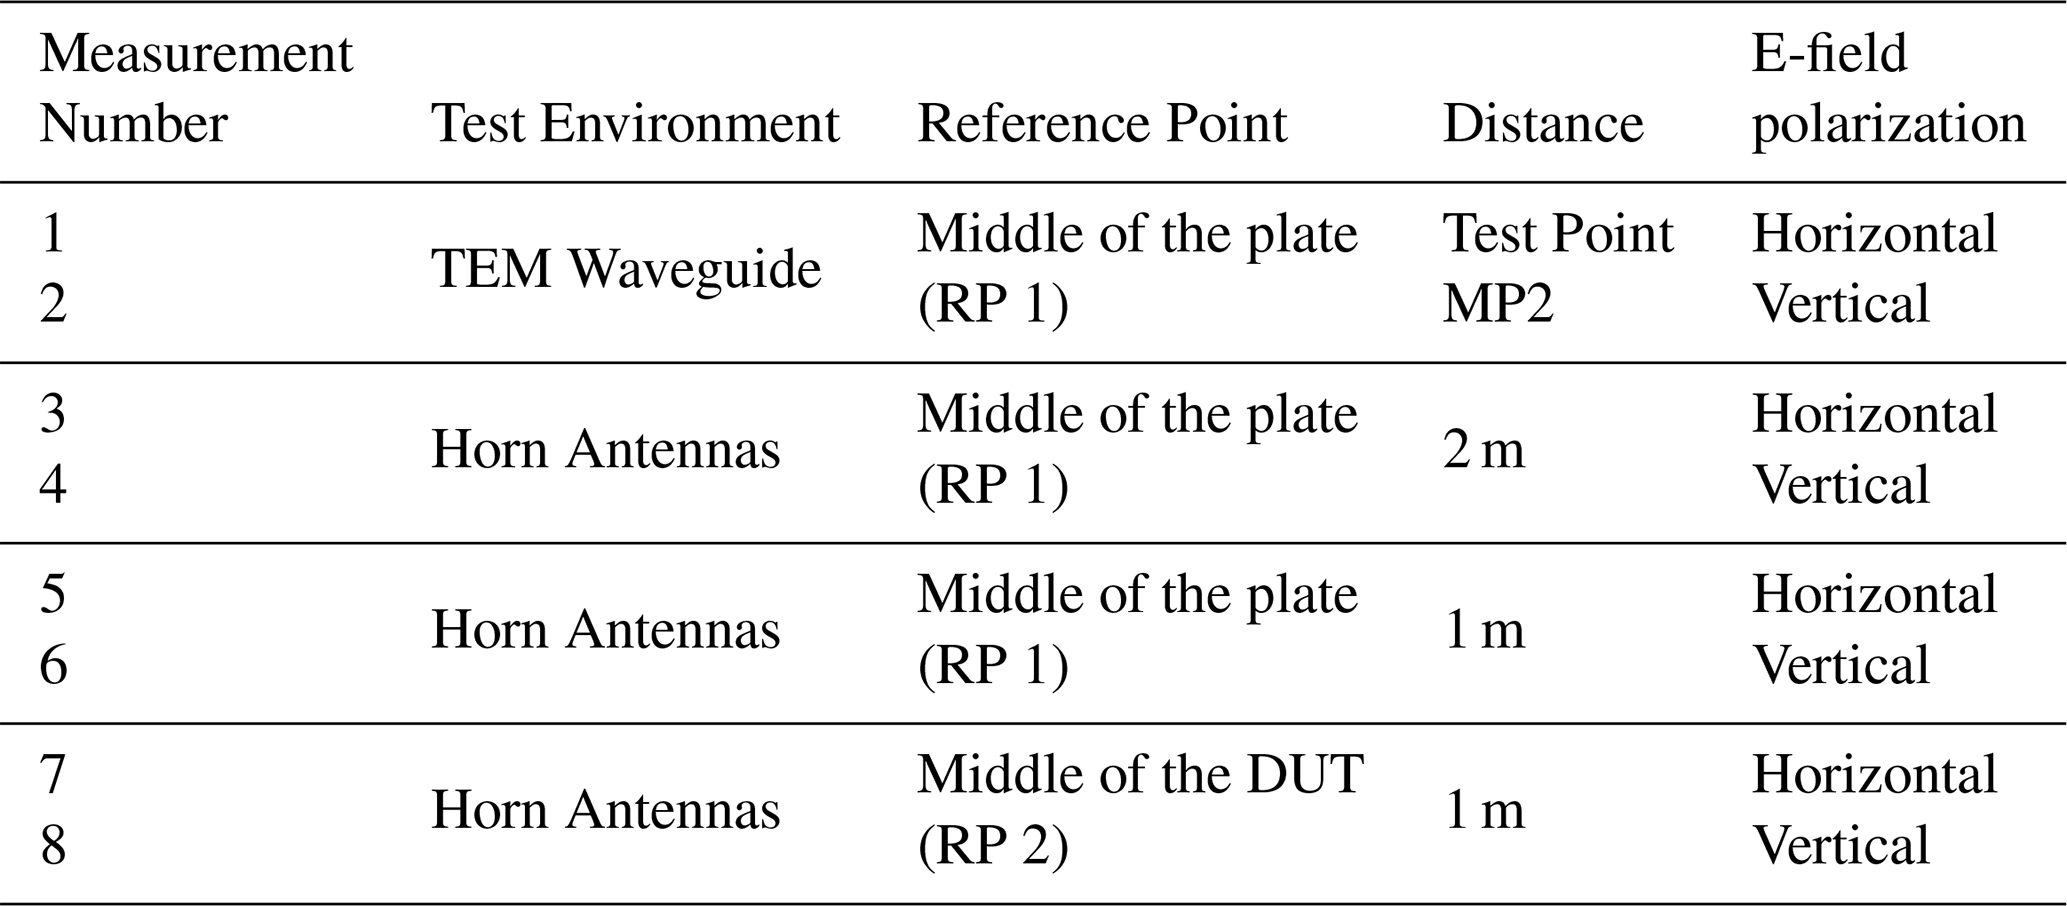
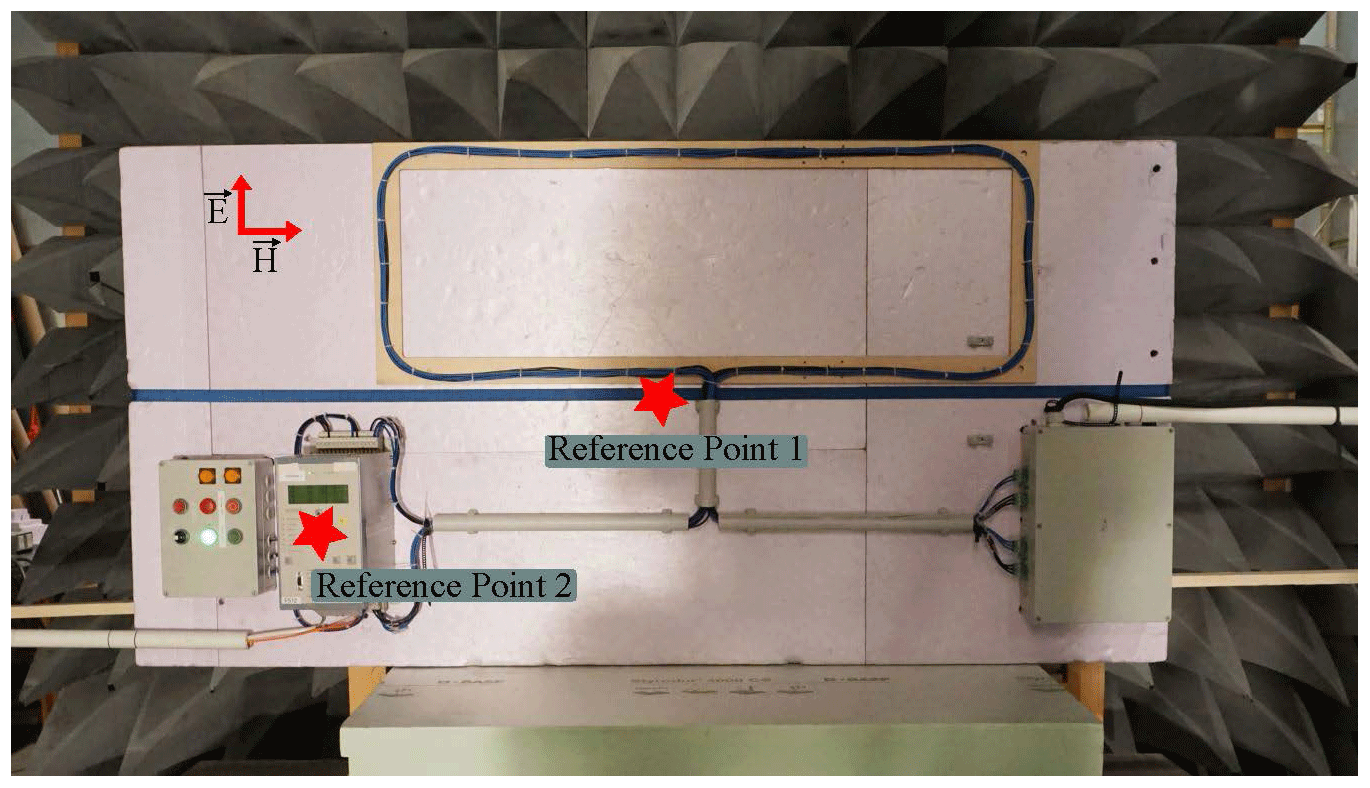
For all test conditions, vertical and horizontal antenna polarization were considered. This was achieved by either rotating the test setup (TEM Waveguide case) or the antenna orientation (horn antenna case). Table 1 details the measurements performed, including the test environment, illumination reference point, distance from the antenna edge to the test setup, and field polarization. Figure 3 illustrates the central illumination reference points of the horn antenna experiments. In the case of TEM waveguide, the test setup was arranged in such a way that the center point of the illuminated area was the middle of the plate (RP 1). In addition, Fig. 3 illustrates the vertical E-field polarization.
The vulnerability plots presented in this paper have a standardized structure. The plots for the TEM waveguide and horn antenna tests employ the same frequency scale, with the horizontal axis representing frequency and the vertical axis representing electric field strength. The electric field strength is presented in arbitrary units (a.u.) due to company confidentiality policies, which require the normalization of the actual field strength values using a confidential factor. The vertical dashes above the horizontal axis indicate the frequencies that were tested, while the grey area represents the field strengths applied for each frequency condition. The markers on the plot indicate the individual failures observed at each tested frequency during the power ramp.
3.1 Tem waveguide
Figure 4 shows the DUT vulnerability plots for horizontal and vertical field polarization when the setup is fully illuminated in TEM Waveguide. It can be seen that no effect was recorded for both cases, indicating that even the maximum field strengths tested were not sufficient to reach the failure thresholds of the protection relay.
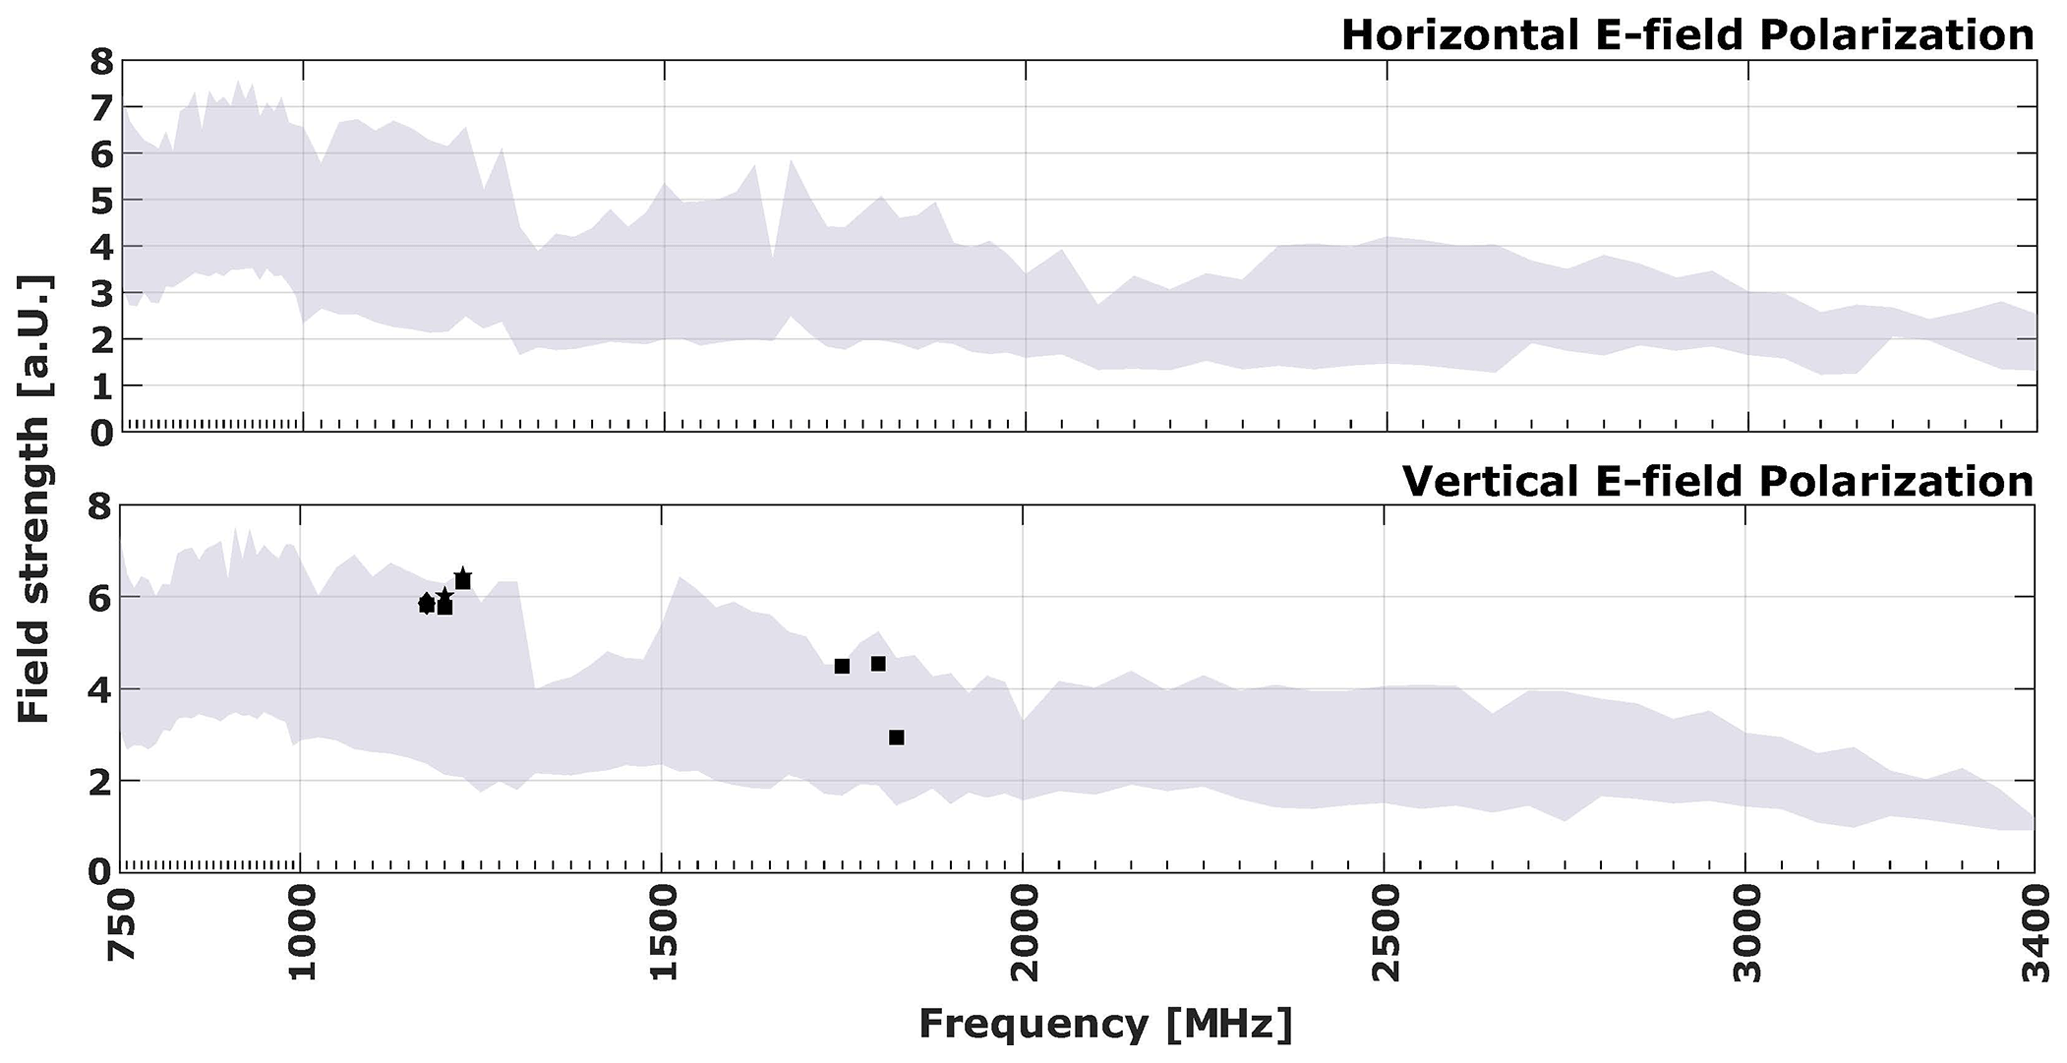
3.2 Horn antennas at 2 m apart from the SUT
Exposing the test setup with a horn antenna by illuminating the central reference point of the test setup at 2 m distance, some failures for the vertical field polarization can be observed as shown in Fig. 5. These failures are clustered in two regions along the tested frequency range. Between the frequencies 1750 to 1850 MHz, some intermittent communication failures are recorded, while in the range 1175 to 1225 MHz, some shutdown failures. In the latter, it is interesting to note that these shutdown failures occurred immediately after communication failures. Additionally, it can be noted that no failures were observed for frequencies below 1 GHz. This may indicate that there was no electromagnetic interference coupling in the test setup wiring for the test conditions employed, or even that there was, but the protection relay inputs were able to filter out the interfering signals.
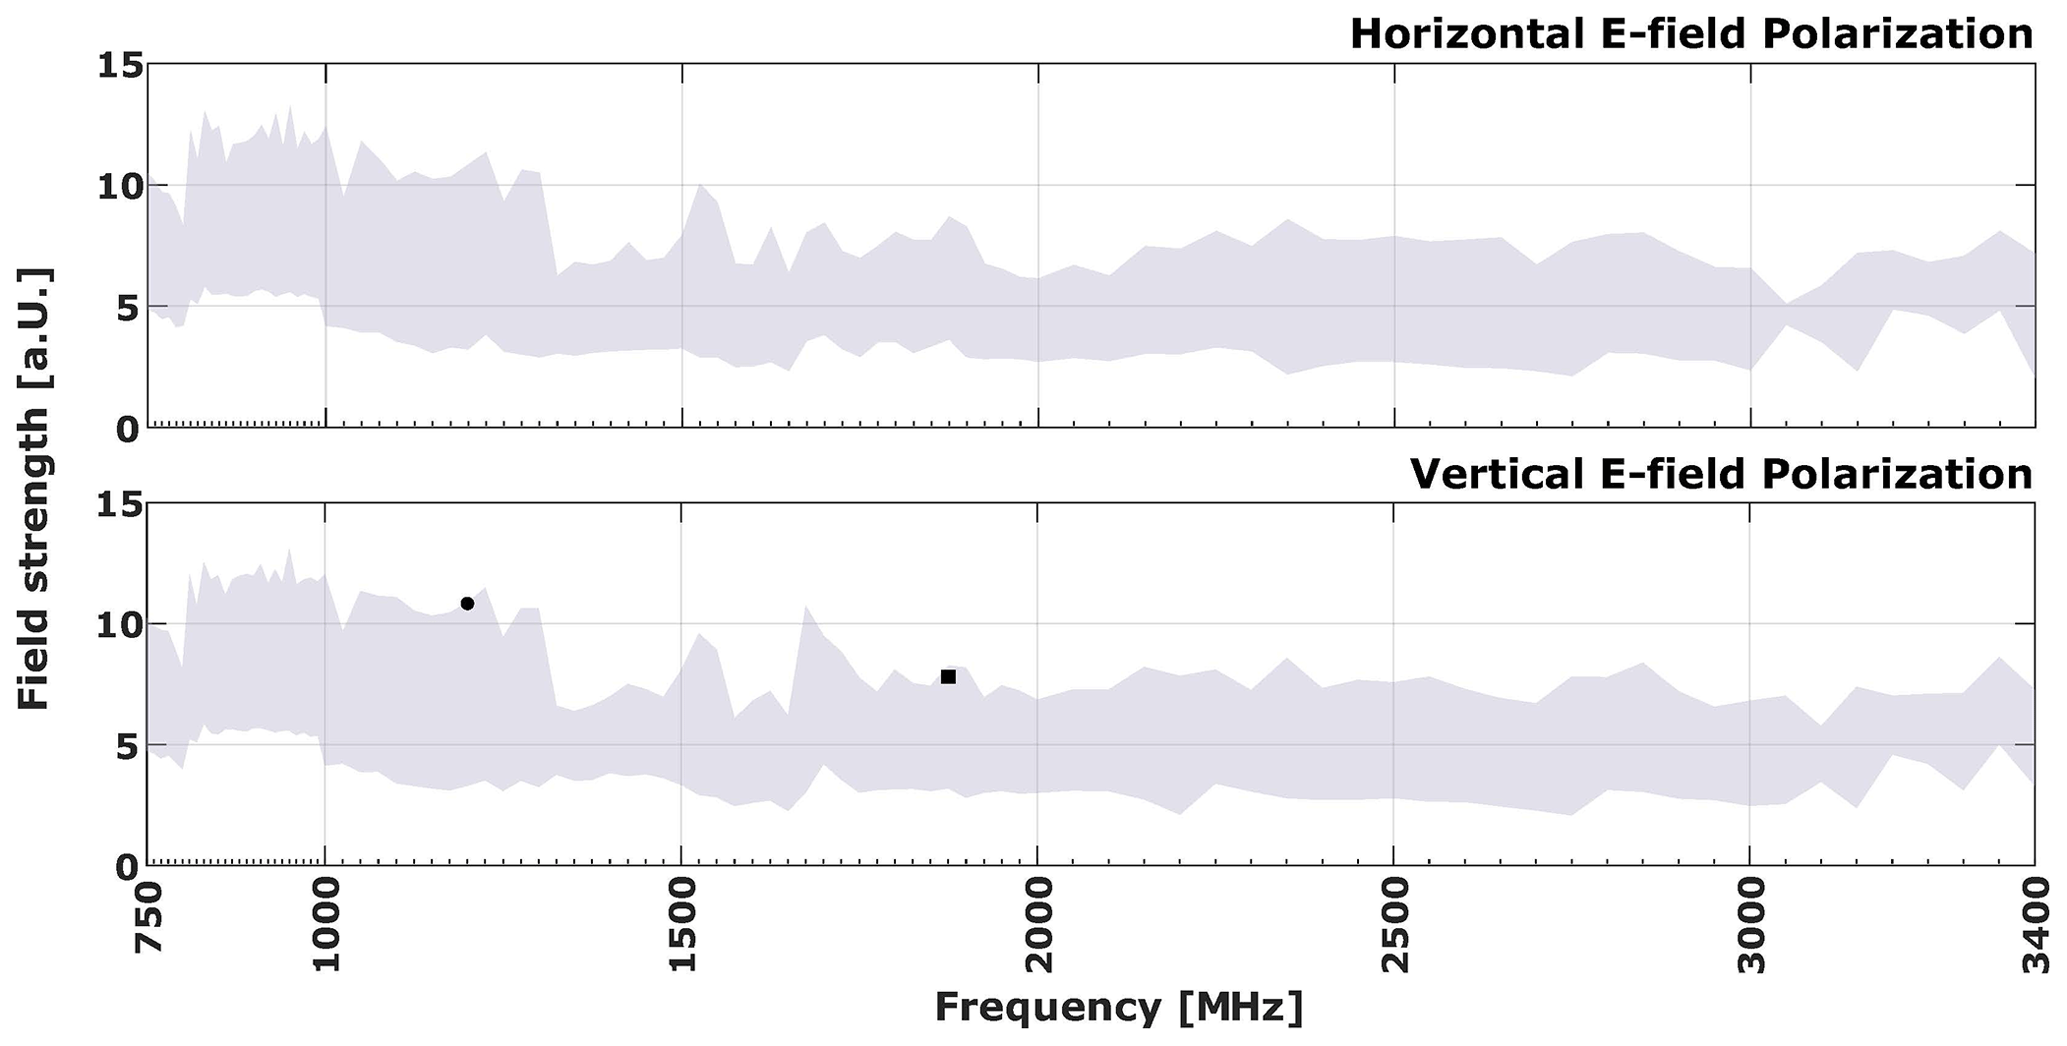
3.3 Horn antennas at 1 m apart from the SUT
According to Fig. 6, considering the same reference point in the middle of the test setup, but now positioning the antenna closer, 1 m away, no failures were observed for the horizontal field polarization. For the vertical polarization, on the other hand, some effects were noticed, but they are fewer compared to the scenario where the antenna was placed at a distance of 2 m. Furthermore, we notice that the shutdown effects observed at 1200 GHz frequency in both distance conditions had different severities. In the 1 m case, the device recovered after the shutdown, while in the 2 m case, operator intervention was required to restore the device operation. This possibly indicates that the failures are rather related to the illumination of the DUT than the loop wiring harness itself.
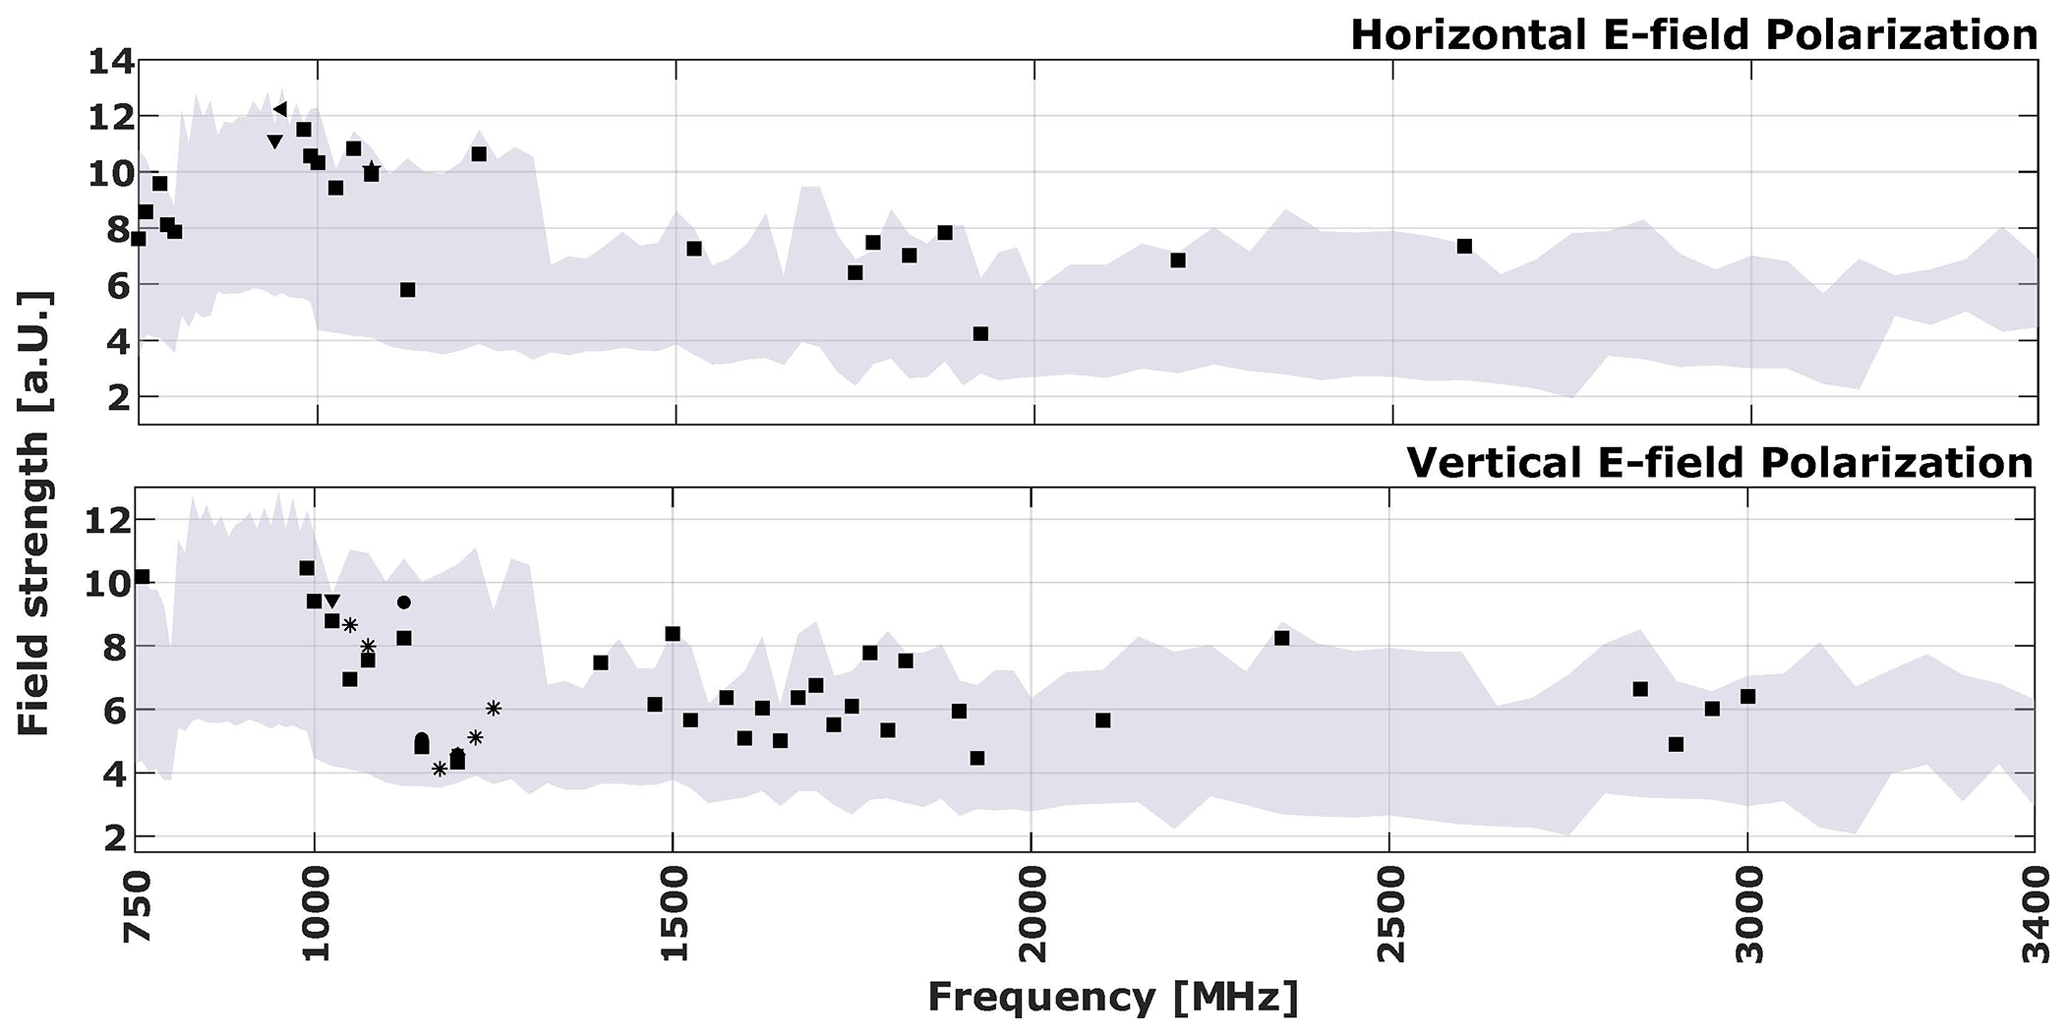
3.4 Horn antennas at 1 m apart from the DUT
As indicated in Fig. 7, by directly illuminating the protection relay from 1 m away, one can observe much more failures not only for the vertical field polarization, but also for the horizontal one. Compared to the other cases presented, there were failures below the 1 GHz frequency, including communication failures and even shutdown failures for the horizontal field polarization, which did not show any failures for the other tested conditions. It could be that the higher coupling interference signals are related to direct lighting in the DUT, but it could also be that the failures are related to coupling in the cables from the indication and control box to the protection relay. One assumption is that manufacturers should expect more interfering signals coming from the power grid than from auxiliary circuits. It is therefore possible that the protection relay inputs of the indicating box wiring are not as resistant to external interference compared to the inputs measuring the currents and voltages coming from the grid emulator. Furthermore, as noted previously, it is observed that most of the shutdown failures recorded between 1 and 1.3 GHz were preceded by communication failures. This behaviour, in turn, could facilitate the development of IEMI detection systems for this type of protection device.
3.5 Consequence analyses
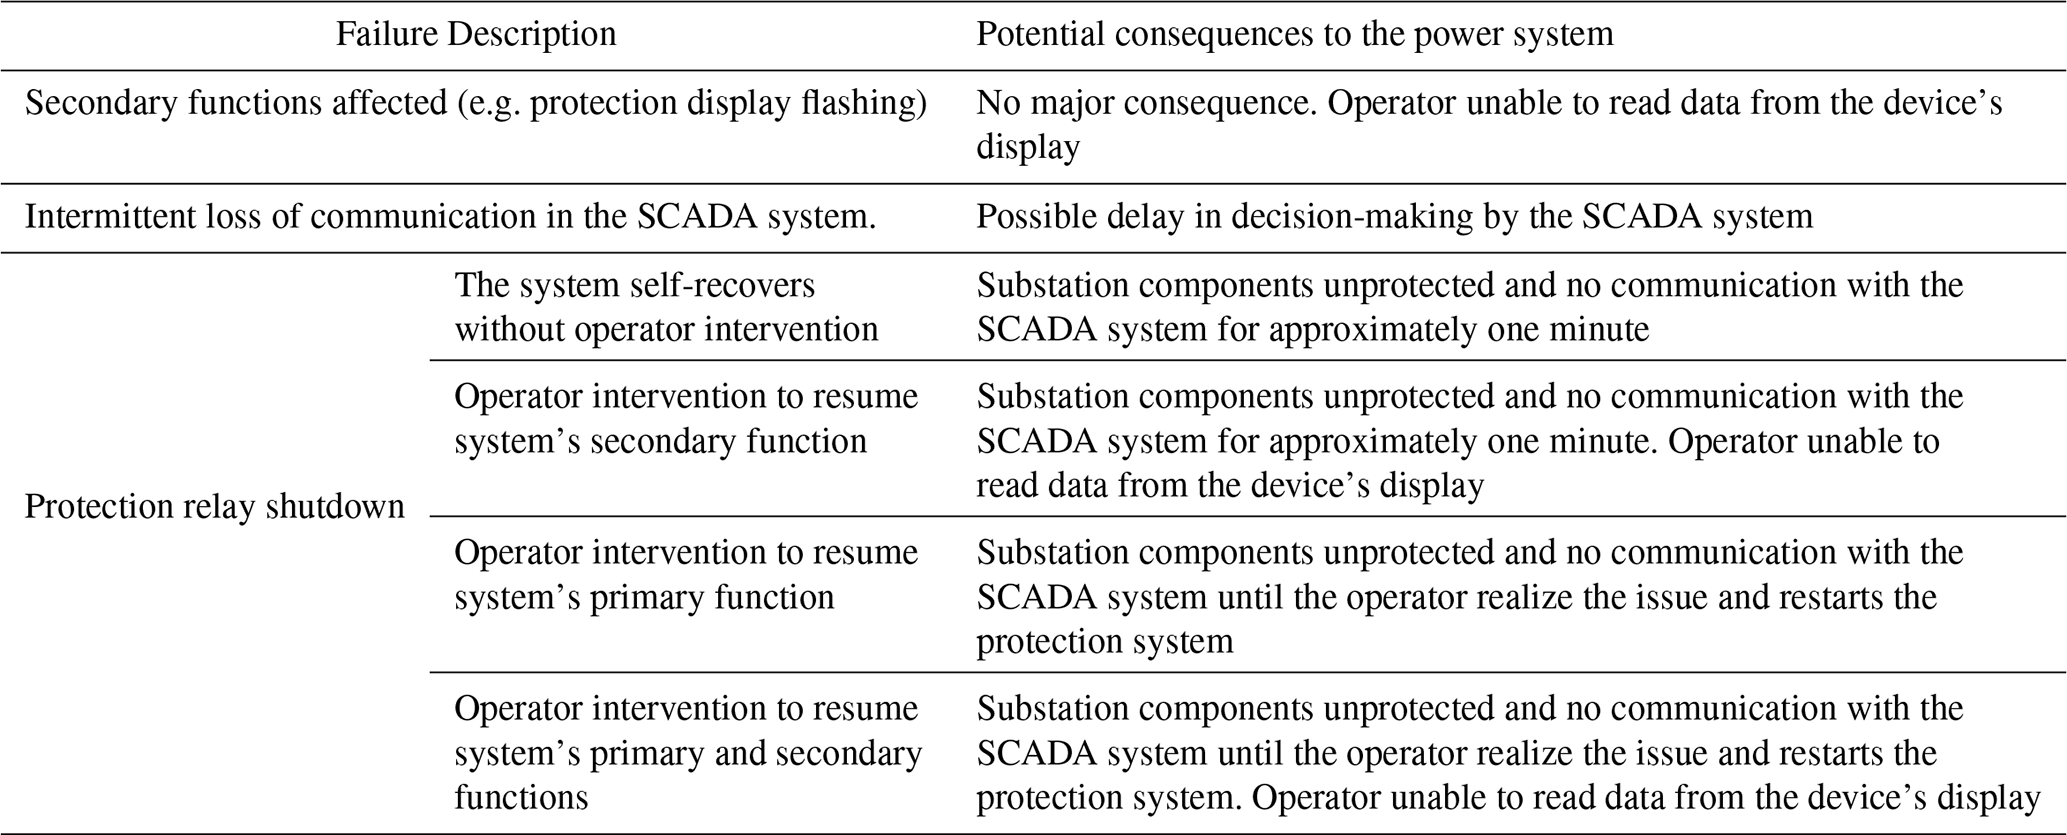
The IEMI risk assessment involves the identification of the vulnerability of the target system, including the determination of the frequencies and field strength thresholds of upsets. Section 3 introduced the identified failures of the protection relay in the measurement campaign carried out. They range from LED display deviations to different types of shutdown of the DUT. For the test conditions employed, relay false trip events were not identified. This failure would be critical as an intentional device trip could cause the substation or part of it to disconnect, and even trigger a blackout event.
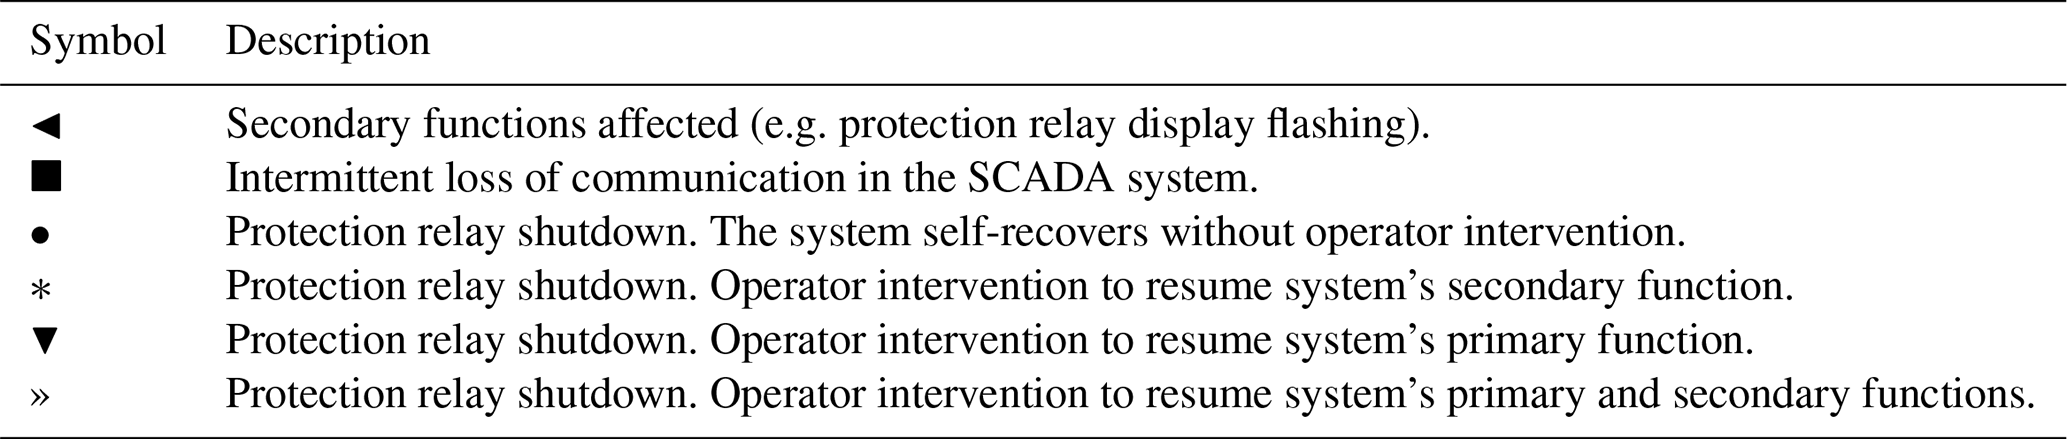
However, several shutdown events were identified in the test campaign. These were divided into four types, where the variant factors are the device reset time (either automatic or manual by the operator) and the follow-up of the shutdown by malfunctions on the LED display. Regardless of the type, these faults could represent a high degree of criticality from the point of view of power substation protection. Deactivation of the protection relays due to a shutdown failure would leave the high-voltage equipment unprotected and vulnerable to permanent damage. This would occur in the event of power grid contingencies caused by external factors (e.g. adverse weather conditions, fire and human error in the execution of maintenance services) or even by the launching of explosives into the substation infrastructure (e.g. incoming power lines) by the very criminals responsible for the IEMI attack.
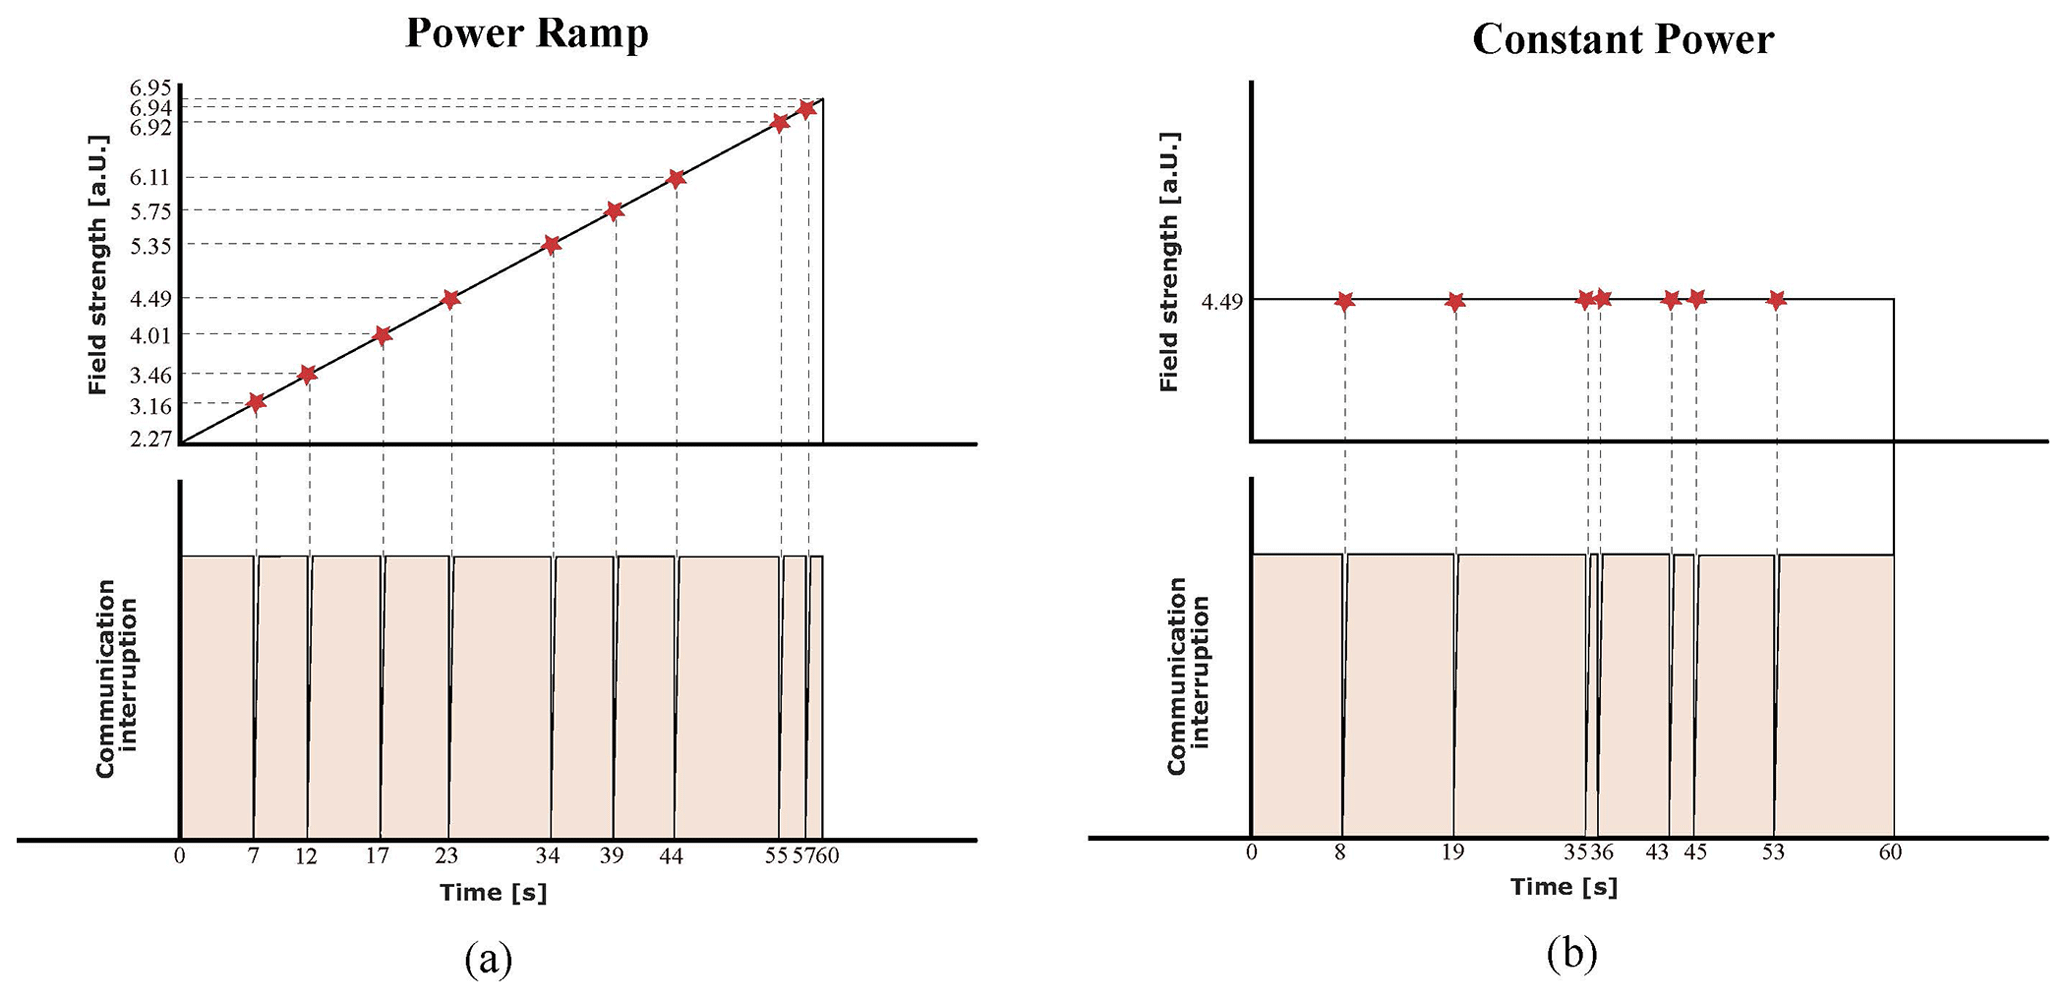
Regarding the intermittent communication failure of the protection relay, further investigations should be carried out to find out if the intermittent transmission of data packets during the attack exposure would degrade the performance of the SCADA system that receives such information. However, this behaviour is expected to at least delay the decision making of the management system at critical instances when the device is intended to act. The pattern of this failure was observed not only for ascending ramps of the interfering signal power, according to the methodology employed in this study, but also for constant power conditions, as illustrated in Fig. 8. For both test procedures, the horn antenna was placed 1 m away from the SUT in its vertical field polarization (Measurement number 9) and the frequency was set to 1750 MHz.
Table 3 summarises the analysis of the possible consequences in a power substation regarding the failures verified in the test campaign.
This paper presented a vulnerability study involving a digital protection relay enabled for smart grid applications. A test setup as well as a monitoring system for fault diagnosis was proposed. An HPM oscillator operating in the frequency range from 140 to 3400 MHz was used as the interference source. To achieve full and local illumination of the SUT, a TEM waveguide and horn antennas were employed, respectively. Furthermore, vertical and horizontal E-field polarizations were considered for all measurements carried out.
The results revealed failures of the protection relay in several regions over the tested frequency range only for the SUT's local illumination conditions. These failures included disturbance in the DUT secondary functions, intermittent loss of communication and different shutdown variations. The results indicated that the failures are not related to electromagnetic coupling into the test setup wiring loop, as no effects were observed for frequencies lower than 1 GHz when the horn antenna illumination was covering the wiring loop. Most of the failures were related to direct illumination of the DUT and possibly to the coupling into the cables that connects the control and indication box to the protection relay. Many shutdown failures were preceded by communication failures, which may represent a useful pattern for the development of IEMI attack detection systems for such DUT type.
Failures that could trigger the occurrence of blackout events were not identified for the test conditions carried out. However, the consequences of the identified shutdown failures could represent a high risk from the perspective of power substation protection. In such scenarios, deactivation of the protection relays would leave the high-voltage equipment unprotected and vulnerable in cases of contingencies in the power system.
As future steps, measurement campaigns will be carried out for frequencies below 750 MHz in order to identify potential failures due to coupling into the cabling harness. In order to identify the coupling path of the SUT, transfer function measurements will be performed covering the critical frequencies identified in this study. Finally, with the inclusion of a telecontrol device in the SUT, it will be investigated how the intermittent pattern of communication failures could affect the management decision-making part of the SCADA system.
No data sets were used in this article.
The lead author led the experiments and wrote the journey paper. The others helped in the final revision process of the paper.
The contact author has declared that none of the authors has any competing interests.
Publisher’s note: Copernicus Publications remains neutral with regard to jurisdictional claims in published maps and institutional affiliations.
This article is part of the special issue “Kleinheubacher Berichte 2021”.
The research leading to these results has received funding from the European Union´s Horizon 2020 research and innovation programme under the Marie Sklodowska-Curie grant agreement No 812790 (MSCA-ETN PETER). This publication reflects only the authors’ view, exempting the European Union from any liability. Project website: http://etn-peter.eu/ (last access: 18 July 2023). Moreover, assistance provided by Michael Suhrke, Thorsten Pusch, Sven Ruge, Benjamin Jörres and Tobias Mallmann (all from Fraunhofer INT) was greatly appreciated.
This research has been supported by the European Commission, Horizon 2020 Framework Programme (PETER (grant no. 812790)).
This paper was edited by Lars Ole Fichte and reviewed by two anonymous referees.
Alotaibi, I., Abido, M. A., Khalid, M., and Savkin, A. V.: A comprehensive review of recent advances in smart grids: A sustainable future with renewable energy resources, Energies, 13, 6269, https://doi.org/10.3390/en13236269, 2020. a
Gurevich, V.: Protection of substation critical equipment against intentional electromagnetic threats, John Wiley & Sons, ISBN 978-1-119-27143-7, 2017. a
IEC: 60870-5-103 – Telecontrol equipment and systems – Part 5-103: Transmission protocols – Companion standard for the informative interface of protection equipment, 1–206, 1997. a
IEC: 61000-4-20:2010 – Electromagnetic compatibility (EMC) - Part 4-20: Testing and measurement techniques – Emission and immunity testing in transverse electromagnetic (TEM) waveguides, 1–206, 1997.
ISO: Risk management–Principles and guidelines. International Organization for Standardization, 15–21, 2009. a
Jayachandran, M., Reddy, C. R., Padmanaban S., and Milyani A. H.: Operational planning steps in smart electric power delivery system, Sci. Rep., 11, 1–21, https://doi.org/10.1038/s41598-021-96769-8, 2021. a
Kasmi, C. and Esteves J. L.: IEMI Threats for Information Security: Remote Command Injection on Modern Smartphones, p. 1-206, IEEE T. Electromagn. C., 57, 6, https://doi.org/10.1109/TEMC.2015.2463089, 2015. a
Liang, G., Weller, S. R., Zhao, J., Luo, F., and Dong, Y. D.: The 2015 Ukraine blackout: Implications for false data injection attacks, IEEE Trans. Power Syst., 32, 3317–3318, https://doi.org/10.1109/TPWRS.2016.2631891, 2016. a
Oakes, B. D., Mattsson, L. G, Näsman, P., and Glazunov, A. G.: A Systems‐Based Risk Assessment Framework for Intentional Electromagnetic Interference (IEMI) on Critical Infrastructures, Risk Anal., 8, 1279–1305, https://doi.org/10.1111/risa.12945, 2018. a
Radasky, W. and Bäckström, M.: Brief historical review and bibliography for Intentional Electromagnetic Interference (IEMI), 2014 XXXIth URSI General Assembly and Scientific Symposium (URSI GASS), Beijing, China, 1–4, https://doi.org/10.1109/URSIGASS.2014.6929517, 2014. a
Sabath, F. and Garbe, H.: Assessing the likelihood of various intentional electromagnetic environments the initial step of an IEMI risk analysis, 2015 IEEE International Symposium on Electromagnetic Compatibility, Dresden, Germany, 3, 1083–1088, https://doi.org/10.1109/ISEMC.2015.7256319, 2015. a