 | 13 Mar 2025
Modeling Ground-Wave Propagation Across Sea Ice for Radio Navigation Applications
Lars Grundhöfer
Filippo Giacomo Rizzi
Stefan Gewies
The ground-wave signals of terrestrial radio navigation systems, which operate in the medium and low frequency band, are sensitive to changes in the electrical parameters of the Earth's surface between the transmitter and receiver. Sea ice affects the electrical parameters of the sea and leads to an additional signal phase delay compared to the propagation over salt water. To ensure the uniform performance of the navigation receivers for these systems throughout the year, the impact of sea ice on the signal has to be known. A challenge here is the high spatial and temporal dynamic of sea ice in some regions. Earth observation data can be used to obtain information regarding the world-wide sea-ice coverage and further electrical ground parameters. In this paper, our proposed model for the ground-wave propagation and Copernicus data are used to compute the impact of varying conditions on the signal propagation. Simulation results for a real-world scenario show that the signal propagation delay caused by sea ice can lie in the order of 20 ns with respect to sea water.
- Article
(8681 KB) - Full-text XML
- BibTeX
- EndNote


Terrestrial radio navigation systems are important components for resilient Positioning, Timing, and Navigation (PNT) in maritime applications. Both modern and historical terrestrial radio navigation systems often operate in the medium frequency (MF) and low frequency (LF) range. The signals propagate as ground waves, following the curvature of the Earth along the surface. The signal is subject to a delay depending on the electrical parameters of the ground, which is generally regarded as signal delay compared to the propagation in the vacuum. The change of the electrical ground parameters can cause an increase or decrease of the delay. One example is sea ice, which shows a highly temporal and spatial variation in some regions and different electrical parameters than sea water. It was shown (Hill and Wait, 1981a, b) that the formation of sea ice causes a significant increase in the signal delay after formation. This effect has to be considered to keep the navigation receiver performance on the same level. Because the signal delay is directly related to the phase of a continuous-wave signal, we also use the term phase delay in the paper. Due to the dynamics of ice formation in the affected regions, predicting signal phase delay over frozen sea areas is challenging. So far, it has been modeled in a one-dimensional scenario by Hill and Wait (1981a, b) but not in two dimensions based on realistic sea-ice maps derived from Earth observation products in order to make theoretical statements regarding its influence on signal propagation for navigation applications and to evaluate the associated impacts on the performance of respective systems.
A contemporary and prominent example for terrestrial radio navigation systems is the medium frequency Ranging Mode (MF R-Mode) system, which uses existing maritime differential GPS beacons and operates in the MF band between 283.5 and 325 kHz. To obtain ranges, the phase of two continuous-wave aiding carriers that accompany the legacy signal is estimated (Johnson and Swaszek, 2014; Swaszek et al., 2014; Johnson et al., 2017; Grundhöfer et al., 2022). The position is determined by estimating the ranges to at least three MF R-Mode transmitters (Johnson et al., 2020; Grundhöfer et al., 2021).
Ground-wave phase delays, i.e. signal propagation delays with respect to vacuum, are a major source of distortion in LF and MF radio navigation systems. The signal attenuation and phase delay with respect to the propagation conditions of a signal on a perfectly conducting half space depends on the electrical conductivity σ and the relative dielectric permittivity ϵr of the underlying medium. Wait (1998) presents a summary of the subject that has been under investigation for decades. The attenuation and phase delay can be modelled analytically for propagation paths of mixed electrical characteristics across large, two-dimensional areas (Last et al., 2000; Blazyk and Diggle, 2007; Pachon-Garcia, 2015; Hehenkamp et al., 2023a).
For MF R-Mode, the range distortion caused by uncompensated phase delays can lie in the order of 100 m and can be corrected using the Atmospheric and Ground Wave Delay Factor (AGDF) (Hehenkamp et al., 2024; Rizzi et al., 2022). The prediction of the AGDF has been investigated and implemented for static ground-conductivity maps such as the ITU World Atlas of Ground Conductivities (ITU-R, 2015) and more detailed soil-texture maps (Hehenkamp et al., 2023b) that account for different soil-texture types in the areas of interest. In comparison, dynamic changes of ground electrical parameters with regard to ground-wave propagation have been described for the variables of soil surface temperature and soil moisture (Pu et al., 2022) but have not been modelled for large-scale 2D predictions. Although there are theoretical and experimental studies that investigate the influence of sea ice on ground-wave propagation (Hill and Wait, 1981a, b), the effect has not yet been described using real-world sea-ice-coverage information derived from Earth observation data.
In this paper, we introduce a new approach to modelling the ground-wave phase delay on a large geographical area that is regularly affected by sea-ice cover using satellite-based remote sensing data products. After performing an analysis of the sensitivity of the ground-wave phase delay of the MF R-Mode signal with respect to sea ice, we use the approach to compute the delay across sea ice in a real-world scenario and study the impact of sea ice on the receiver performance in a selected area of interest for maritime traffic.
The paper is organized as follows: Sect. 2 introduces the employed propagation model that is used to calculate the phase delay, presents the method that is used to describe sea ice within the model and analyses the sensitivity of MF R-Mode phase delays with regard to sea ice. In Sect. 3, a description of the methodology that is used to compute the Earth's surface ground electrical parameters in a sea-ice-covered region is given. An area with significant sea-ice coverage is chosen and two data sets from different time periods with different sea-ice conditions are introduced. Section 4 presents the results of the simulation of ground-wave propagation in the selected area and discusses the influence of sea ice on the signal and the system performance. Section 5 concludes the paper.
MF R-Mode uses a time-of-arrival approach to perform ranging. This means the signal propagation time is estimated from the time of reception and the time of transmission. The range is calculated with the help of the estimated propagation speed of the signal which has to consider the electrical ground parameters. Incorrect assumptions for the electrical ground parameters will cause a deviating propagation speed which appears as an additional signal phase delay (positive or negative). Though the attenuation or gain in signal strength is also an important factor, this section focuses on the computation of the ground-wave phase delay with respect to the propagation conditions of a signal on a perfectly conducting half space.
The electric field of a ground-wave can preferably be described as the product of the reference field of a vertical electric dipole source of moment above a perfectly conducting plane and an attenuation function that accounts for amplitude loss and phase delay of the wave caused by the finite conductivity of the ground, the propagation through atmosphere and the curvature of the Earth. To simulate ground-wave propagation and compute the attenuation and phase delay of the signal on a large 2D area, the authors developed a software framework that can be used to study the ground-wave phase delay on the basis of a predefined Ground Electrical Parameter Database (GEPD) (Hehenkamp et al., 2023a) and that is being used to predict the AGDF to compensate these delays in the MF R-Mode receiver (Hehenkamp et al., 2024). The framework employs the analytical solution for the electromagnetic field of the ground wave on a spherical Earth presented by Wait (2013), in particular by using the solution of Spies and Wait (1966) for shorter distances and employing the residue series solution for larger distances as shown by DeMinco (1999) on a reference surface representing a pure sea-water path. The GEPD contains the complex surface impedance of a region at the respective signal frequency and is sampled along a set of radial great circle paths from the transmitter. A Digital Elevation Model provides terrain elevation data. Afterwards, the integral equation solution (Ott et al., 1979) is solved numerically for each radial path according to the method of Monteath (1978).
The resulting values of the complex attenuation function W are exported as georeferenced raster image and can be used to obtain the absolute ground-wave attenuation G(r)=abs[W(r)] and phase delay as a function of distance r. The software framework allows the computation of W over layered ground, such as thin forest slabs on soil or ice on water. This enables the composition of a GEPD consisting of layers with different thickness and electrical characteristics. As shown by Pu et al. (2022), the approach is well suited for the description of dynamically changing and complex environments. The approach is used to describe sea ice as a thin dielectric layer on top of sea water and solve the integral equation along the layered, mixed propagation path.
2.1 Computation of phase delay with the help of Earth observation data
A GEPD is calculated for land and sea-water areas separately. Figure 1 depicts a flow chart of the computation process consisting of three steps: input, ground-wave computation and output.
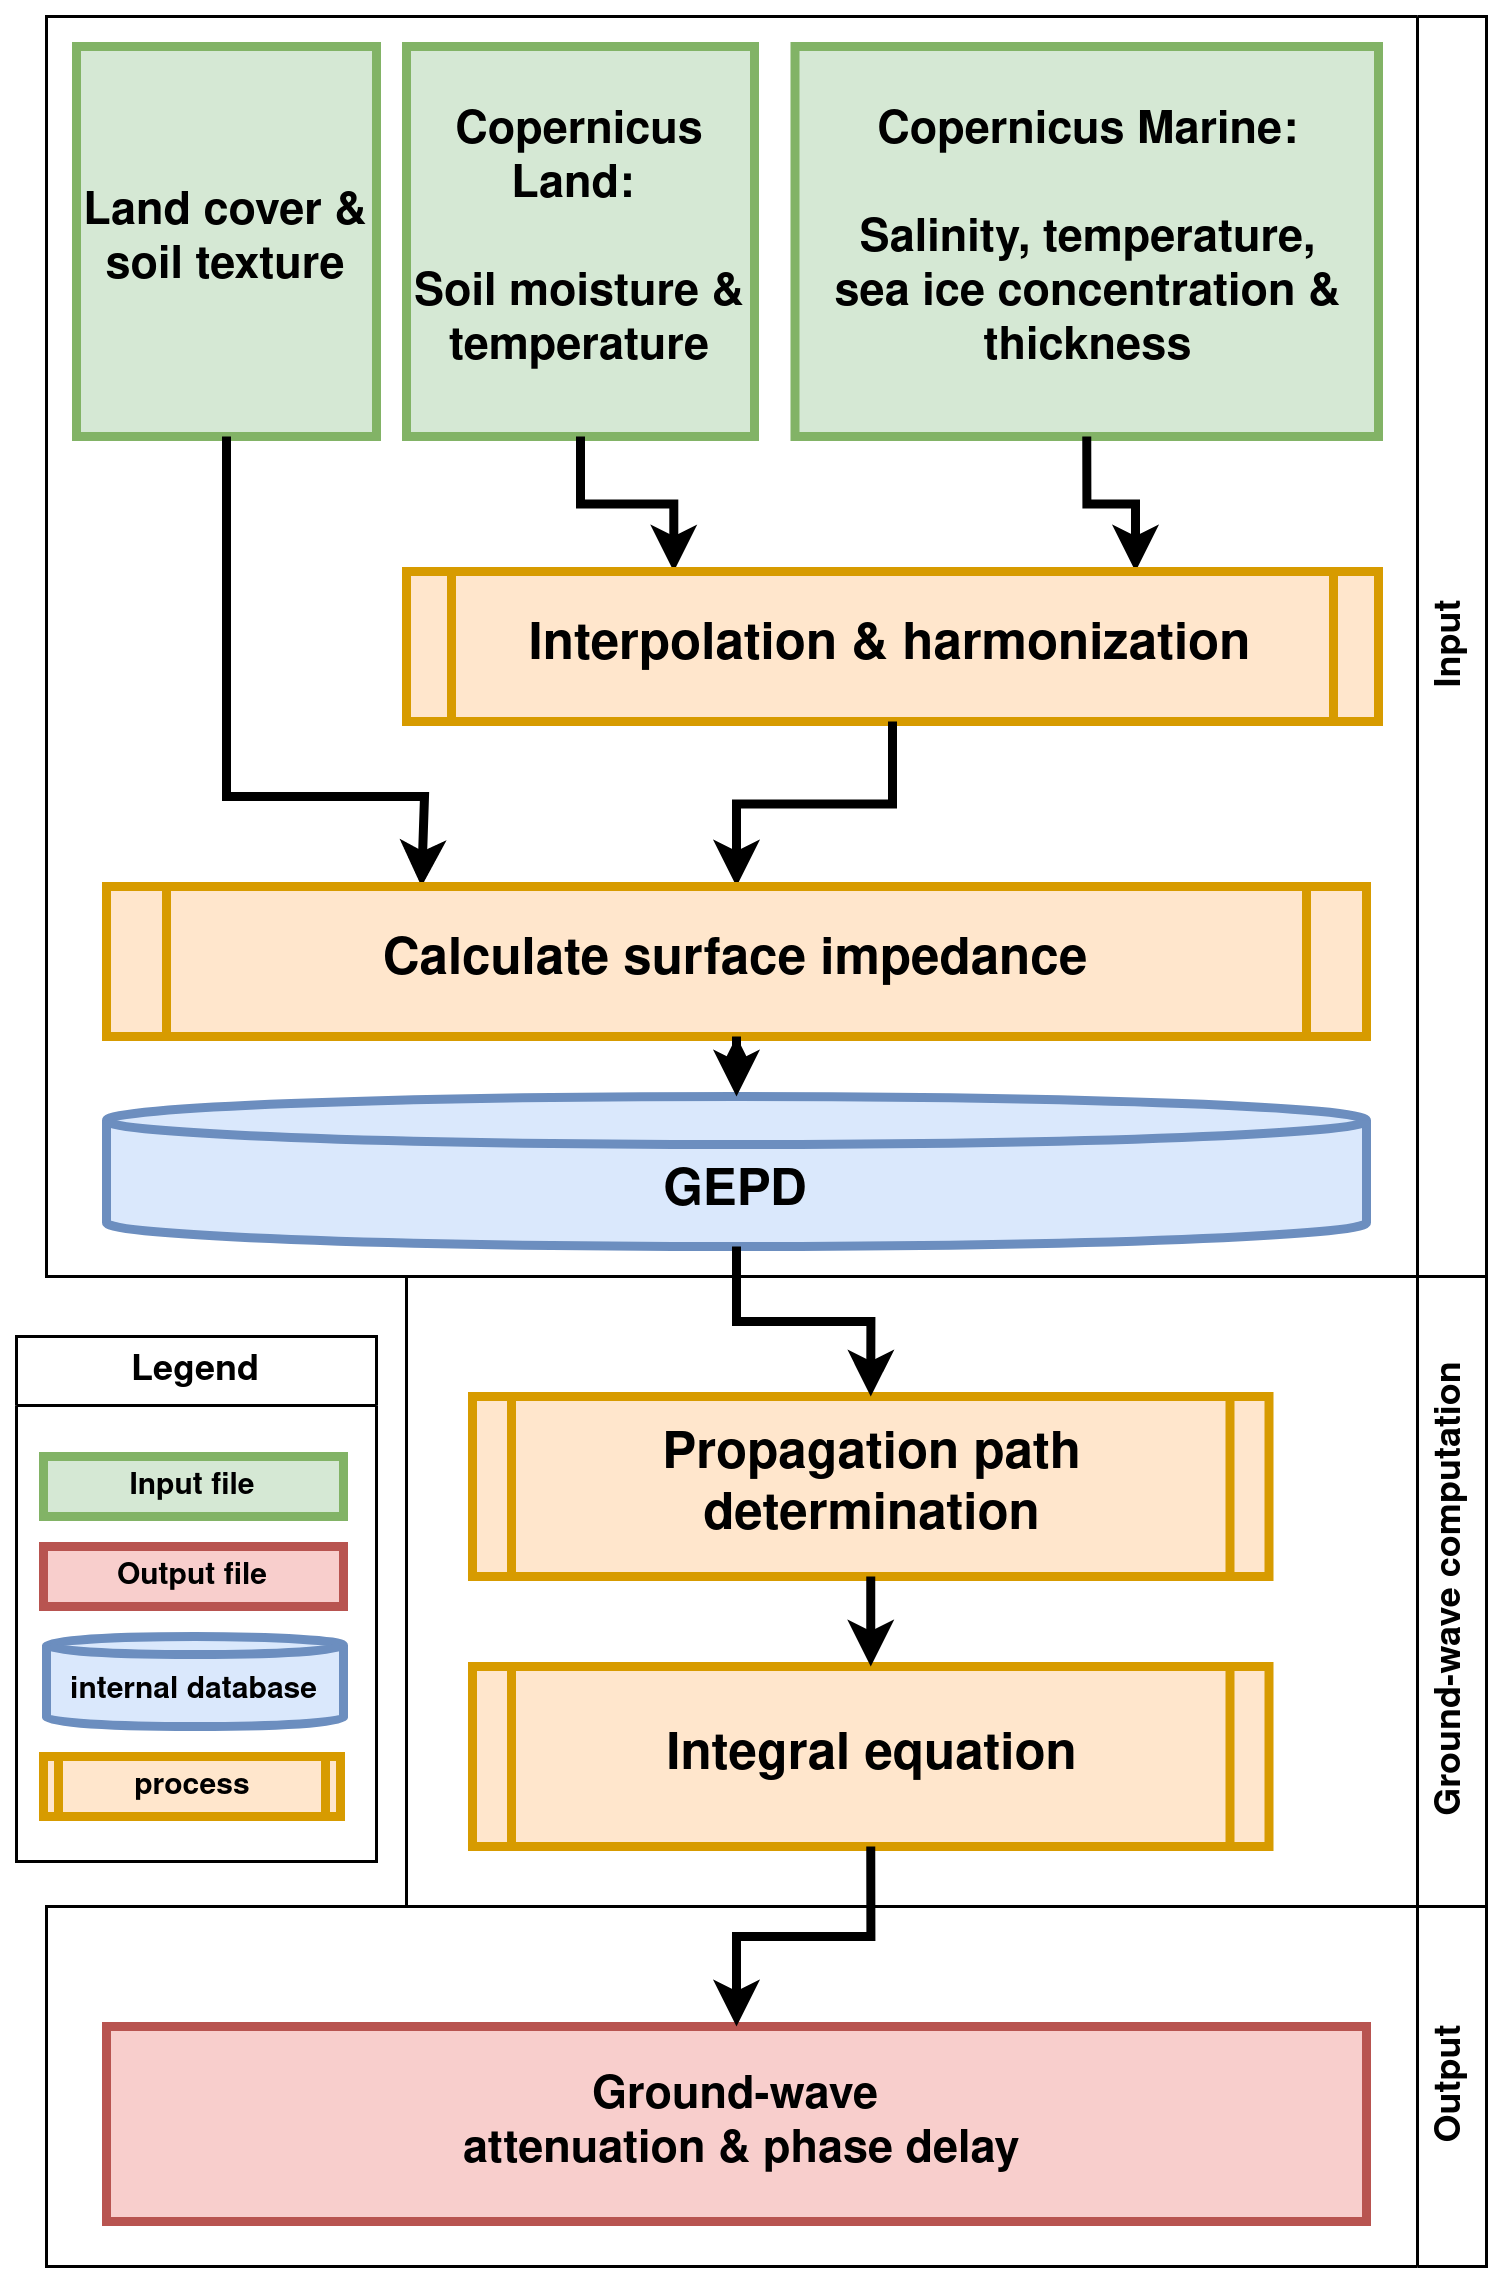
Figure 1Flow chart of the computation process showing the consecutive steps: input, ground-wave computation and output.
In the input step, Earth observation data is obtained and loaded. The differentiation of land and sea areas is based on the Copernicus global land cover data set (Buchhorn et al., 2020) using a geometrical resolution of 100 m×100 m per raster cell. For land areas, soil-texture information obtained from the global FAO HWSD (FAO, 2023) is combined with land surface temperature (Copernicus Global Land Service, 2023a) and soil water-index data (Copernicus Global Land Service, 2023b). For sea water, the sea surface temperature, salinity, sea-ice area fraction and sea-ice thickness are obtained from the data sets “Global Ocean Physics Analysis and Forecast” (Copernicus Marine Service, 2023a) and “Global Ocean Physics Reanalysis” (Copernicus Marine Service, 2023b). Since the resolution of this data set is of a degree of latitude and longitude, the upsampling and interpolation required to harmonize it with the land cover map leads to an uncertainty. In Fig. 1, this step is represented by the “Interpolation and harmonization” process. The sea-ice area fraction does not contain any information on the exact distribution and edges of the sea-ice cover within a raster cell. Therefore, the data upsampling is linked to a statistical process that distributes the sea-ice layer across 100 m×100 m cells randomly using the sea ice area fraction as a random variable.
After the interpolation and harmonization process, the surface impedance is calculated for land and sea areas as shown in Fig. 1, using the aforementioned datasets in conjunction with the equations given by ITU-R P.527-6 (ITU-R, 2021).
In terms of the propagation of ground waves, sea ice constitutes a thin dielectric layer on a highly conductive surface (sea water). This supports the excitation of the trapped surface-wave mode, which overlays the ground wave. Over short distances, the contribution of this mode dominates, and the field may exceed the free-space value. Over intermediate distances, the contribution leads to interference with the ground wave and thus oscillation. Over long distances, the ground wave is dominant (Hill and Wait, 1981a). In the frequency range of MF R-Mode and below, the influence is significantly less pronounced than at higher frequencies. Generally, it depends on the conductivity and relative permittivity of the sea, thickness of the ice, age of the ice and associated electrical properties, as well as the length of the propagation path over ice (Hill and Wait, 1981a, b). While the penetration depth and thus also the losses in amplitude and reduction of phase velocity of the ground wave are low with a highly conductive surface such as sea water, these increase with decreasing salinity. Sea ice forms a thin dielectric layer on seawater, which is a good conductor. The thicker the layer of ice, the greater the losses in the layer. The superimposed trapped surface wave then leads to a greater phase delay with increasing ice thickness compared to propagation over pure salt water.
Hill and Wait (1981a, b) provide a detailed explanation of how the propagation of ground waves over mixed paths with sea-ice coverage can be described. They employ a layered model to calculate the surface impedance of the propagation path that is illustrated in Fig. 2.
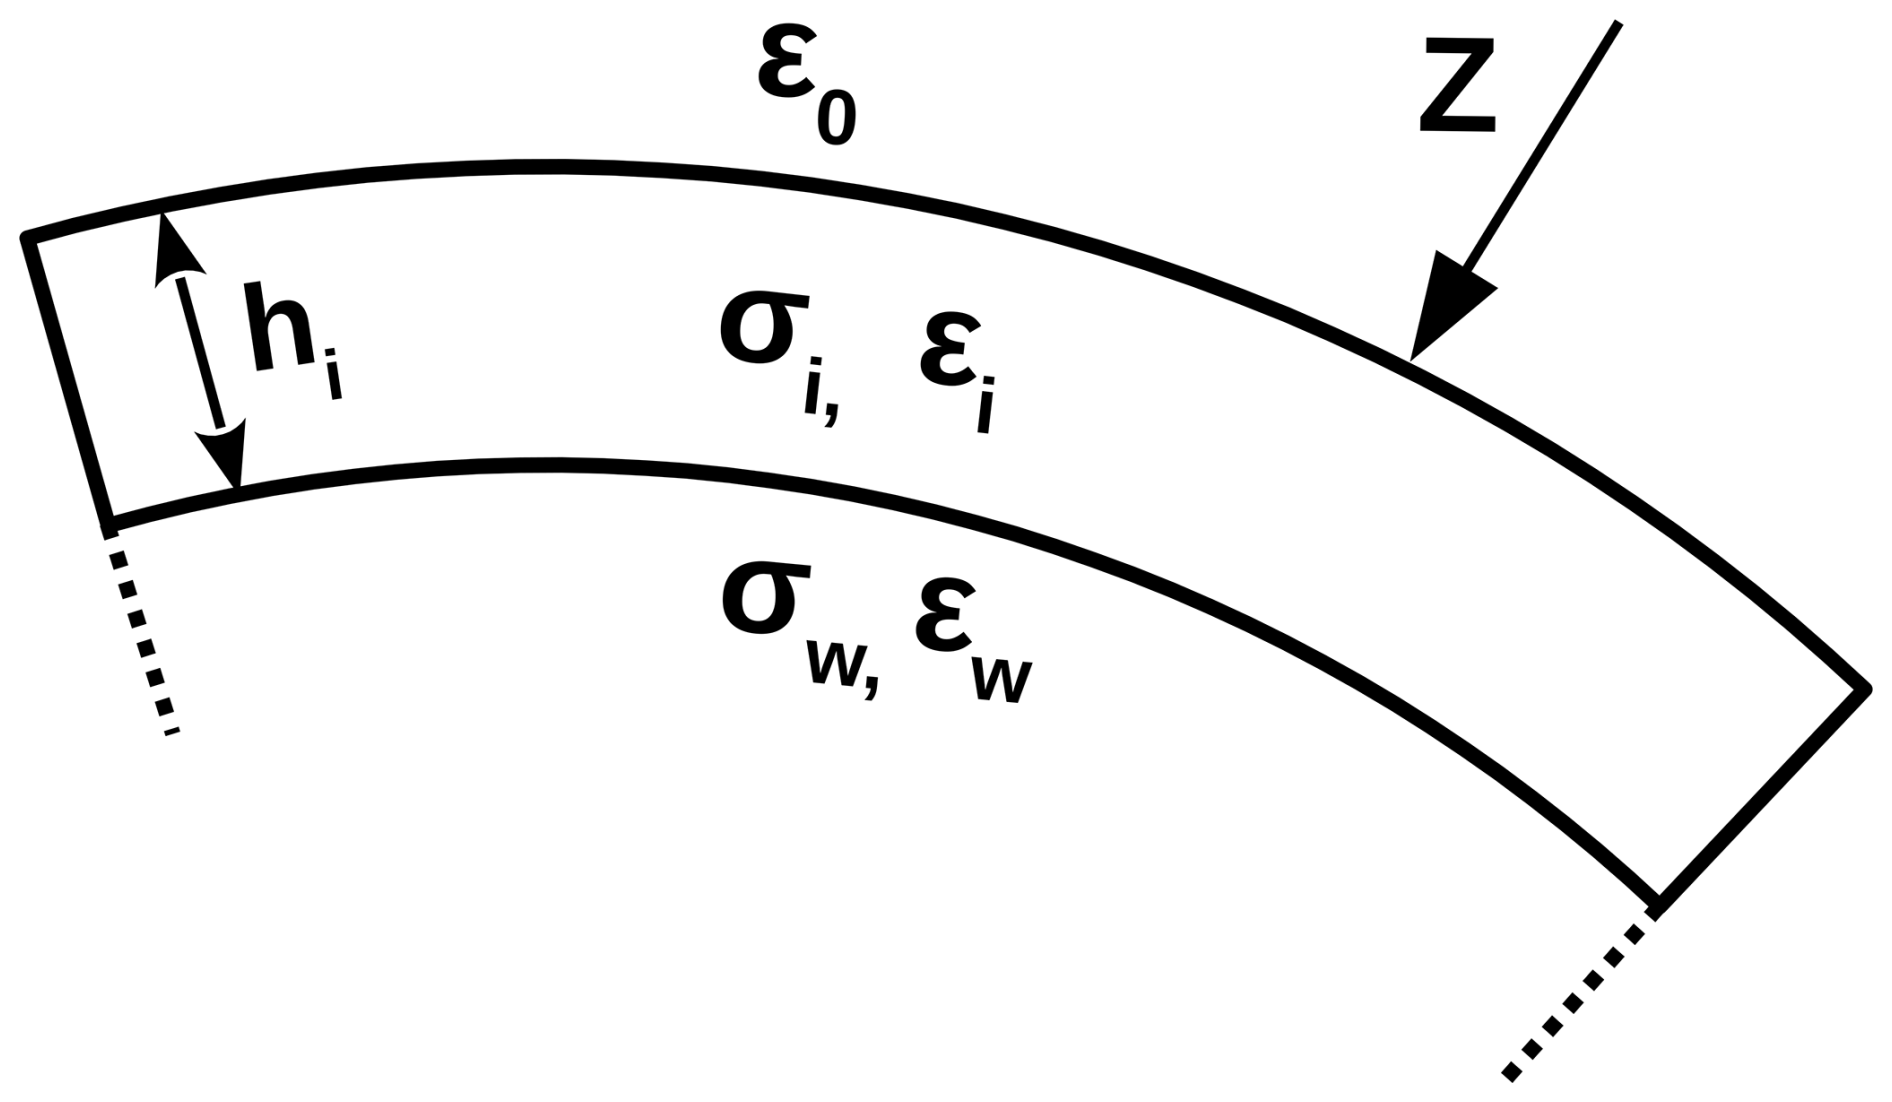
Figure 2Depiction of the two layered Earth model that describes the surface impedance of the surface (adapted from Hill and Wait, 1981b). Upper layer: sea ice with thickness hi, ground conductivity σi and permittivity ϵi. Lower layer: sea water with ground conductivity σw and permittivity ϵw. Above the surface: vacuum permittivity ϵ0.
The resulting surface impedance in Eq. (1) is calculated:
where , , , , , by using the conductivities of sea ice σi and sea water σw, and the permittivities of sea ice ϵi and sea water ϵw, the angular frequency ω, the sea ice thickness hi and the vacuum permeability μ0.
The resulting GEPD is a 100 m×100 m raster that contains the real and imaginary part of the surface impedance at the given frequency for the area of interest as a function of latitude and longitude.
In the ground-wave computation step, the composition of a set of radial signal propagation paths is determined based on the GEPD. This serves as an input to solve the integral equation along the radial propagation path between transmitter and receiver by integrating along the surface impedance numerically at a fixed interval.
As a result, the ground-wave attenuation and phase delay in the area is computed and stored in the output step.
2.2 Sensitivity analysis
The impact of sea ice on the attenuation phase delay of a ground wave travelling across a frozen sea was studied with the author's ground-wave simulation software. To assess the impact of different distances travelled across sea ice of variable thickness, a simulation was performed within the frequency band of the MF R-Mode system. We compared the phase delay of the ground wave travelling across sea ice ϕice and with phase delay across pure sea water ϕsea. In this scenario, the entire propagation path was covered by sea ice; the effect of mixed land-sea propagation is neglected for the moment. Figure 3 illustrates the normalized phase delay ϕice−ϕsea as a function of distance from the transmitter and the sea ice thickness for a frequency of 308 kHz.
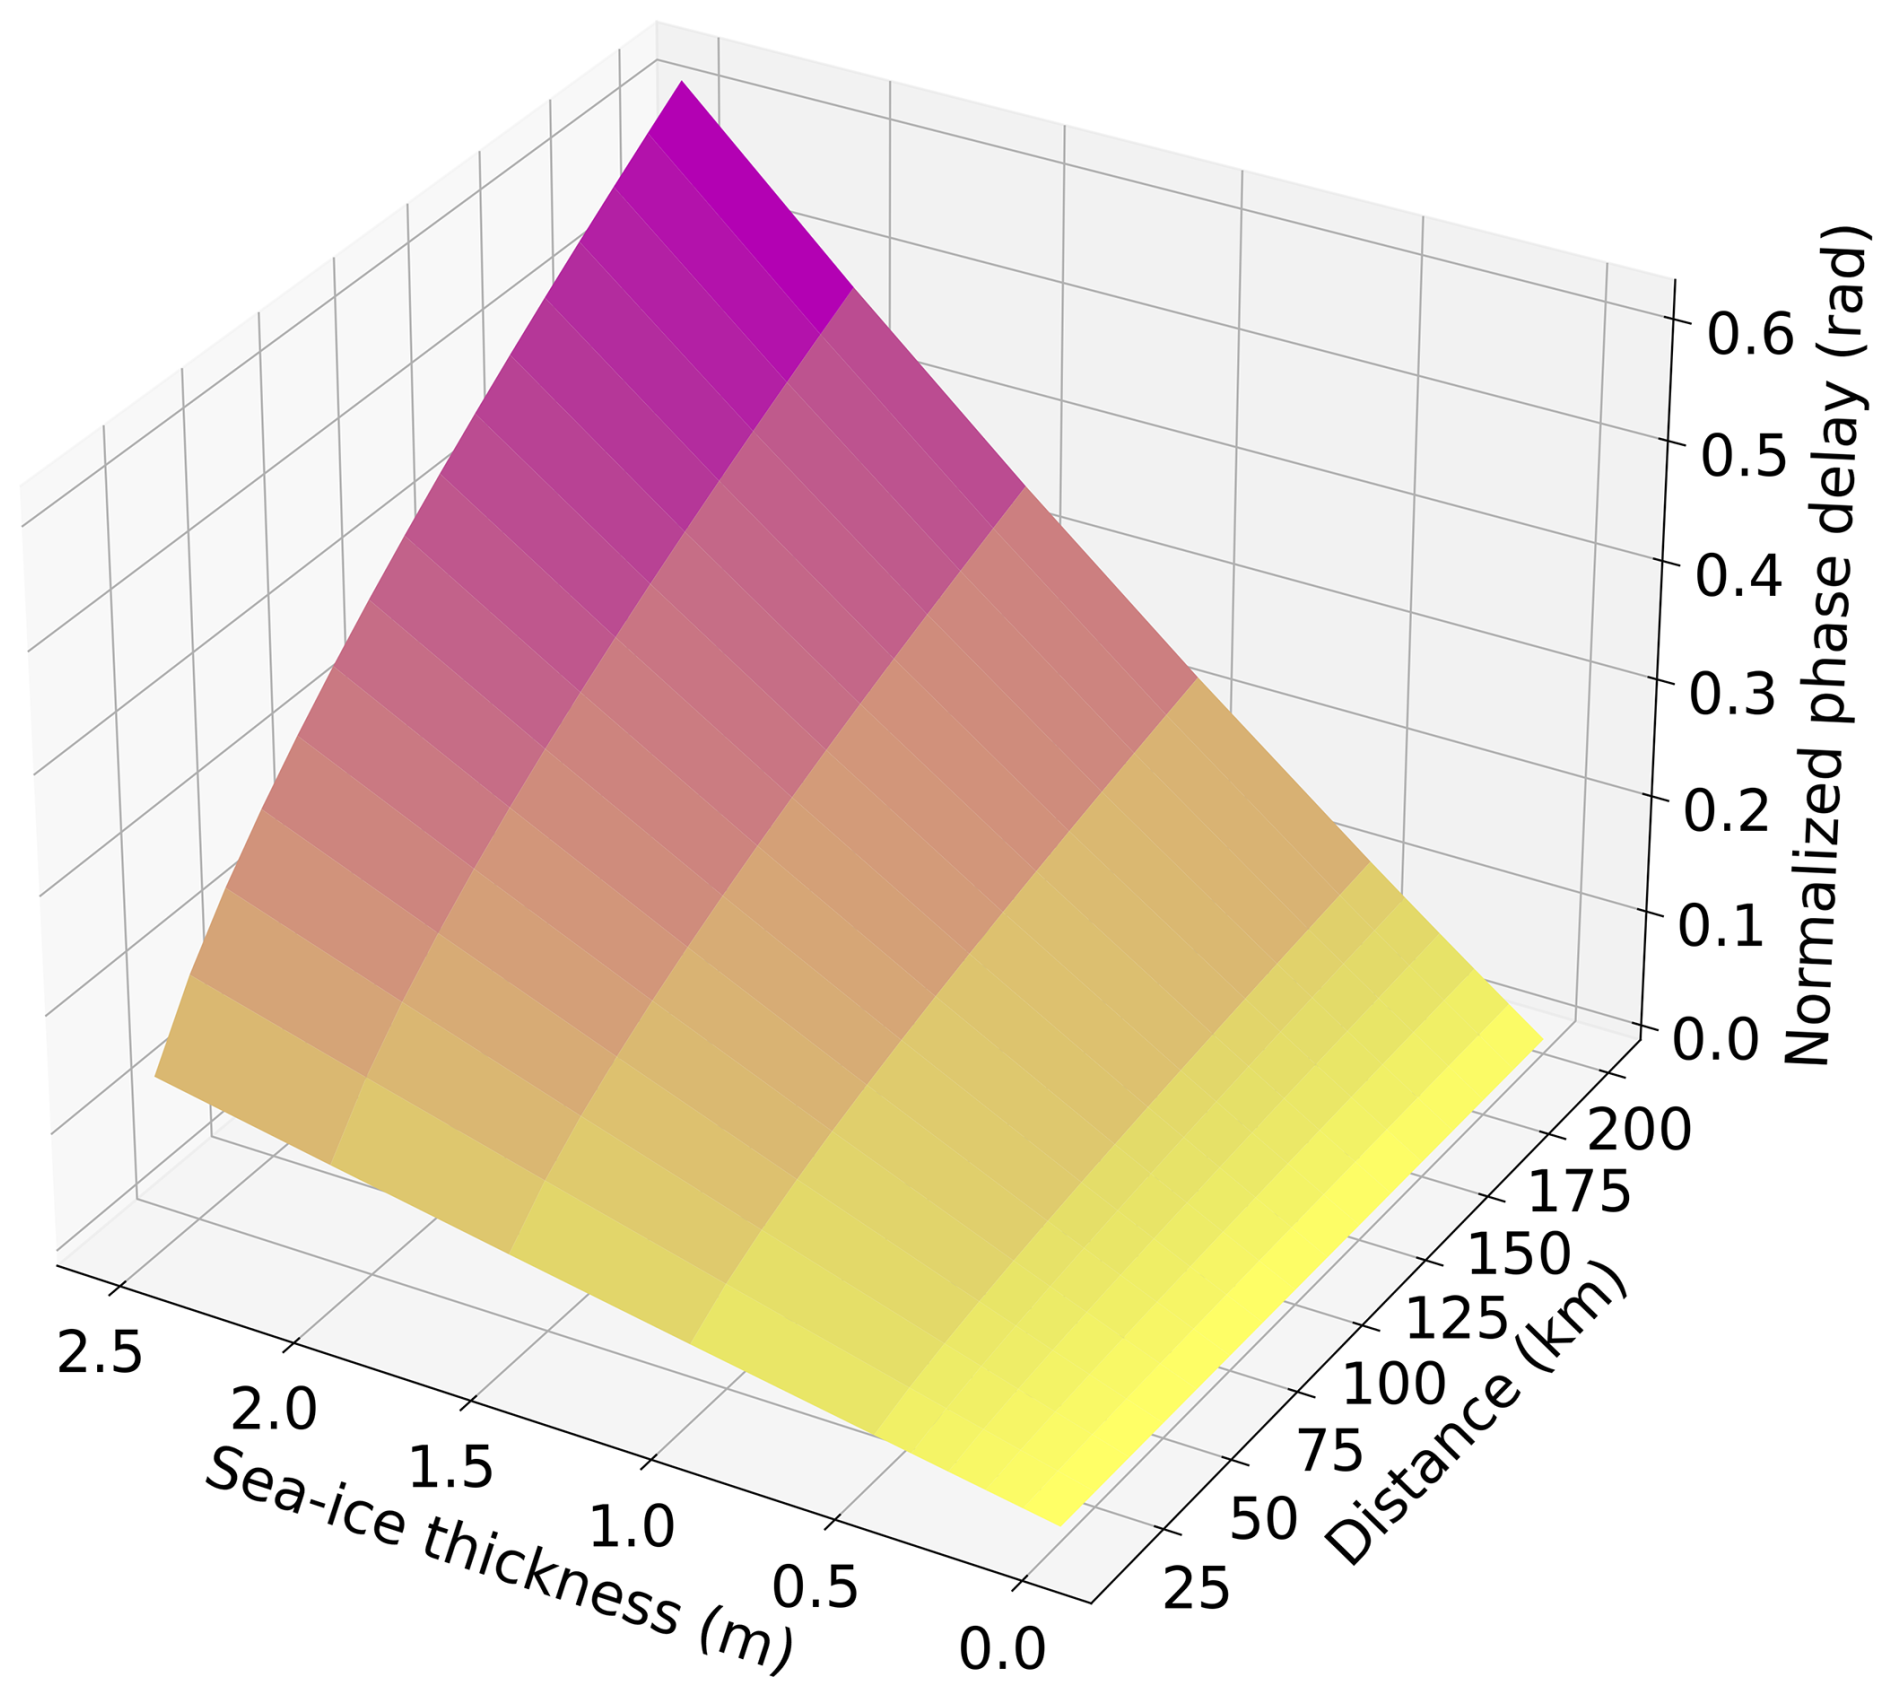
Figure 3Sensitivity of ground-wave phase delay in (rad) normalized to ice free sea water as a function of sea ice thickness in (m) and distance in (km).
It is evident that the normalized phase delay increases with growing distance from the transmitter in all cases. Compared to wave propagation along pure sea water, an additional delay is thus caused. This delay increases with the ice thickness. Realistic ice thicknesses up to 2.5 m were considered in this context. For the phase delay of navigation signals, the effect implies that even the propagation of the signal along short paths with an ice thickness of more than 1 m results in significant phase delays. In terms of the wavelength of approximately 1 km for MF R-Mode, this means that signal propagation along a 20 km path with a 1 m ice thickness already induces ranging errors of around 10 m. With a lesser thickness of 0.5 m, the ranging error would be approximately 5 m. Along a path of 200 km length, sea ice with a thickness of around 0.2 m would induce the same effect. Besides the effect of the ice on the phase delay, it also affects the attenuation of the ground wave over ice. A ground wave over sea ice is less attenuated when it passes an ice field compared to sea water. The signal which goes over ice therefore has a higher signal-to-noise ratio (SNR), which enables more accurate phase estimations (Grundhöfer et al., 2021). In this regard, sea ice has a positive effect on the MF R-Mode system because the ice layer, in the distance range up to 200 km and in the ice-thickness range up to 2.5 m, has an amplifying influence, as depicted in Fig. 4. Here, the normalized amplitude ratio of a signal propagating across sea ice is shown with respect to propagation across sea water.
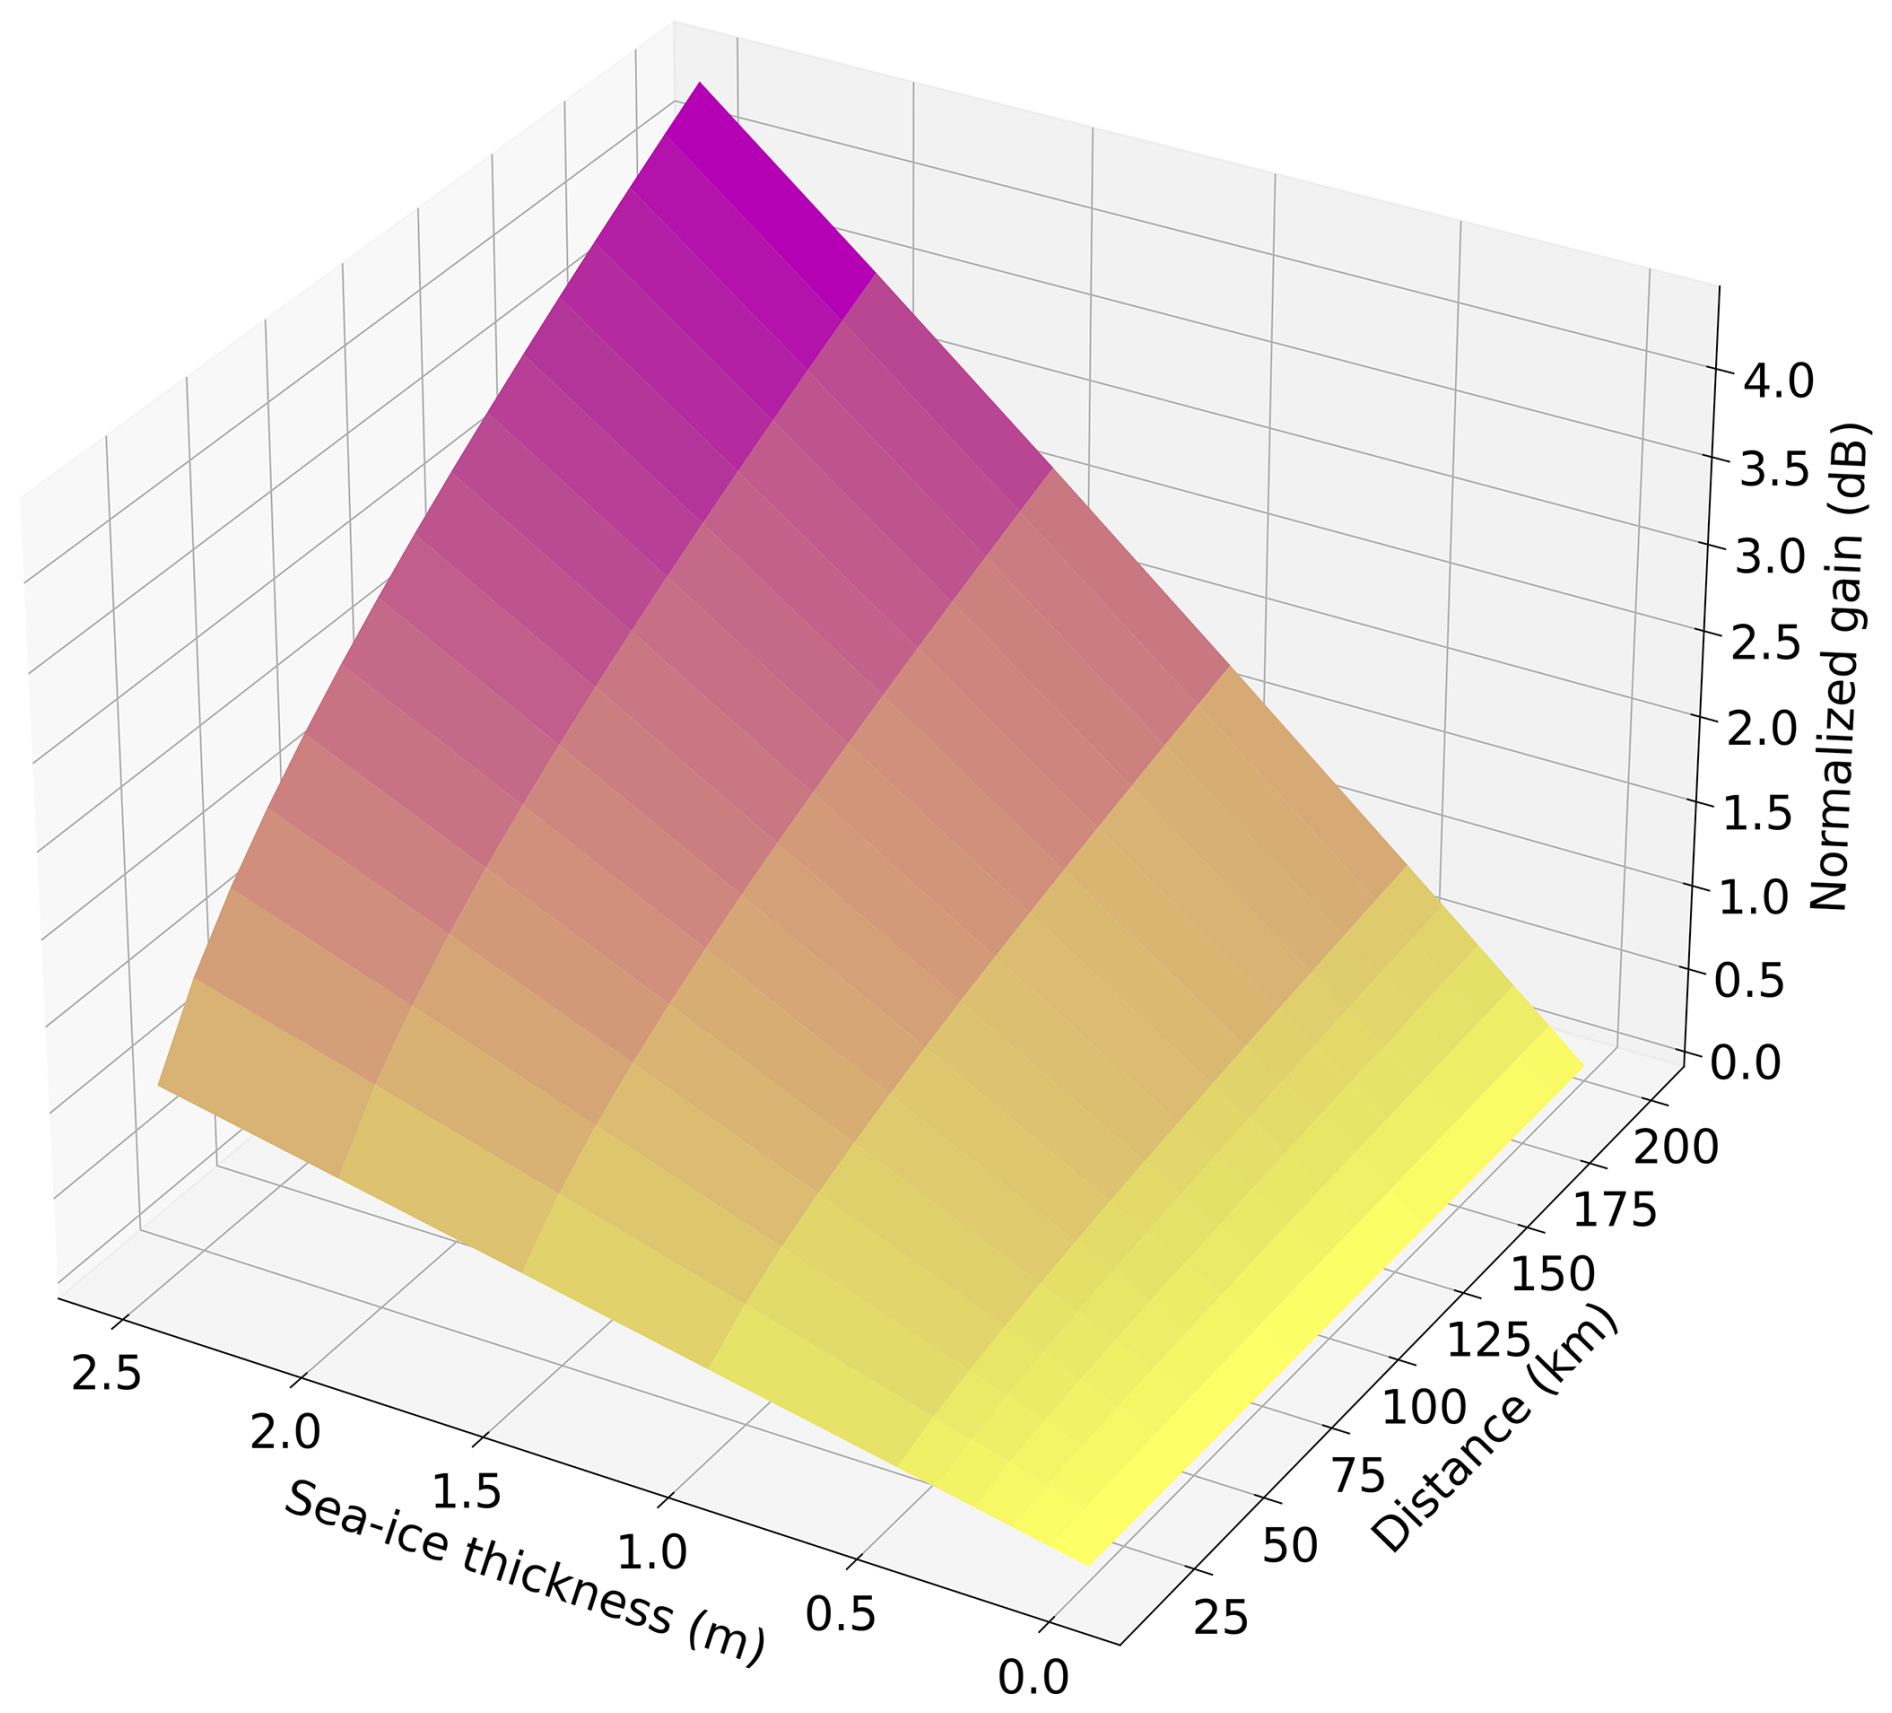
Figure 4Sensitivity of ground-wave gain in (dB) normalized to ice free sea water as a function of sea ice thickness in (m) and distance in (km).
2.3 Area under investigation
To study the theoretical impact of sea-ice cover on the ground-wave phase delay of MF R-Mode signals in a real-world scenario, we selected the Gulf of St. Lawrence in eastern Canada as simulation region. The region is relevant for maritime traffic and contains potential MF R-Mode transmitters (Koch and Gewies, 2020). The prevailing conditions allow for the regular formation of sea ice with a geographically extensive coverage and a thickness of up to 1 m during the period from December to March (Urrego-Blanco and Sheng, 2014). In our simulation setup, the region is delimited in geographical latitude from 45.7 to 49.2° N and in geographical longitude from 60 to 65° W. In the region, the maritime radio beacon and potential MF R-Mode transmitter of Pont Escuminac (47.0733° N, 64.798° W) was selected for further investigation. It operates at a frequency of 319 kHz and is located in a prominent position directly at the tip of a peninsula, enabling signal propagation along a path that consists only to a limited extent of land.
The sea-ice concentration and sea ice thickness are obtained from the E.U. Copernicus Marine Service data sets “Global Ocean Physics Analysis and Forecast” (Copernicus Marine Service, 2023a) and “Global Ocean Physics Reanalysis” (Copernicus Marine Service, 2023b). At the time of the scientific investigations, the period of the recent past regarding the extent and thickness of sea ice in the selected region was analyzed. In the ice season of 2022/2023, the sea ice in the Gulf reached its maximum extent on 1 March 2023, covering approximately 50 % of the investigated area. However, both the average and maximum thickness of the ice fell within a range in which the impact of the ice on wave propagation was expected to be weak, according to sensitivity analysis. Therefore, for comparison, the ice season of 2018/2019 was considered. While the extent of the ice in this period was lower than in 2023, the average and maximum thicknesses of the sea ice on 29 January 2019 were significantly higher than the values in 2023. Table 1 shows the corresponding variables that contributed to the selection.
Table 1Data set sea ice properties for 29 January 2019 and 1 March 2023.
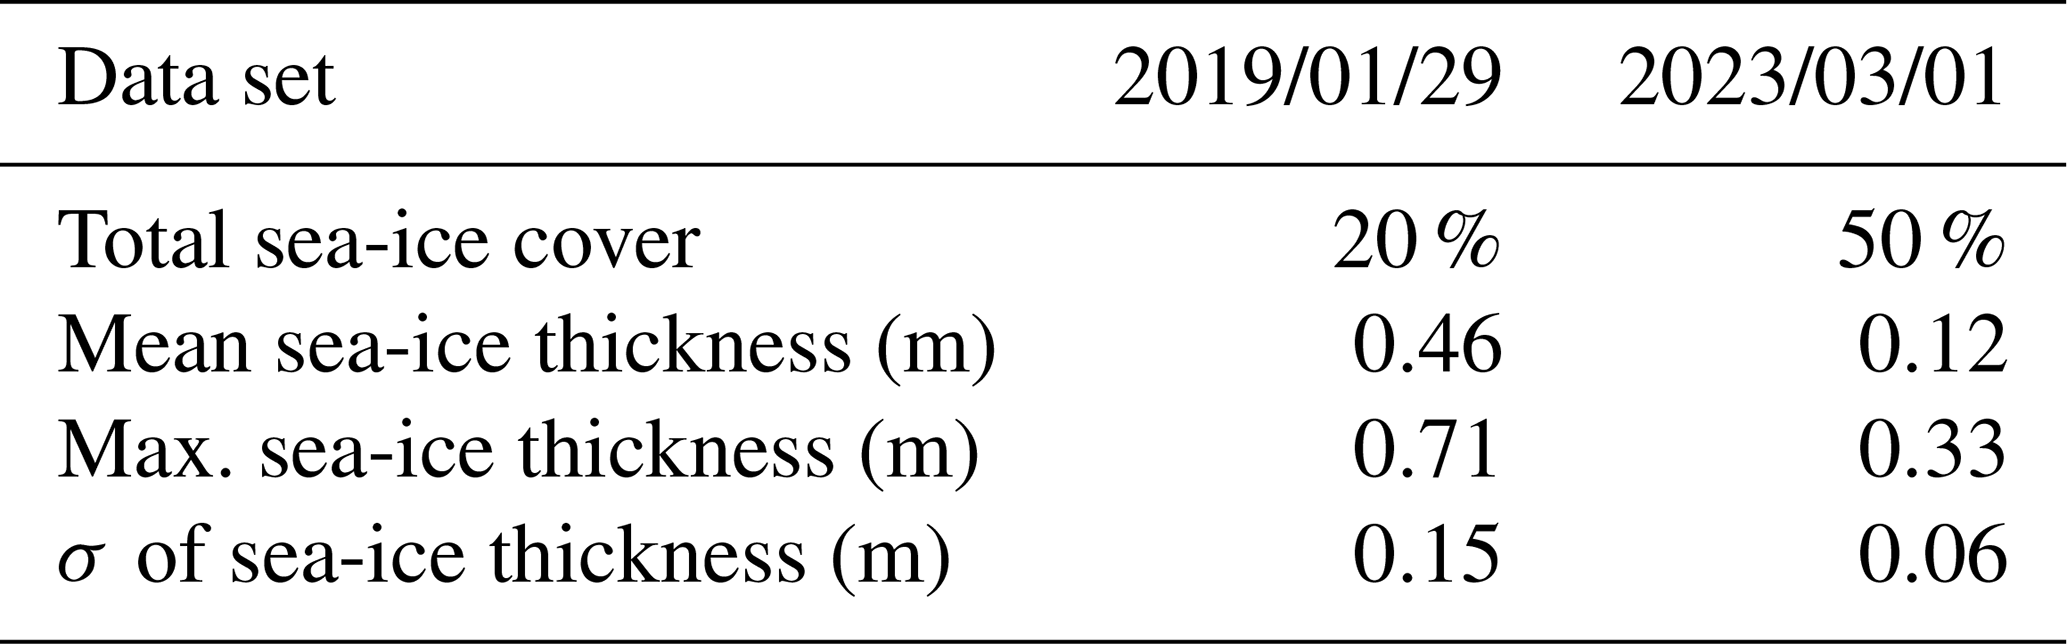
Figure 5 shows the sea-ice concentration in the region on 29 January 2019. The highest concentration of sea ice lies primarily in the Northumberland Strait around Prince Edward Island between 46 and 47° N latitude and 63 and 65° W longitude. The path of the signal from the Pont Escuminac transmitter into the Gulf crosses this area. Figure 6 shows the corresponding sea-ice thickness chart on the same date. It can be seen that the sea-ice thickness lies above 50 cm in the coastal region. Based on these charts and the aforementioned sensitivity analysis, the ground-wave phase delay is expected to be significant in the Gulf beyond the coastal area that is densely covered in thick sea ice.
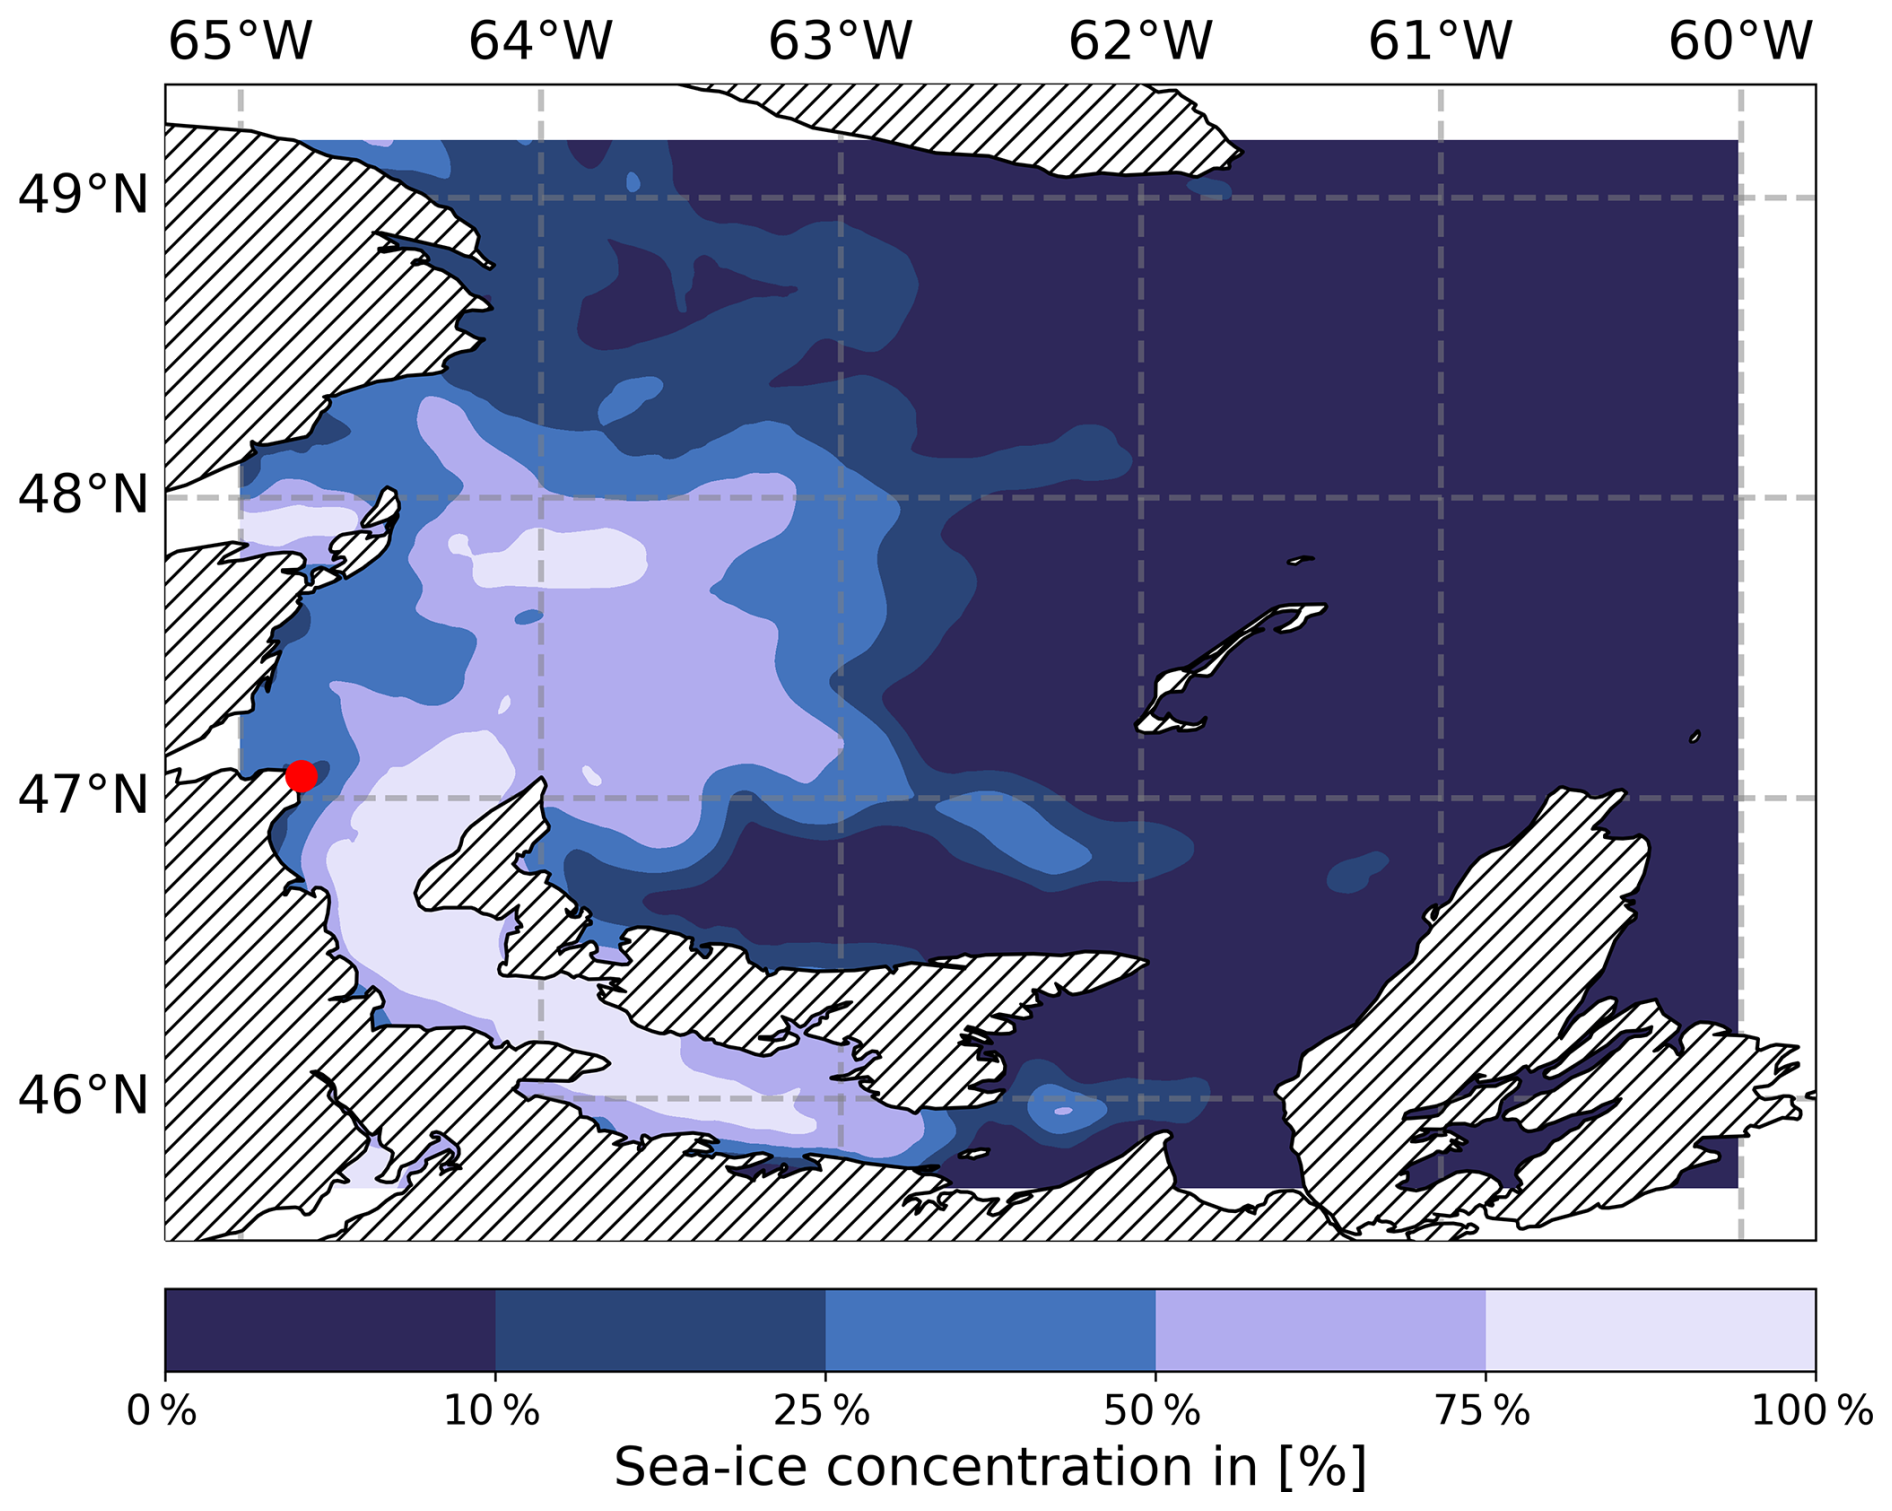
Figure 5Sea-ice concentration for St. Lawrence Gulf on 29 January 2019. The red dot marks the location of the Pont Escuminac radio transmitter.
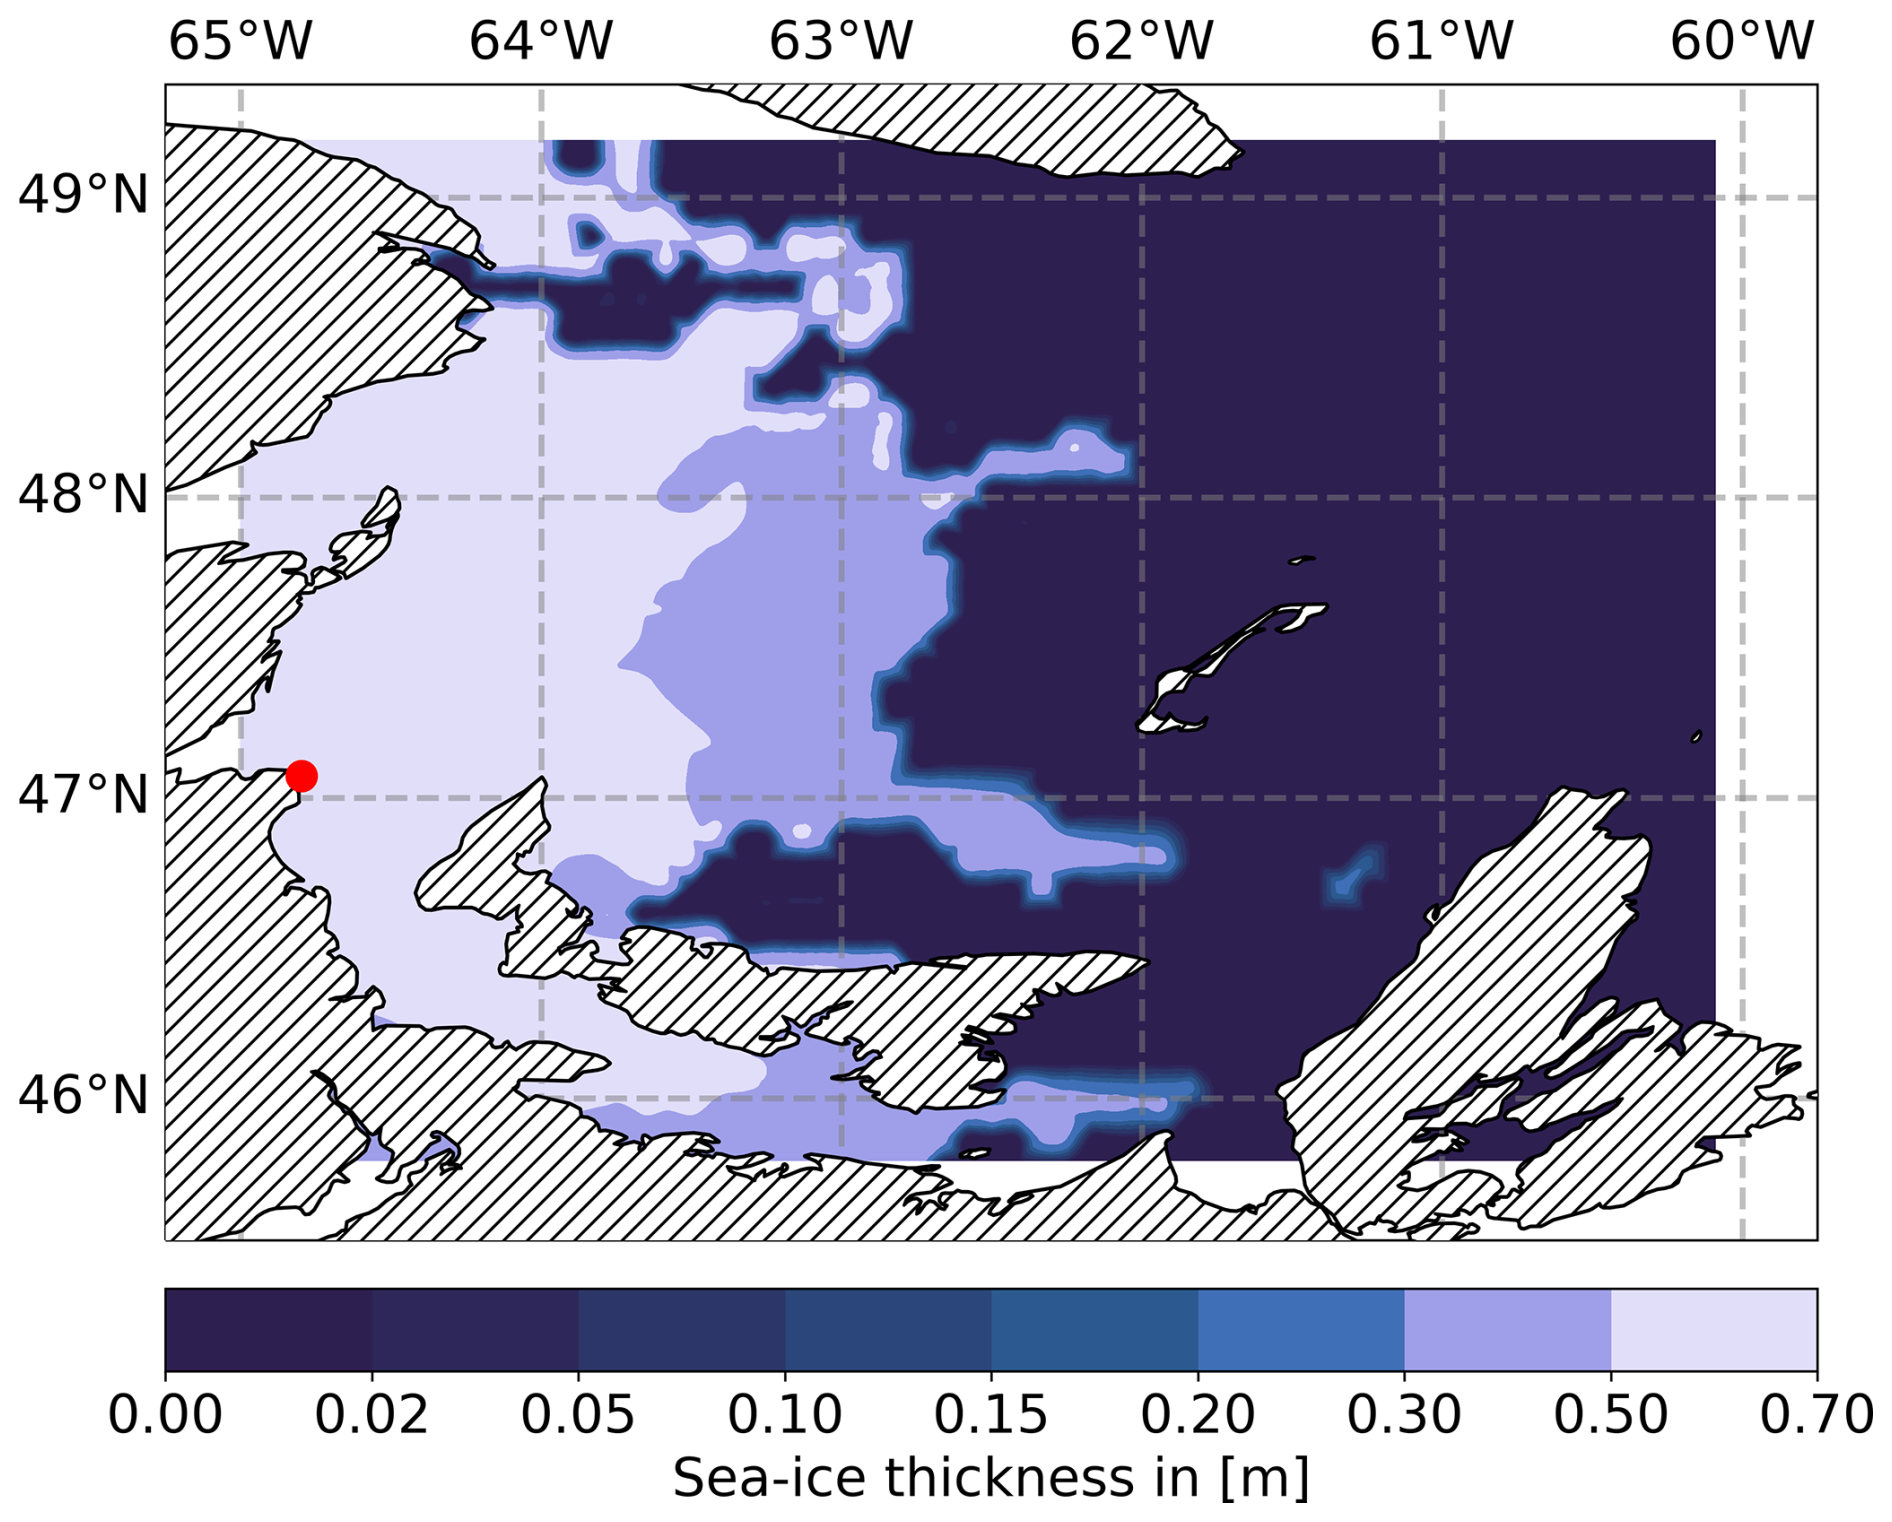
Figure 6Sea ice thickness in (m) for St. Lawrence Gulf on 29 January 2019. The red dot marks the location of the Pont Escuminac radio transmitter.
For the selected data set on 1 March 2023, Fig. 7 depicts the sea-ice concentration. As mentioned previously, the sea ice covers large fractions of the overall Gulf in the region while the thickness of the ice does not exceed 15 cm for all areas except for a small region around Prince Edward Island, as depicted in Fig. 8. The propagation path of the signal crosses large ice-covered areas in the Gulf, though the ice is comparably thin with respect to the sensitivity analysis shown in Fig. 3. Therefore, the expected ground-wave phase delay is smaller than for the other data set.
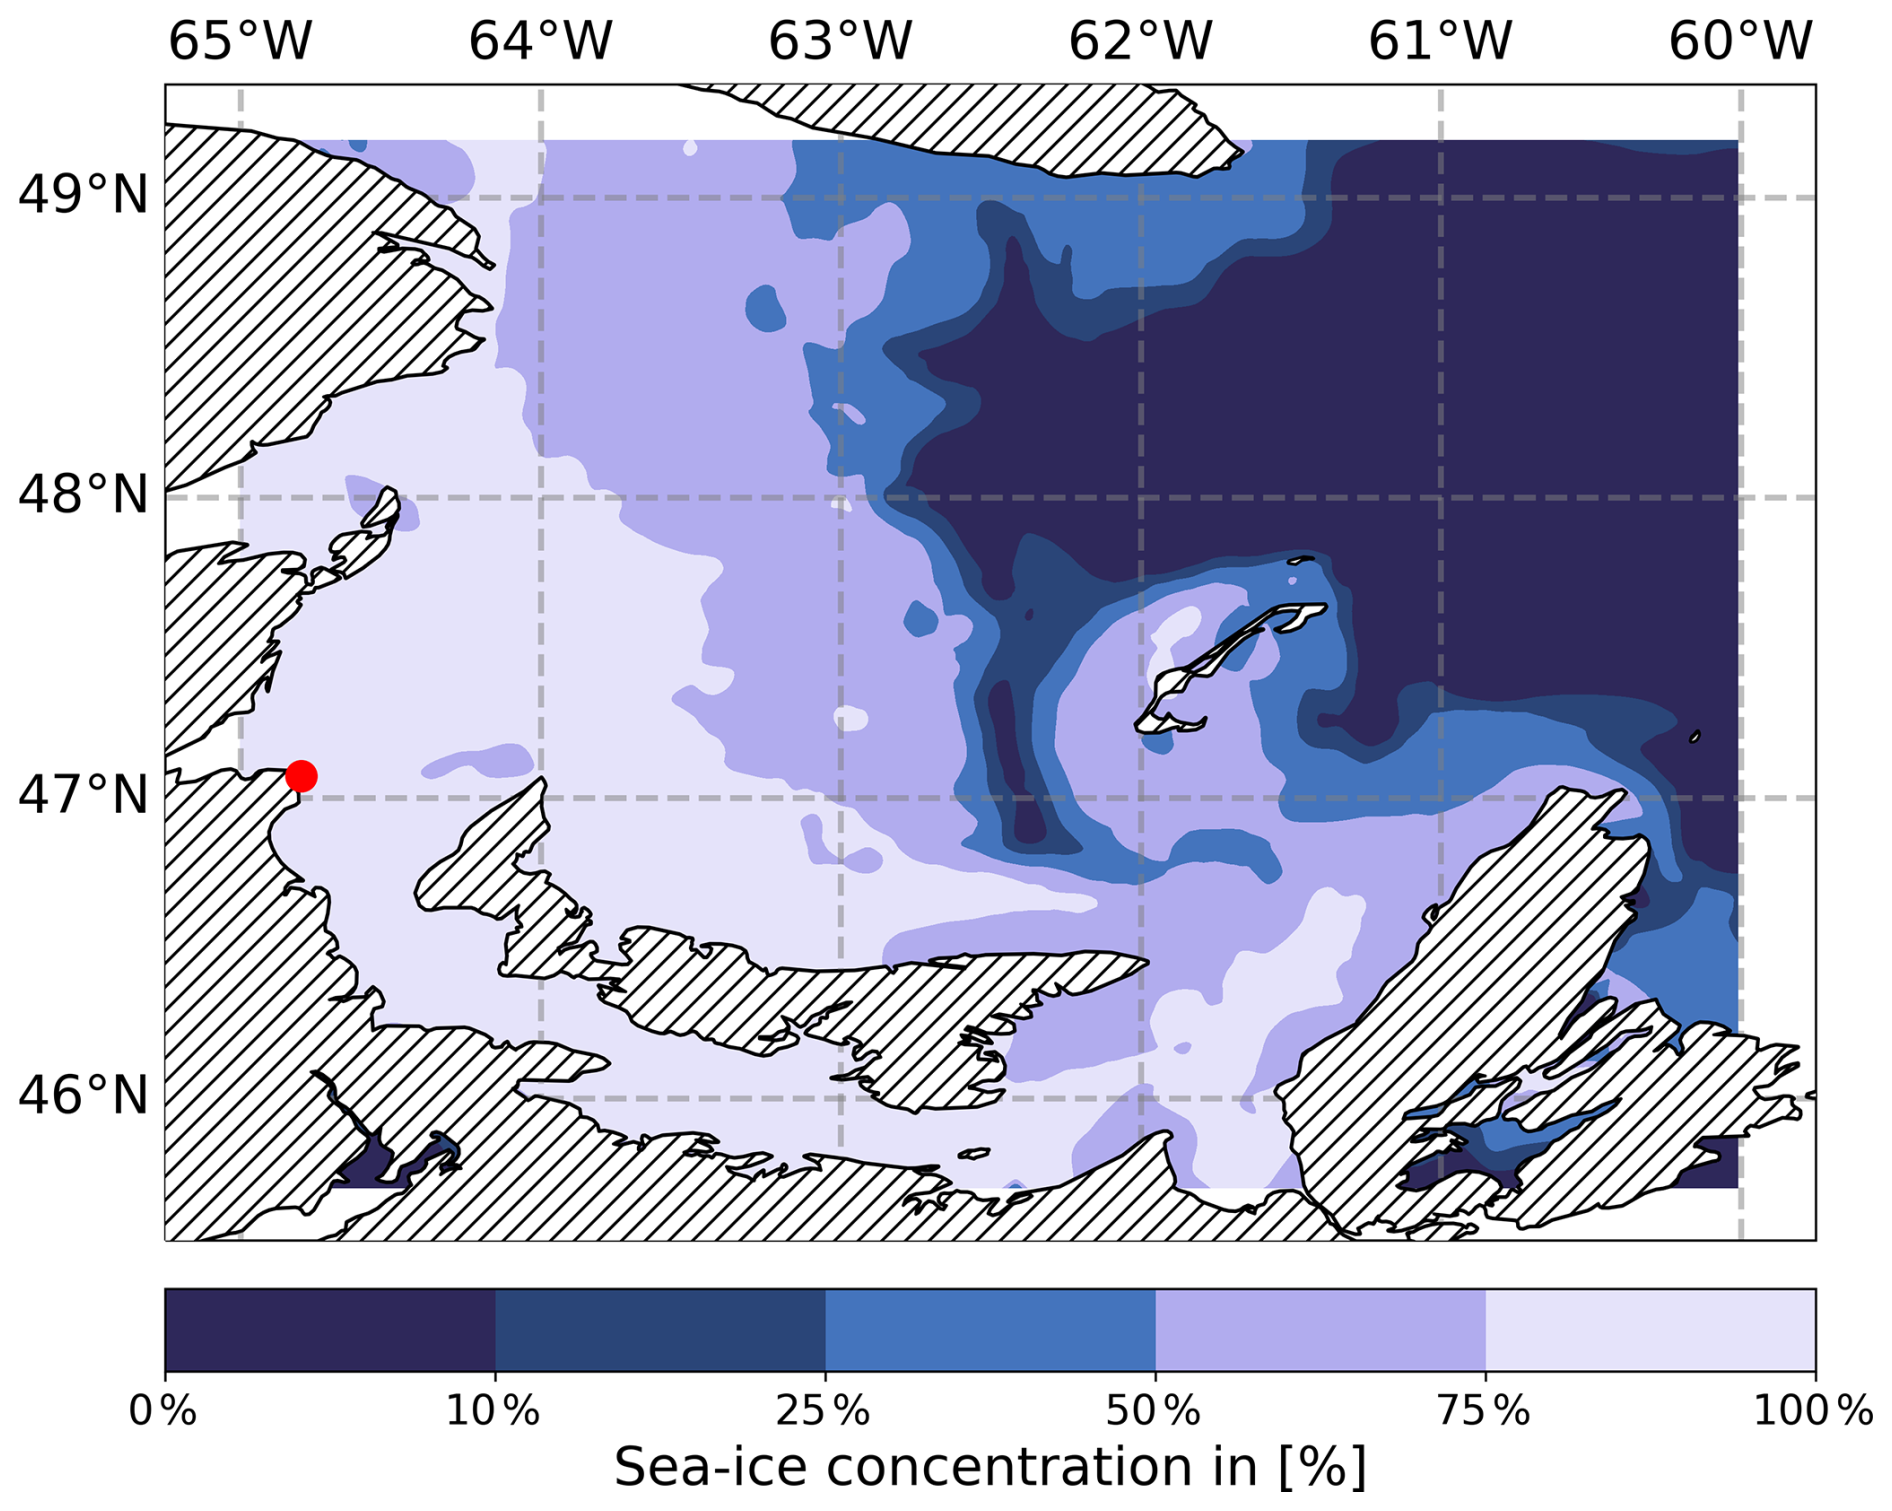
Figure 7Sea-ice concentration for St. Lawrence Gulf on 1 March 2023. The red dot marks the location of the Pont Escuminac radio transmitter.
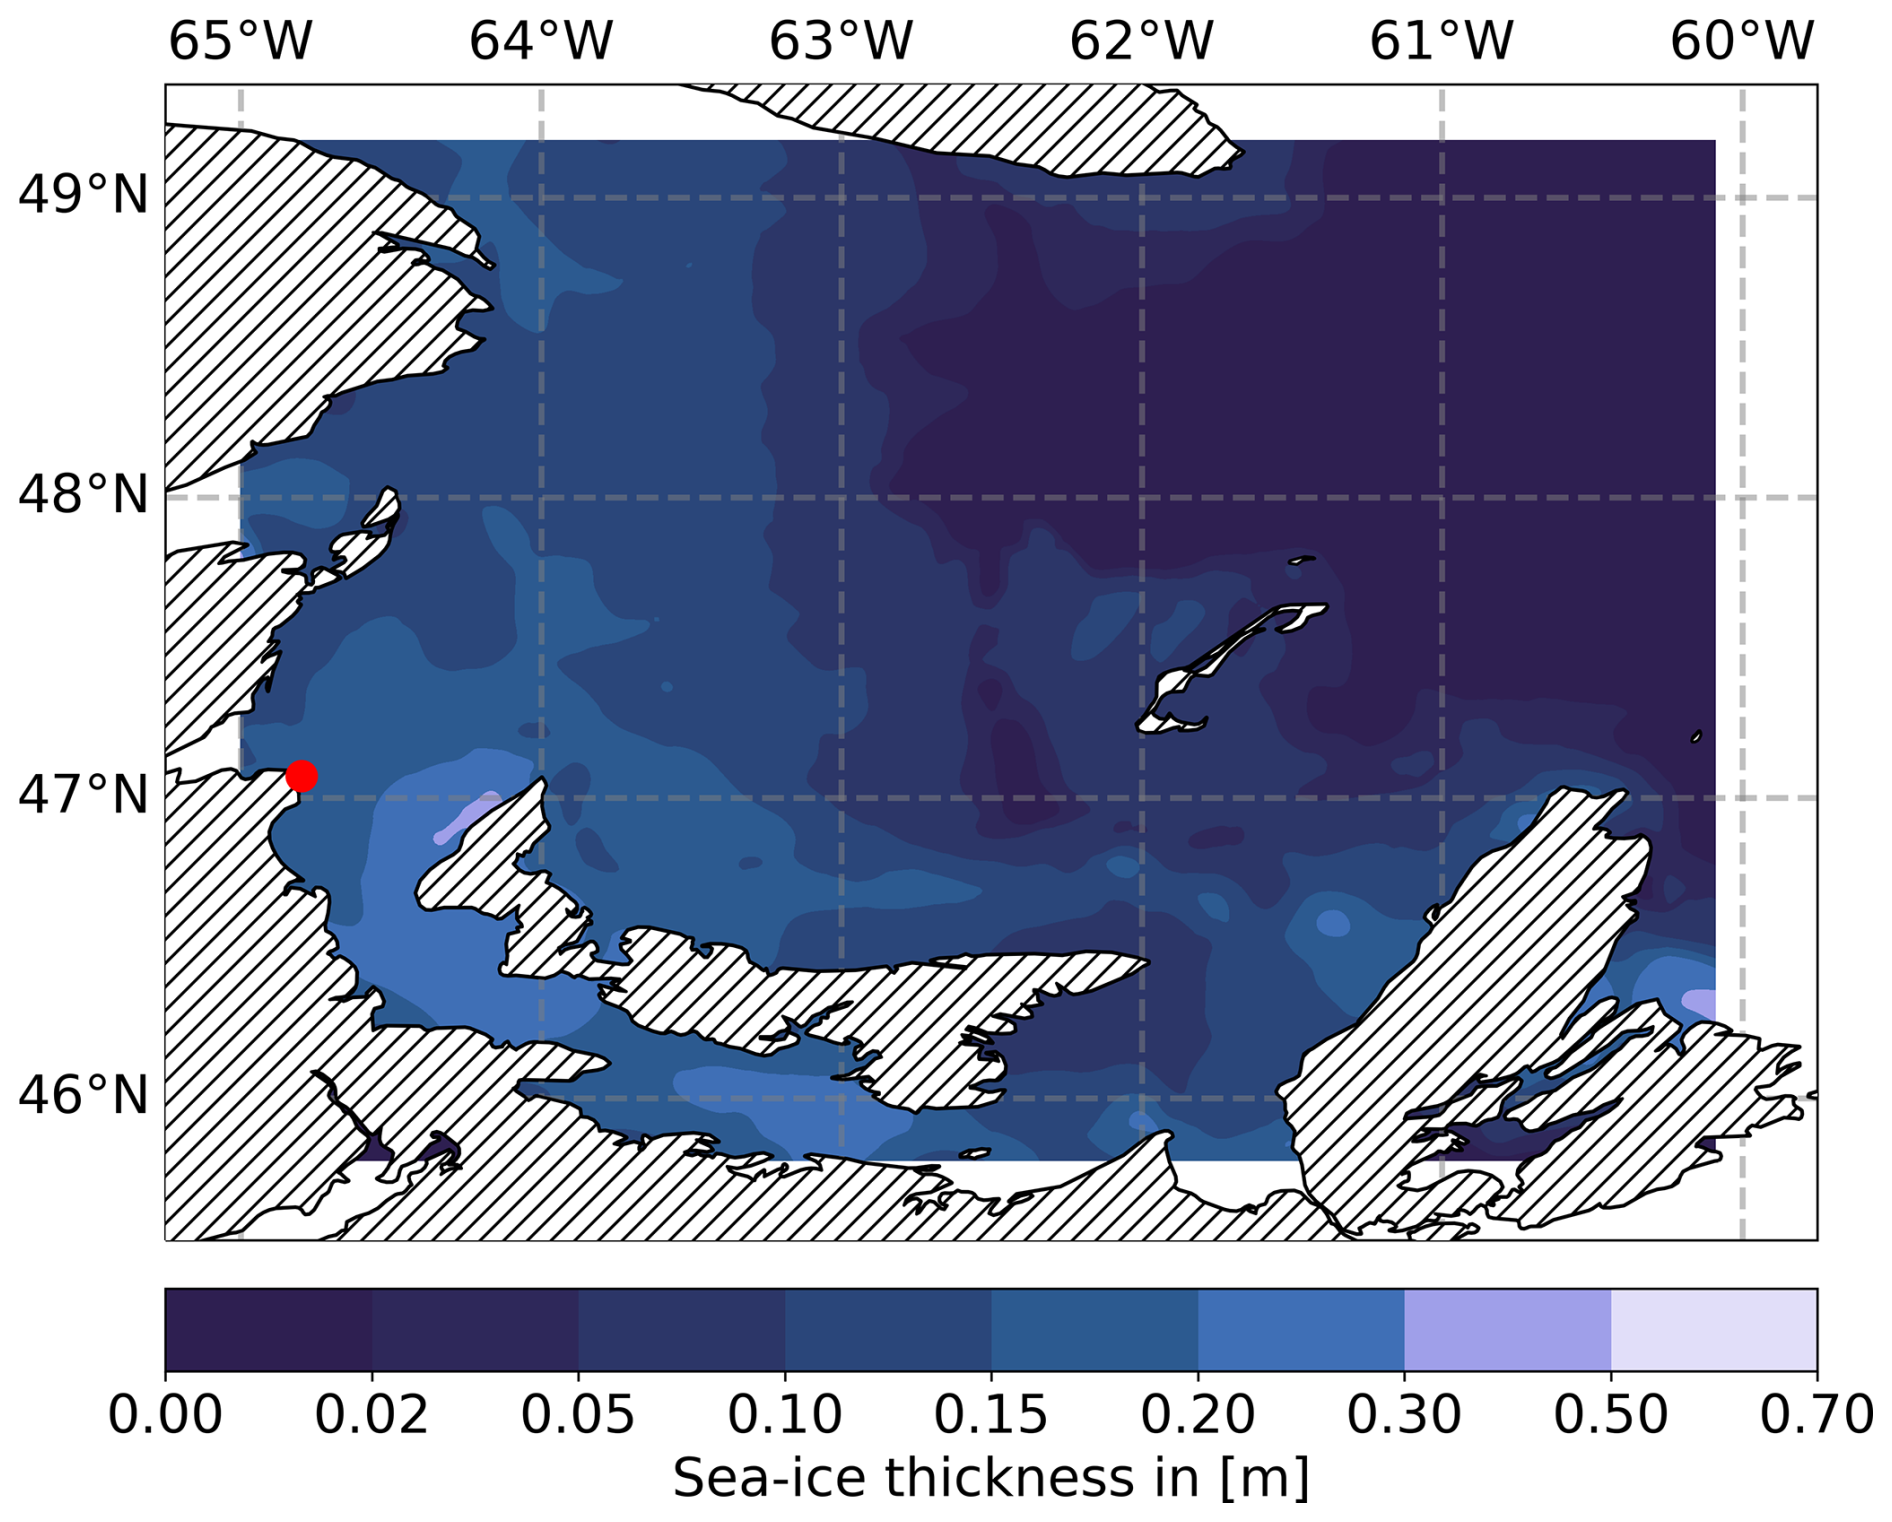
Figure 8Sea-ice thickness in (m) for St. Lawrence Gulf on 1 March 2023. The red dot marks the location of the Pont Escuminac radio transmitter.
Using the ground-wave propagation software framework mentioned in Sect. 2, the attenuation function of the signal from the Pont Escuminac radio transmitter was computed for the same region and conditions once with and once without sea-ice cover, using the concentration and thickness information derived from the E.U. Copernicus data sets. The phase delay without the influence of sea ice ϕsea is taken as a reference to show the expected ground-wave phase delay without employing the proposed approach. To compare and evaluate the phase delay ϕice in the scenario with sea-ice cover, we depict the normalized phase delay ϕice−ϕsea which represents the argument of the ratio of attenuation functions . The normalized phase delay represents exclusively the influence of sea ice on the ground-wave phase delay and allows the exclusion of other variables – such as salinity or sea surface temperature changes – that would be included if different data sets from different time periods were to be compared.
3.1 Ground-wave phase delay without sea ice
The phase delay ϕsea of the signal as it would be expected without sea-ice cover is depicted in Fig. 9 for the data set on 29 January 2019. Figure 10 shows the phase delay ϕsea for the data set on 1 March 2023. Both data sets differ marginally in delay since the conditions regarding salinity and sea surface temperature were similar and the ground-wave phase delay is less sensitive to these variables than for sea ice. The Figures show the expected variable shading for mixed land-sea propagation. The delay increases gradually over sea water, while signal propagation across islands introduces an additional phase delay as already experienced in previous scenarios (Hehenkamp et al., 2024). Especially in the region of exclusive propagation over water, the lines of equal absolute phase delay run nearly parallel.
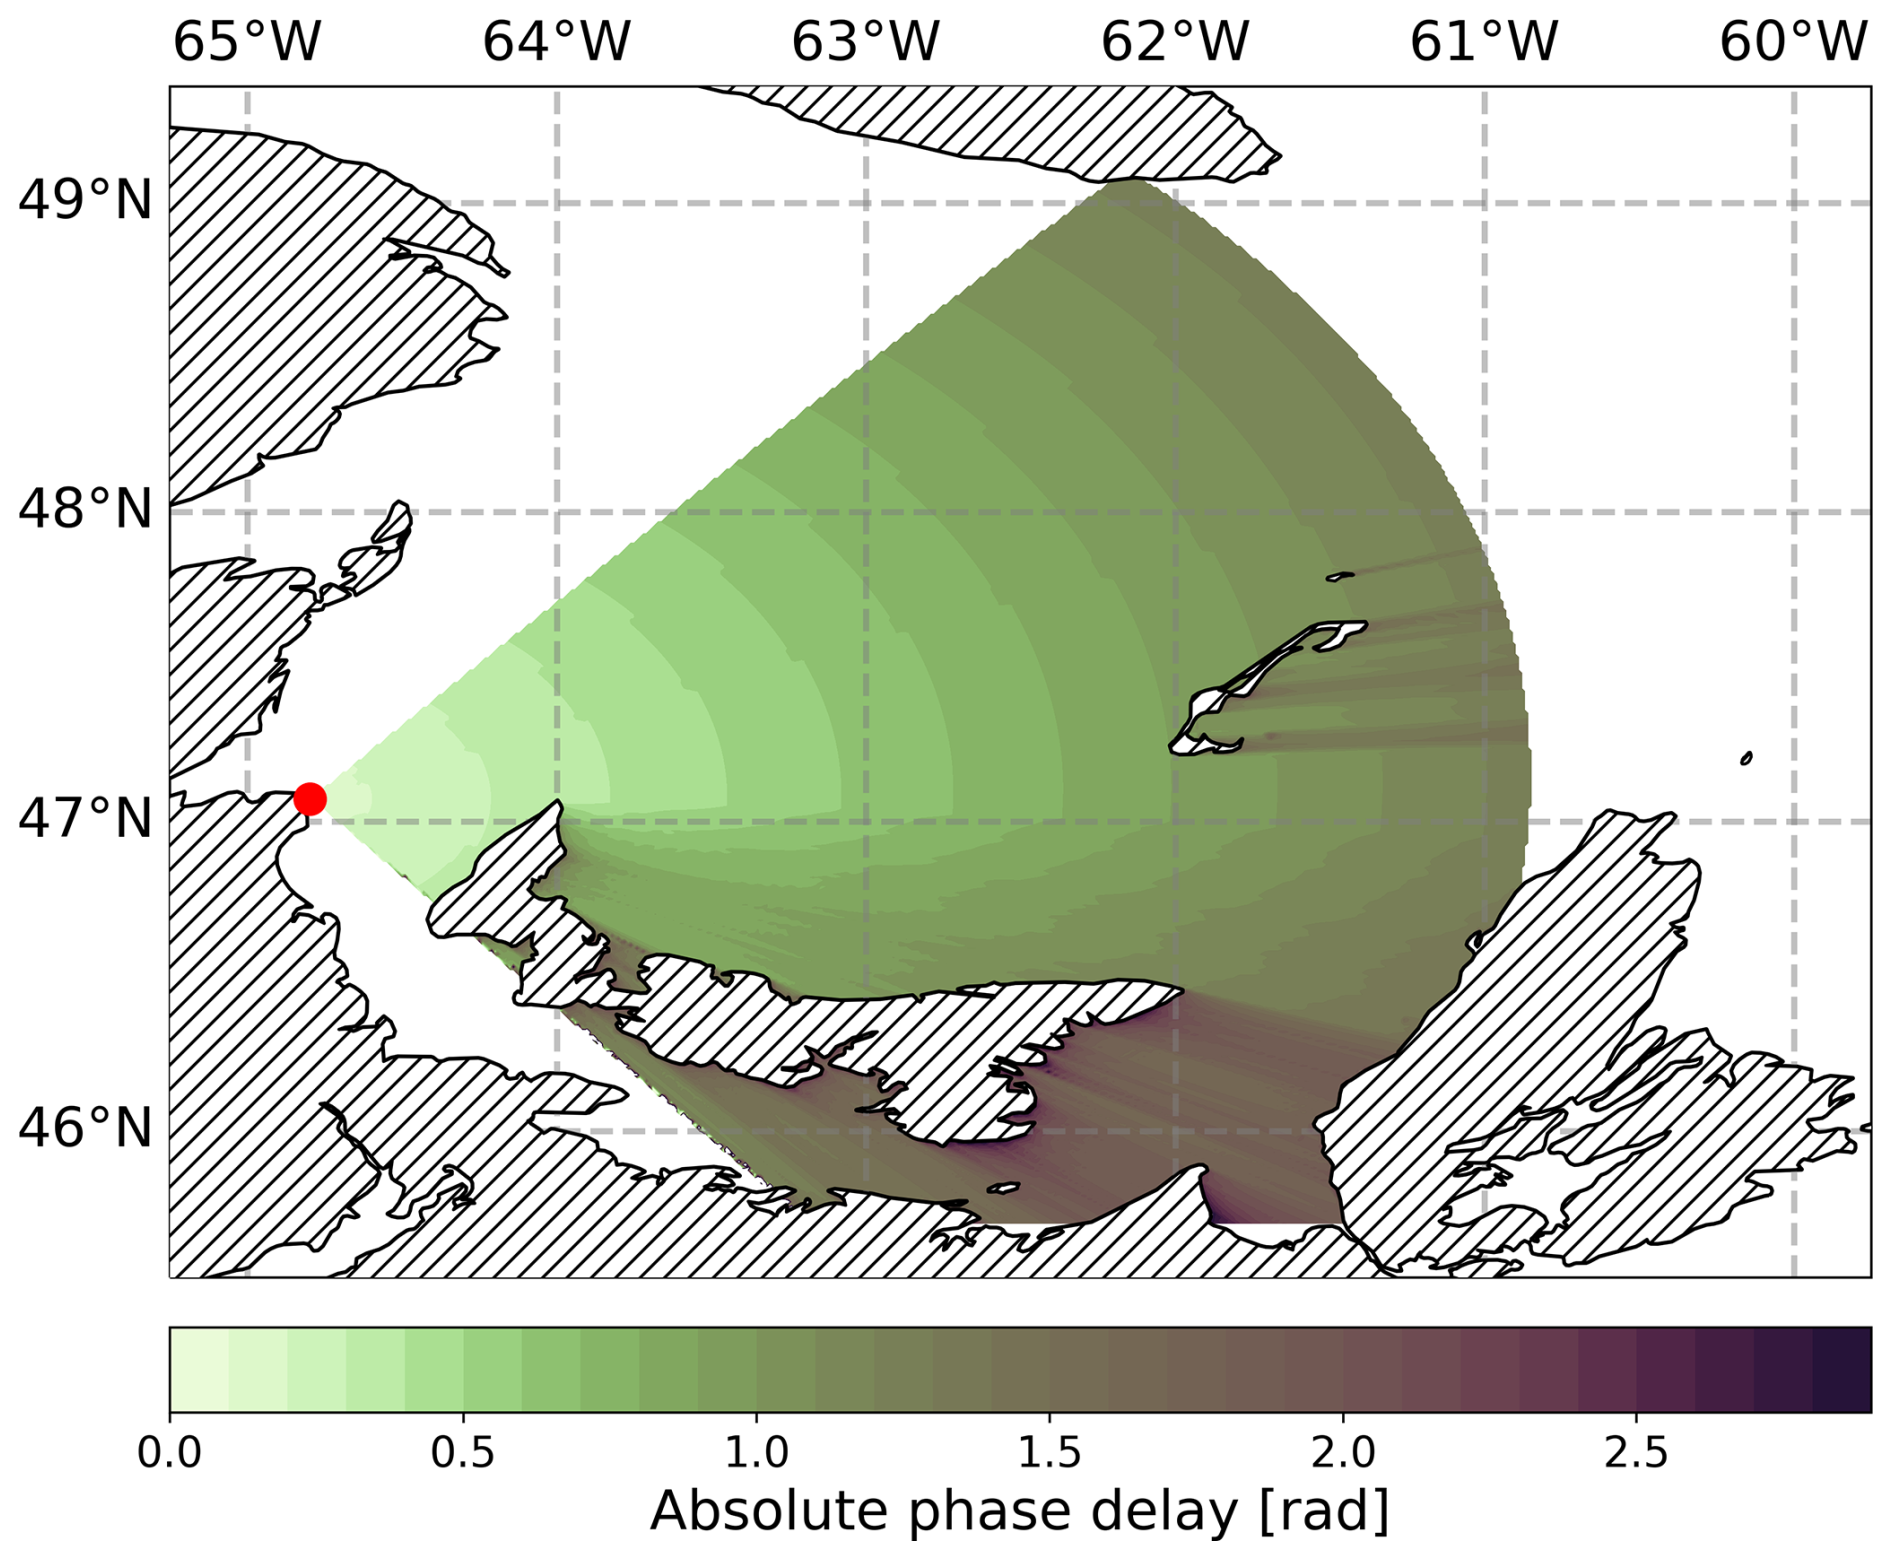
Figure 9Absolute ground-wave phase delay in (rad) for St. Lawrence Gulf on 29 January 2019, excluding the influence of sea ice. The red dot marks the location of the Pont Escuminac radio transmitter.
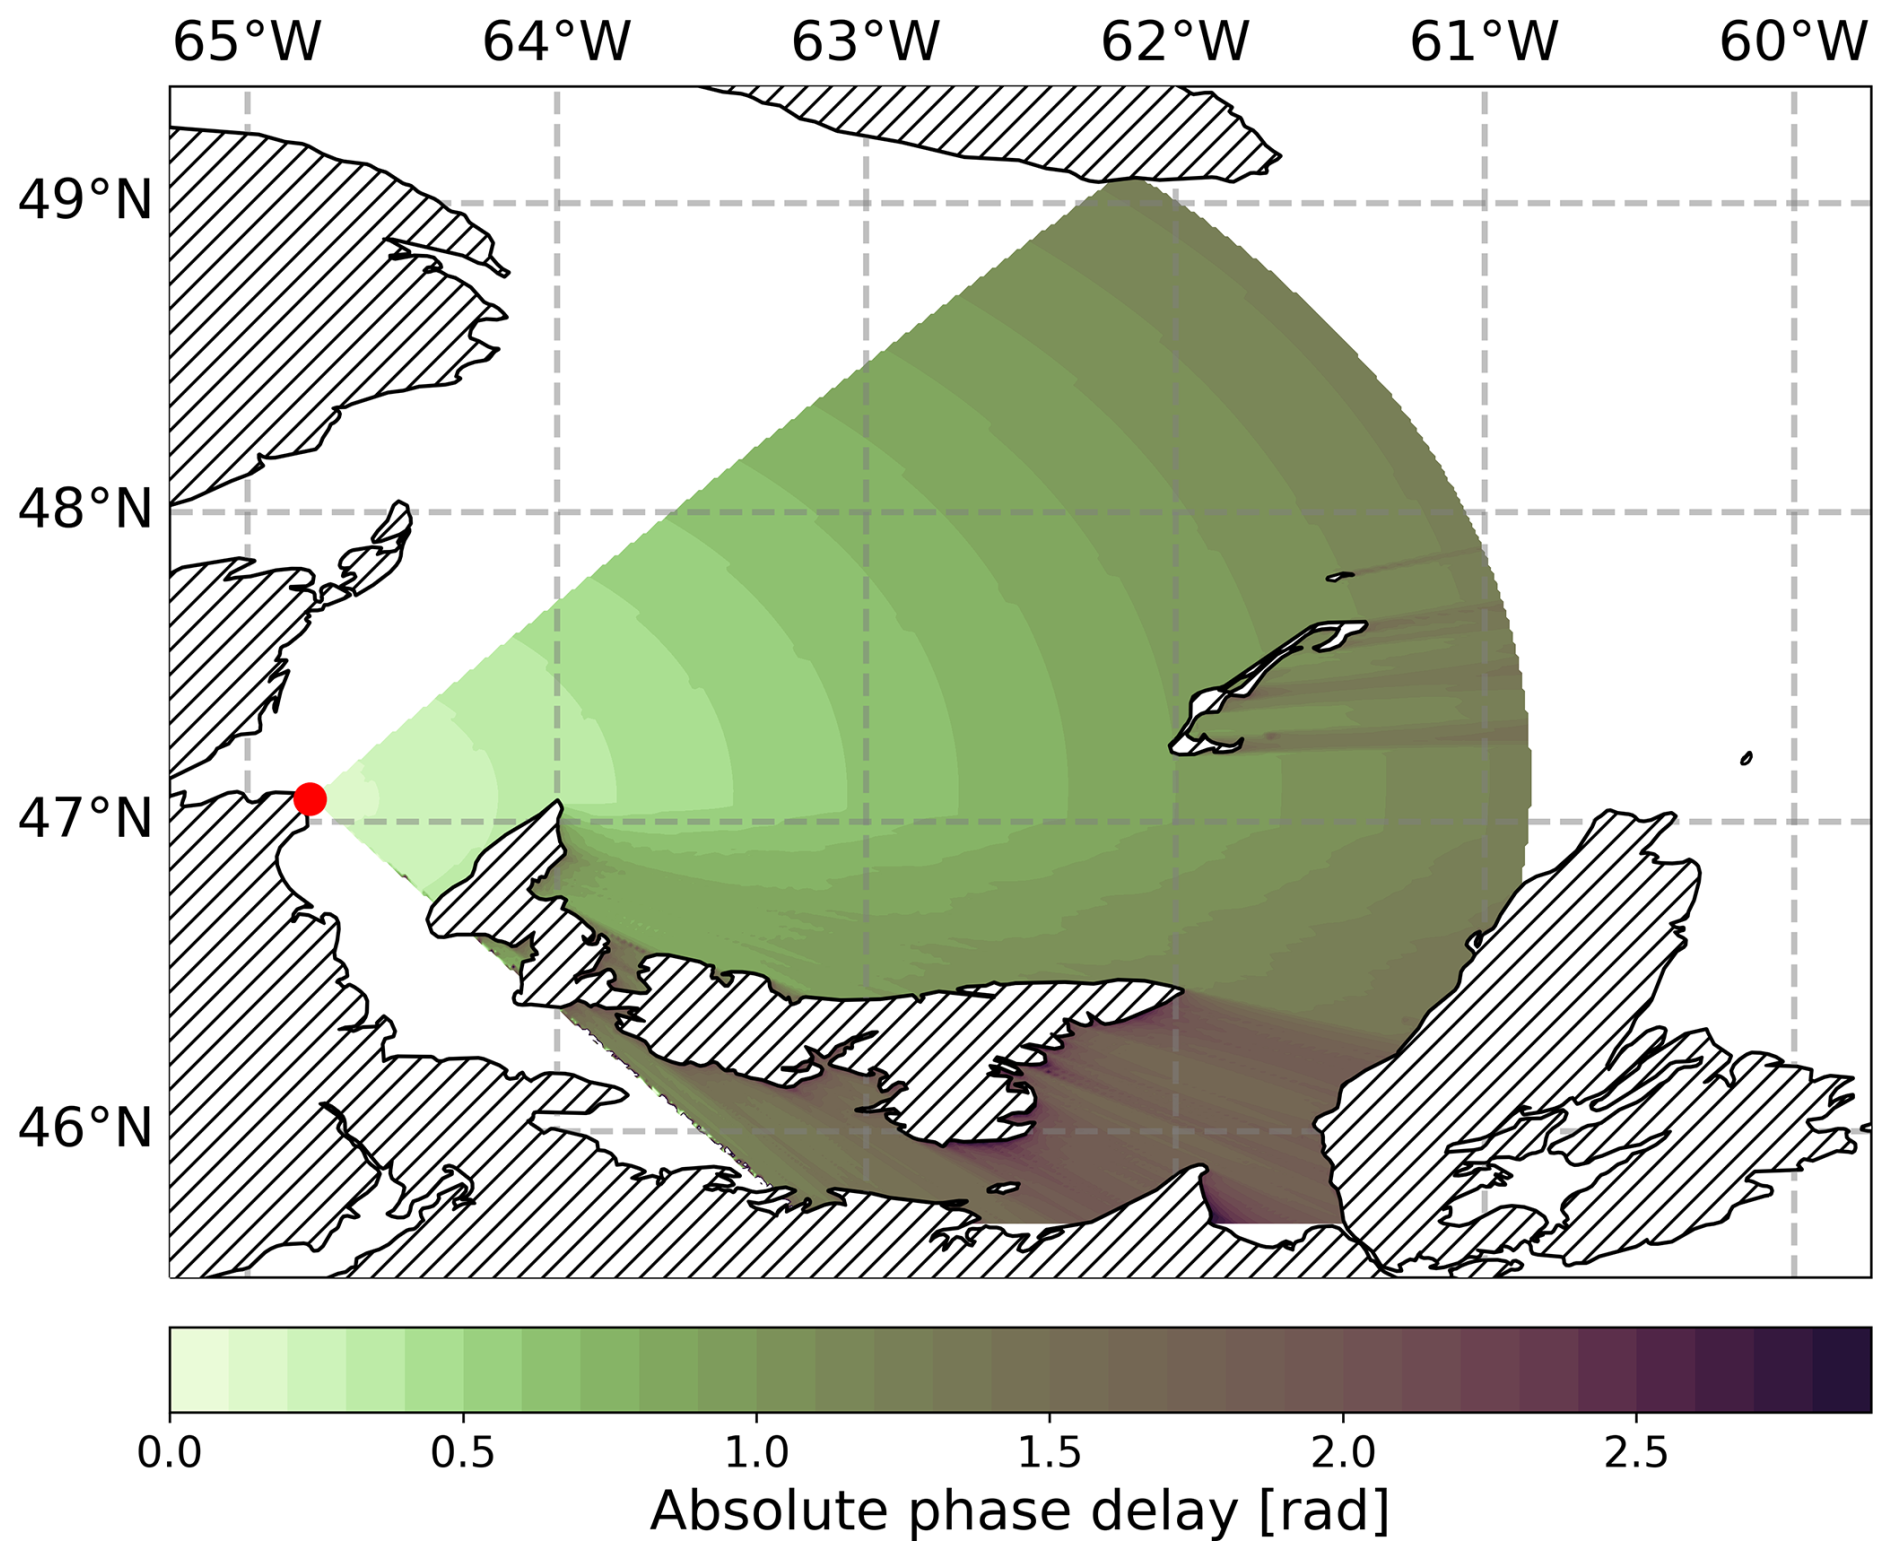
Figure 10Absolute ground-wave phase delay in (rad) for St. Lawrence Gulf on 1 March 2023, excluding the influence of sea ice. The red dot marks the location of the Pont Escuminac radio transmitter.
3.2 Normalized ground-wave phase delay with sea ice
As mentioned in the previous section, the two selected data sets differ significantly in terms of the extent and thickness of sea ice. The expectation is that visible phase delays will occur in both cases. Both data sets share the characteristic that the ice coverage in the western part of the Gulf, near the coast, and in the area of the Northumberland Strait has a high concentration, with the thickness of the ice being greater in these areas than in others. The coastal region in the vicinity of the transmission station is largely frozen. Therefore, in both cases, the signal propagation path initially traverses ice-covered areas.
As a result, the simulations depict the normalized phase delay for the chosen time periods, allowing an assessment of the influence of sea ice. To emphasize the results more clearly, in the following plots, the sea-ice coverage has been represented by hatching with dense and less dense points. Dense point-hatching indicates areas with a sea-ice concentration greater than 75 %, less dense point-hatching indicates a sea-ice concentration of between 10 % and 75 %.
3.2.1 Data set: 29 January 2019
The first data set is characterized by lower concentration and higher thickness of sea ice. Figure 11 depicts the distribution of the normalized phase delay in the region as a result of propagation over sea ice. It is evident that the propagation in areas of high ice concentration and thickness in the center of the region leads to a significant phase delay in the order of over 0.05 radians. In terms of the wavelength of the depicted transmitter, this phase delay corresponds to an error of around 7.5 m in distance estimation and approximately 25 ns in terms of propagation time. In the northern areas and around the Magdalen Islands (47–48° N, 61–62° W), the phase delay is in the order of more than 0.04 radians, resulting in an estimation error of around 6 m and a propagation delay of approximately 20 ns.
The plot clearly illustrates a correlation between sea-ice-covered areas along the propagation path and regions of high phase delay. The propagation pattern is not continuous but rather uneven in the region. At the transition from areas of high ice concentration to low ice concentration or from ice to sea water along the propagation path, the well-known recovery effect is clearly visible. This effect, also observed in mixed land-water propagation paths, is characterized by a decrease in phase delay after an initial increase in these regions.
Considering the high temporal and spatial dynamics of sea ice, these fluctuations mean significant variations in the phase delay of signals for navigation applications. These variations can occur within relatively short periods ranging from days to weeks, depending on the course of the ice season.
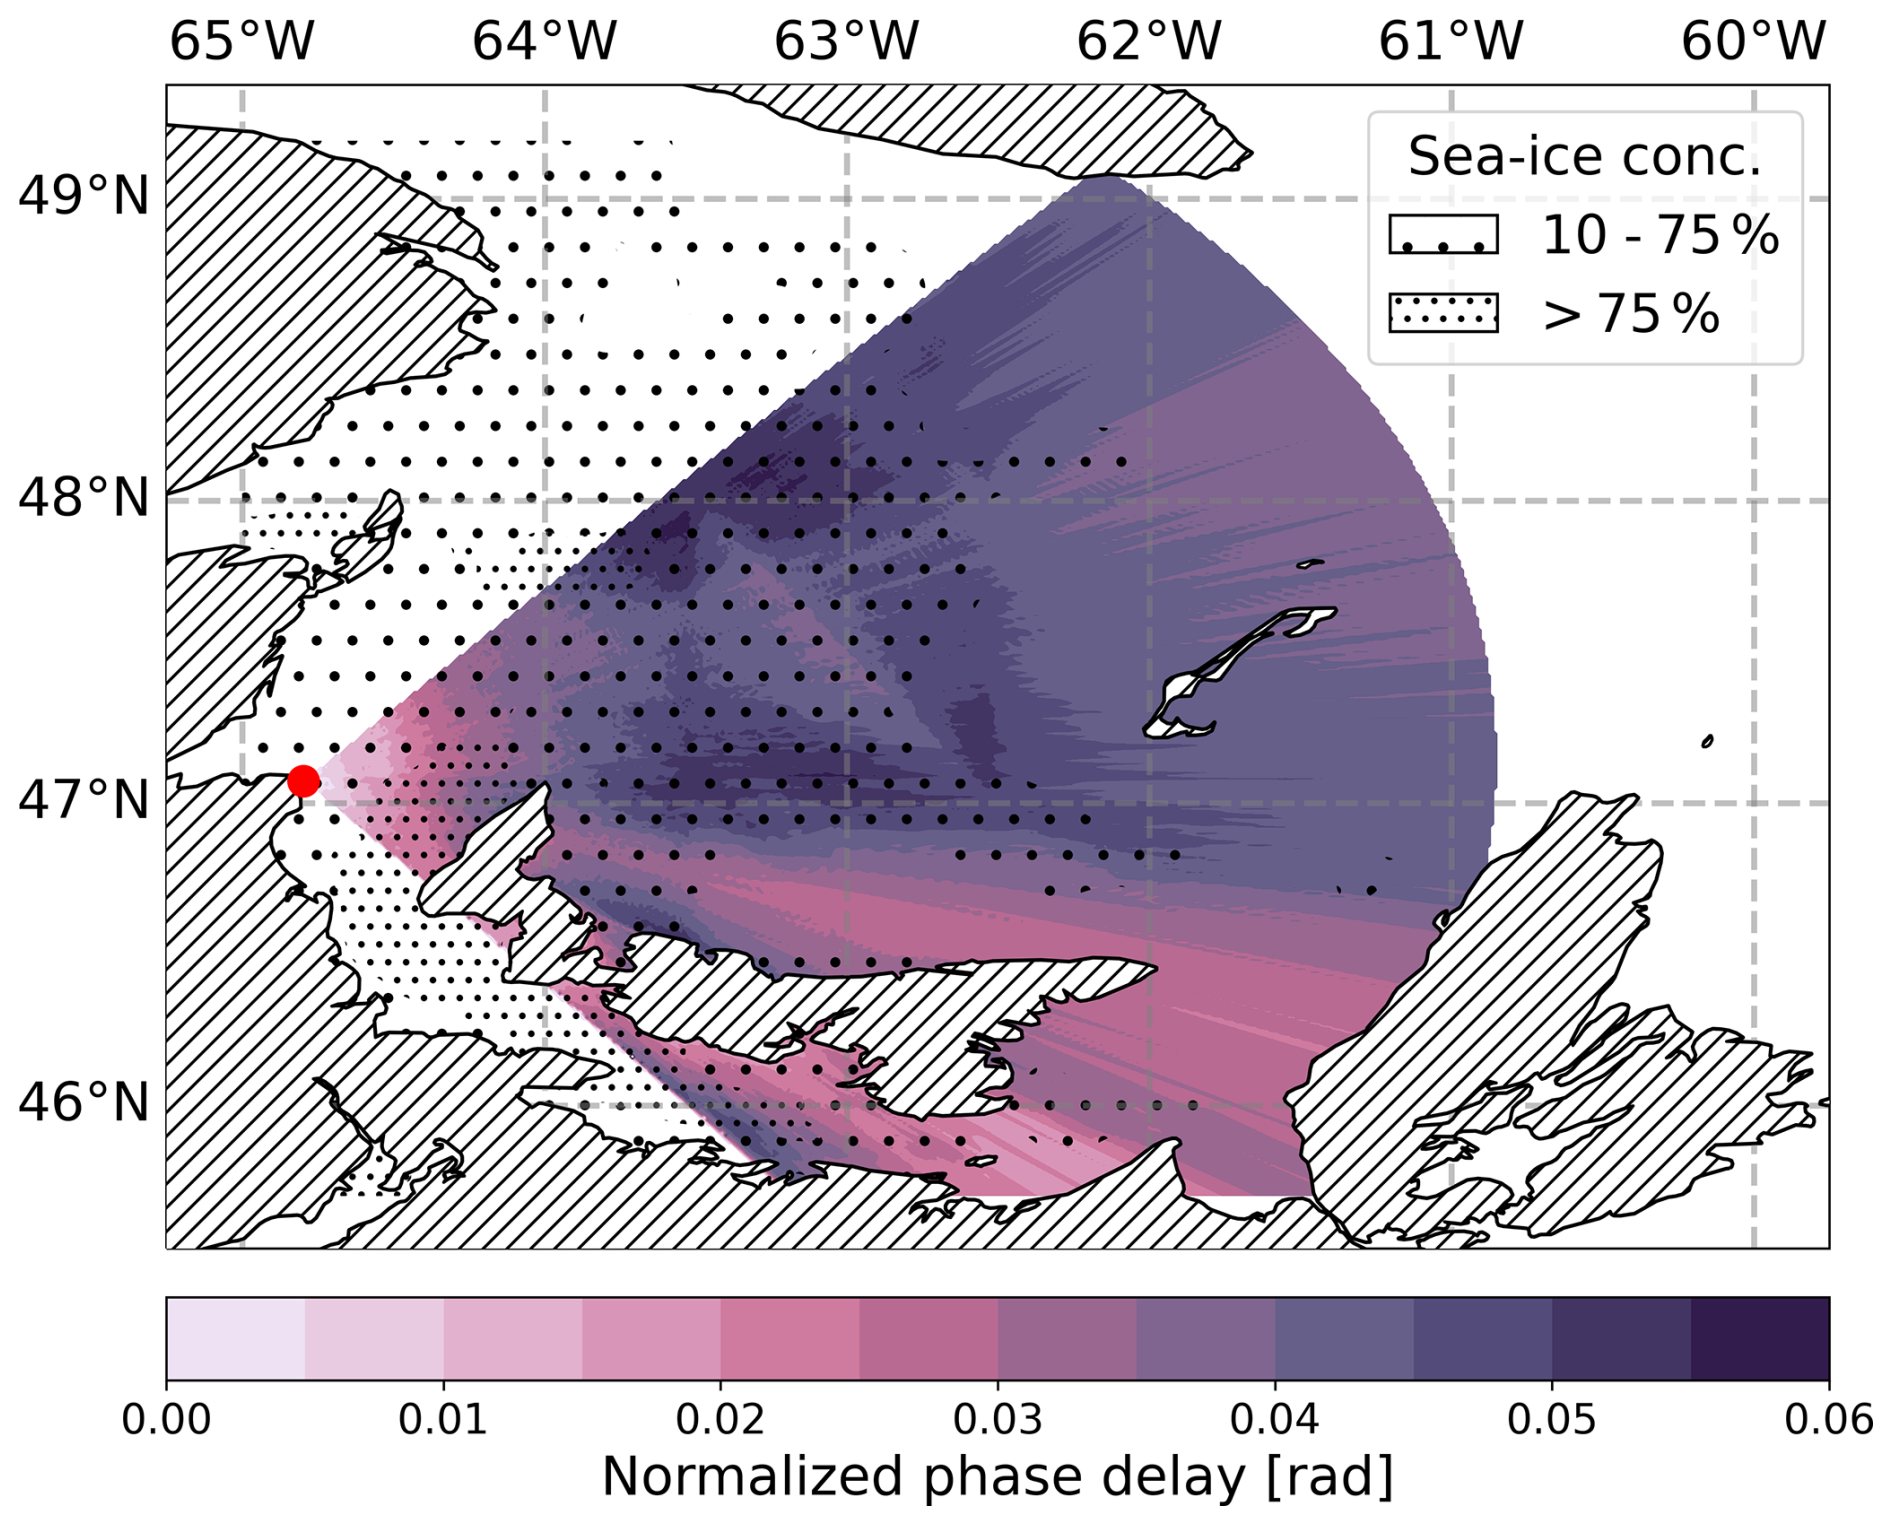
Figure 11ground-wave phase delay across sea ice in (rad) for St. Lawrence Gulf on 29 January 2019 normalized to sea water. Wide hatching depicts areas of more than 10 % and less than 75 % sea-ice-cover fraction. Narrow hatching depicts areas of more than 75 % sea-ice-cover fraction. The red dot marks the location of the Pont Escuminac radio transmitter.
3.2.2 Data set: 1 March 2023
For the dataset from 1 March 2023, different conditions are observed. Figure 12 shows the normalized phase delay for the data set. The ice thickness is smaller, the ice cover is less regionally confined and extends over large parts of the investigated region. The phase delay uniformly increases in the upper half of the normalized phase-delay distribution along the ice surface and over sea water. In the lower area near Prince Edward Island, the region with high ice concentration extends further into the Gulf in the direction of propagation, resulting in a uniform increase in the phase delay along the propagation direction, with the delay reaching an overall higher level.
However, despite the significantly larger extent of ice coverage throughout the region, the phase delay is still below the value from the previous example. Due to the high ice concentration near the coast of Cape Breton Island, the highest delay of 0.035 radians is reached there, corresponding to a deviation of around 5 m in distance estimation and 17 ns in terms of time error. Again, especially in the north, when the signal propagates over sea water, the recovery effect occurs, and the phase delay decreases.
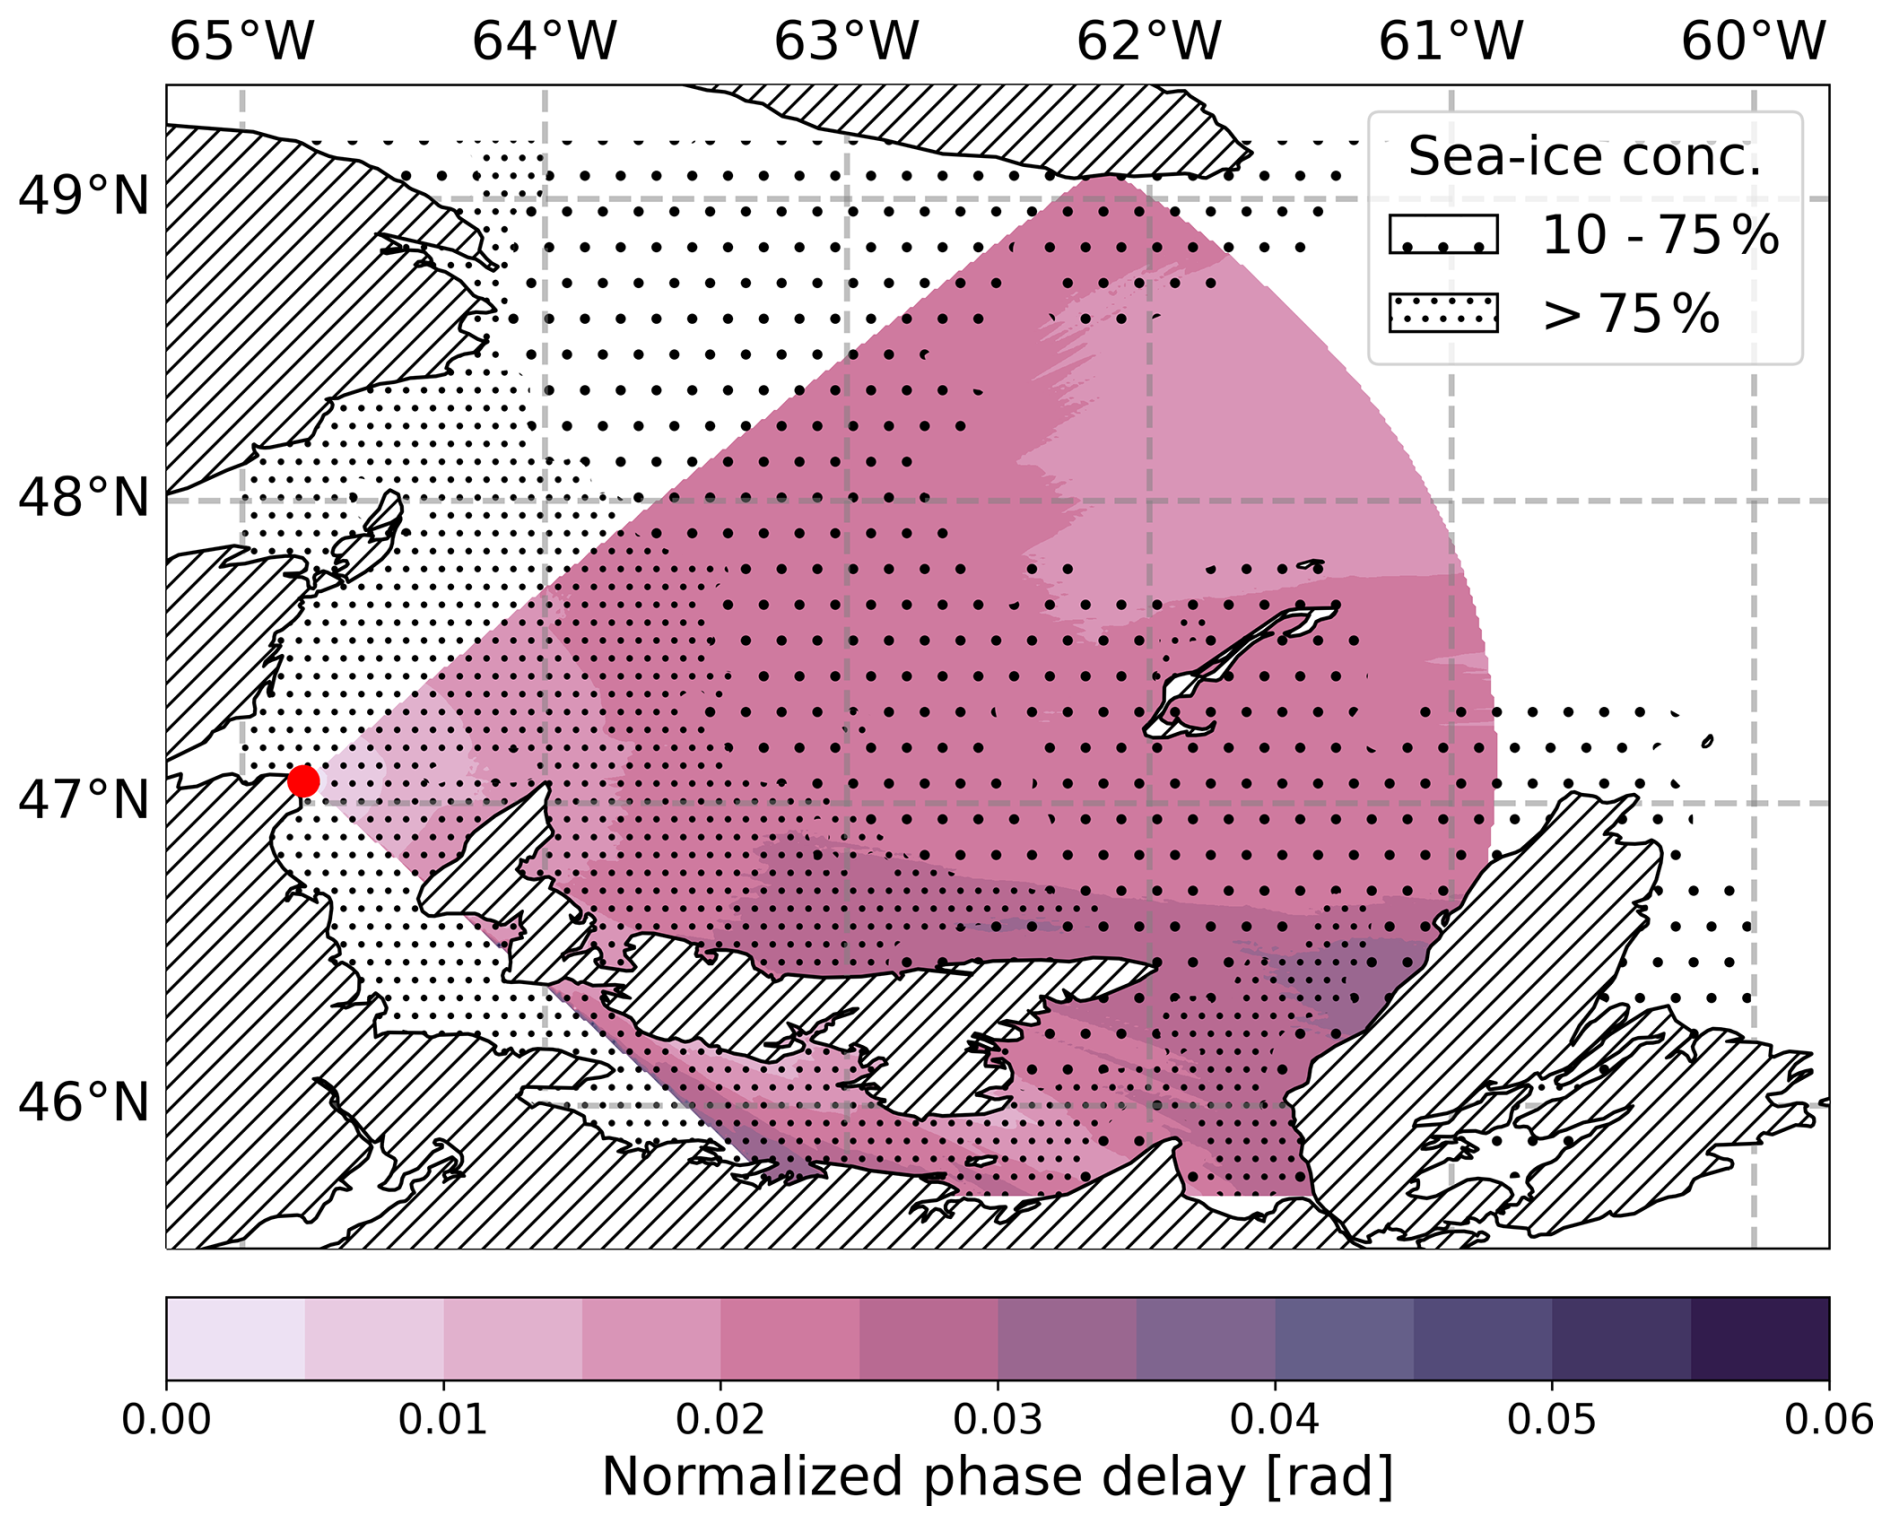
Figure 12ground-wave phase delay across sea ice in (rad) for St. Lawrence Gulf on 1 March 2023 normalized to sea water. Wide hatching depicts areas of more than 10 % and less than 75 % sea-ice-cover fraction. Narrow hatching depicts areas of more than 75 % sea-ice-cover fraction. The red dot marks the location of the Pont Escuminac radio transmitter.
3.3 Implications for radio navigation
Considering the course of the sea-ice season over the past decades, extensive ice coverage in the region is possible. Furthermore, a maximum thickness of 0.7 m, as observed in the year 2019, is not an exceptional occurrence, indicating that thicker ice in certain coastal areas in the future is not unrealistic. In light of the results, ice-covered areas near the coast with a certain extent and ice thickness exceeding 0.5 m already lead to significant changes in phase delays. Therefore, they represent a non-negligible error source for PNT applications.
In general, the effect becomes more pronounced in this specific scenario as the frequency of the radio signal increases. Radio navigation systems or other radio systems in the maritime domain, therefore, experience a smaller phase delay and lower amplification at low frequencies. At higher frequencies, the influence of sea ice is stronger. Considering the required accuracies in PNT applications, the impact of sea ice on signal propagation is non-negligible and should be taken into account.
The approach presented here provides a way to calculate delay and attenuation in a specific region and can, in principle, be used to compute daily updated AGDF maps. However, verification of the ground-wave propagation model through measurements and a more detailed investigation regarding the employed Copernicus data are necessary. Earth observation data serves as a good starting point but has limited applicability in critical scenarios due to its resolution of of a degree of latitude and longitude and its inability to provide reliable information regarding the exact extent, structure, location and thickness of sea ice. In the case of seawater, the propagation of the signal depends on the factors described above. The actual parameters can deviate from the values provided by the Copernicus data products, which leads to deviations between the ground-wave propagation model and measurement, particularly with regard to the actual ice position in relation to the thickness and extent of the sea ice due to the sensitivity of the propagation delay to these factors. Furthermore, signal propagation over land for example, if the transmitting station is not located directly on the coast, is sensitive to changes of ground electrical parameters. As for the sea, these parameters for the land are available with limited accuracy. A mode validation considering the metrological impact is foreseen for the future.
3.4 Proposed verification setup
For the verification of the approach, the authors suggest measurements that allow an assessment of the method, at least along an exemplary propagation path in the region. The selected path should be of sufficient length, depending on the sensitivity of the instruments, and cover an area with measurable sea-ice coverage. In the case of the presented scenarios, measuring signal strength and phase delay between the transmitter Pont Escuminac and the Magdalen Islands, located just over 200 km away, is suggested.
An approach to utilise Earth observation data for the calculation of phase delays of a ground-wave signal in a region with sea-ice coverage was presented. A tool chain was developed to derive a GEPD from Earth observation data and simulated using real-world data sets from Copernicus. The results indicate that sea ice in regions with extensive coverage has a significant impact on the signal propagation. Even a sea-ice thickness well below 1 m affects the performance of the radio navigation system MF R-Mode. For the ice coverage scenarios under investigation, the ground-wave propagation delay caused by sea ice is in the order of 20 nanoseconds for the 2019 season and 17 nanoseconds for the 2023 season. After successful validation, the outlined approach can help to calculate the estimated phase delay caused by sea ice on a regular basis for the MF R-Mode transmitters world-wide. Furthermore, it can help to bring the performance of R-Mode in winter navigation close to the summer values.
The data used for simulation was obtained from E.U. Copernicus services: https://land.copernicus.eu/global/products/lst (Copernicus Global Land Service, 2023a), https://land.copernicus.eu/global/products/swi (Copernicus Global Land Service, 2023b), https://doi.org/10.48670/moi-00016 (Copernicus Marine Service, 2023a), and https://doi.org/10.48670/moi-00021 (Copernicus Marine Service, 2023b). The simulation results are available upon request.
NH and FGR initiated the research project. All authors conceived and performed the initial investigation. NH implemented the simulation software and carried out the simulation. NH wrote the original draft. All authors were involved in editing and reviewing the manuscript.
The contact author has declared that none of the authors has any competing interests.
Publisher’s note: Copernicus Publications remains neutral with regard to jurisdictional claims made in the text, published maps, institutional affiliations, or any other geographical representation in this paper. While Copernicus Publications makes every effort to include appropriate place names, the final responsibility lies with the authors.
This article is part of the special issue “Kleinheubacher Berichte 2023”. It is a result of the Kleinheubacher Tagung 2023, Miltenberg, Germany, 26–28 September 2023.
The study was funded by the security and defence research at DLR as part of the project SiNaKoL. This study has been conducted using E.U. Copernicus Marine Service Information; https://doi.org/10.48670/moi-00021 (Copernicus Marine Service, 2023b), https://doi.org/10.48670/moi-00016 (Copernicus Marine Service, 2023a) and E.U. Copernicus Land Monitoring Service information. Special thanks for the excellent cooperation and support go to our Canadian partners Jean Delisle and Frédérick Hudon.
The article processing charges for this open-access publication were covered by the German Aerospace Center (DLR).
This paper was edited by Madhu Chandra and reviewed by Madhu Chandra and one anonymous referee.
Blazyk, J. and Diggle, D.: Computer Modeling of Loran-C Additional Secondary Factors, in: 36th Annual Convention and Technical Symposium, International Loran Association, Orlando, Florida USA, 14–17 October 2007, 2, 533, 2007. a
Buchhorn, M., Smets, B., Bertels, L., Roo, B. D., Lesiv, M., Tsendbazar, N.-E., Herold, M., and Fritz, S.: Copernicus Global Land Service: Land Cover 100m: collection 3: epoch 2015: Globe, Zenodo, https://doi.org/10.5281/zenodo.3939038, 2020. a
Copernicus Global Land Service: Land Surface Temperature, https://land.copernicus.eu/global/products/lst (last access: 20 January 2024), 2023a. a, b
Copernicus Global Land Service: Soil Water Index, https://land.copernicus.eu/global/products/swi (last access: 20 January 2024), 2023b. a, b
Copernicus Marine Service: Global Ocean Physics Analysis and Forecast, [data set], https://doi.org/10.48670/moi-00016, 2023a. a, b, c, d
Copernicus Marine Service: Global Ocean Physics Reanalysis, [data set], https://doi.org/10.48670/moi-00021, 2023b. a, b, c, d
DeMinco, N.: NTIA Technical Report TR-99-368 Medium Frequency propagation prediction techniques and antenna modeling for Intelligent Transportation Systems (ITS) broadcast applications, Technical report, NTIA, 1999. a
FAO: Harmonized World Soil Database, version 2.0, Tech. rep., FAO (Food and Agriculture Organization of the United Nations) and IIASA (International Institute for Applied Systems Analysis), https://doi.org/10.4060/cc3823en, 2023. a
Grundhöfer, L., Rizzi, F. G., Gewies, S., Hoppe, M., Bäckstedt, J., Dziewicki, M., and Del Galdo, G.: Positioning with medium frequency R-Mode, Navigation, 68, 829–841, 2021. a
Grundhöfer, L., Gewies, S., and Galdo, G. D.: Estimation Bounds of Beat Signal in the R-Mode Localization System, IEEE Access, 9, 69278–69286, https://doi.org/10.1109/ACCESS.2021.3076845, 2021. a
Grundhöfer, L., Wirsing, M., Gewies, S., and Galdo, G. D.: Phase Estimation of Single Tones Next to Modulated Signals in the Medium Frequency R-Mode System, IEEE Access, 10, 73309–73316, https://doi.org/10.1109/ACCESS.2022.3190544, 2022. a
Hehenkamp, N., Rizzi, F. G., Grundhöfer, L., and Gewies, S.: A Software Framework for the Parallel Computation of Ground Wave Propagation Delay and Attenuation, in: 2023 24th International Conference on the Computation of Electromagnetic Fields (COMPUMAG), 22–26 May 2023, Kyoto, Japan, 1–4, https://doi.org/10.1109/COMPUMAG56388.2023.10411797, 2023a. a, b
Hehenkamp, N., Rizzi, F. G., Grundhöfer, L., and Gewies, S.: Prediction of Ground Wave Propagation Delays in Terrestrial Radio Navigation Systems Based on Soil Texture Maps, in: Proceedings of the 2023 IEEE/ION Position, Location and Navigation Symposium (PLANS), 24–27 April 2023, Monterey, CA, USA, Monterey, CA, USA 1170–1175, https://doi.org/10.1109/PLANS53410.2023.10139977, 2023b. a
Hehenkamp, N., Rizzi, F., Grundhöfer, L., and Gewies, S.: Prediction of Ground Wave Propagation Delay for MF R-Mode, Sensors, 24, 282, https://doi.org/10.3390/s24010282, 2024. a, b, c
Hill, D. and Wait, J. H.: Ground Wave Propagation over Mixed Land, Sea, And Sea-Ice Paths, IEEE T. Geosci. Remote, GE-19, 210–216, 1981a. a, b, c, d, e, f
Hill, D. and Wait, J. H.: Radio Wave Transmission over Sea Ice And Remote Sensing Possibilities, IEEE T. Geosci. Remote, GE-19, 204–209, 1981b. a, b, c, d, e, f
ITU-R: World Atlas of Ground Conductivities, Tech. Rep. Recommendation P.832-4, International Telecommunication Union: Geneva, Switzerland, 2015. a
ITU-R: Electrical characteristics of the surface of the Earth, Recommendation P.527-6, International Telecommunication Union, Geneva, 2021. a
Johnson, G. and Swaszek, P.: Feasibility Study of R-Mode using MF DGPS Transmissions, Tech. rep., ACCSEAS, 2014. a
Johnson, G., Dykstra, K., Ordell, S., and Swaszek, P.: R-mode positioning system demonstration, in: Proceedings of the 33rd International Technical Meeting of the Satellite Division of The Institute of Navigation (ION GNSS+ 2020), 21–25 September 2020, virtual, 839–855, https://doi.org/10.33012/2020.17728, 2020. a
Johnson, G. W., Swaszek, P. F., Hoppe, M., Grant, A., and Šafář, J.: Initial Results of MF-DGNSS R-Mode as an Alternative Position Navigation and Timing Service, in: Proceedings of the 2017 International Technical Meeting of The Institute of Navigation, Monterey, CA, USA, 30 January–2 February, 1206–1226, https://doi.org/10.33012/2017.14886, 2017. a
Koch, P. and Gewies, S.: Worldwide Availability of Maritime Medium-Frequency Radio Infrastructure for R-Mode-Supported Navigation, J. Marine Sci. Eng., 8, 209, https://doi.org/10.3390/jmse8030209, 2020. a
Last, J., Williams, P., Peterson, B., and Dykstra, K.: Propagation of Loran-C Signals in Irregular Terrain–Modelling and Measurements Part 1: Modelling, in: Proceedings of the 29th Annual Convention and Technical Symposium, International Loran Association, 12–15 November 2000, Washington DC, Washington, USA, 13–15, 2000. a
Monteath, G.: Computation of groundwave attenuation over irregular and inhomogeneous ground at low and medium frequencies, NASA STI/Recon Tech. Rep. N, 78, 1978. a
Ott, R., Vogler, L., and Hufford, G.: Ground-wave propagation over irregular inhomogeneous terrain: Comparisons of calculations and measurements, IEEE T. Antenn. Propag., 27, 284–286, 1979. a
Pachon-Garcia, F. T.: 2DE-WAVE Tool for Computing Theoretical Field Levels at MF & HF band and Comparison with Experimental Values in a Real Environment, IEEE Antenn. Propag. M., 57, 294–306, 2015. a
Pu, Y., Sun, R., Zhao, Y., Zheng, X., He, J., and Xi, X.: Modified Integral Equation Method With Time-Varying Factors for Low-Frequency Ground-Wave Propagation Delay Prediction, IEEE Antennas And Wireless Propagation Letters, 21, 1303–1307, 2022. a, b
Rizzi, F. G., Hehenkamp, N., Grundhöfer, L., and Gewies, S.: Enhancement of MF R-Mode ranging accuracy by exploiting measurement-based error mitigation techniques, WMU Journal of Maritime Affairs, 22, 299–316, 2022. a
Spies, K. and Wait, J.: On the calculation of the ground wave attenuation factor at low frequencies, IEEE T. Antenn. Propag., 14, 515–517, 1966. a
Swaszek, P. F., Johnson, G. W., Alberding, J., Hoppe, M., and Oltmann, J.: Analysis of MF-DGNSS Modifications for Improved Ranging, p. 15, European Navigation Conference (ENC) 2014, Rotterdam, Netherlands, 2014. a
Urrego-Blanco, J. and Sheng, J.: Formation and distribution of sea ice in the Gulf of St. Lawrence: A process-oriented study using a coupled ocean-ice model, J. Geophys. Res.-Oceans, 119, 7099–7122, https://doi.org/10.1002/2014JC010185, 2014. a
Wait, J. R.: The ancient and modern history of EM ground-wave propagation, IEEE Antenn. Propag. M., 40, 7–24, 1998. a
Wait, J. R.: Electromagnetic waves in stratified media: Revised edition including supplemented material, vol. 3, Elsevier, ISBN 10 1483168441 ISBN 13 9781483168449, 2013. a
It is used in a tool chain to simulate signal propagation in a real-world scenario for the medium-frequency radio navigation R-Mode and assess the impact of sea ice on the signal propagation delays. The results indicate, that the effect of sea ice is significant and needs to be compensated.