Metrological Approach for Identifying Abnormalities and the Causes of Harmonics in Electrical Power Grids using Wavelets
Helge Lorenzen
Sebastian Koj
Saba Mylvaganam
In this work, current and voltage time series are analyzed using the continuous wavelet transform (CWT). It is shown that, in contrast to a Fourier transform, a CWT enables the detection and analysis of transient and short-term disturbances in power grids. This is particularly important during the commissioning and maintenance of power systems. So-called Daubechies wavelets are used as purposes. In addition, the family of complex Gaussian wavelets also allows resonance mode analysis. This approach enables the real-time series of current and voltage to be transformed into a complex time series. This shows that wavelets can be used to make statements about the active power transit even in the case of short-term disturbances in the power grid. Finally, practical examples of the application of this method complete this work.
- Article
(11326 KB) - Full-text XML
- BibTeX
- EndNote
A major transformation is currently taking place in the field of electrical energy systems. On the one hand, more and more decentralized generation units are being connected to the medium-voltage grid, but also to the low-voltage grid. On the other hand, more and more consumers are being installed in the low-voltage grid that require increased power, such as charging infrastructure for electric vehicles or heat pumps. Regardless of this, energy suppliers must constantly pay attention to grid quality, i.e., voltage levels, power quality, and harmonics in the grid must be within required limits. This means that not only low-frequency 50 or 60 Hz signals must be monitored, but that also fast, transient phenomena must be recorded and evaluated. Steady-state signals are typically analyzed using Fourier transformation. However, this only provides moderately satisfactory results when evaluating transient events in the power grid. As already shown by Lorenzen et al. (2023), Wavelet transformation can provide a solution here. Therefore, this paper aims to present the application of continuous wavelet transform (CWT) to real energy systems.
Thus, Sect. 2 addresses the most important aspects of wavelet transformation for this work. The Daubechies wavelet family is explained and their property of vanishing moments in a CWT is discussed. Complex Gaussian wavelets are also considered. Section 3 then presents examples of results obtained by applying CWT to synthesized signals for three-phase systems. The results are interpreted using scalograms. Examples taken from real measurement campaigns conclude this chapter. Section 4 examines the cause of voltage and current overshoot. Resonance phenomena at various grid points are analyzed using complex Gaussian wavelets. For this purpose, the calculation of active power using complex phasor and a visual representation of the CWT are used. Finally, Sect. 5 summarizes the most important aspects of this work.
In terms of structure, a wavelet transform is very similar to a Fourier transform. Both transformations are based on the convolution of a signal to be analyzed with a known reference signal. In the Fourier transform, the reference signals are harmonics. Their main property, the periodicity, is fixed. In the practical implementation of Fourier transforms, e.g. as so-called Fast Fourier Transforms (FFT), this means that singular transient events in analyzed signals are either not captured at all or are captured incorrectly (Qian and Chen, 1993; Fugal, 2009; Nicolae et al., 2012).
In contrast, so-called wavelets are used as reference signals in wavelet transformations. Here, countless wavelet types (wavelet families) are available, which can be selected for the transformation depending on the task (see Sect. 2.1). For example, wavelets with a small number of support values are advantageous when analyzing very short transient abnormalities (Fugal, 2009).
The Daubechies wavelet family and complex Gaussian wavelets are particularly important for this work, as they are suitable for analyzing signals in energy grids (voltage, current, power). These are explained and analyzed in Sect. 2.2 and 2.3, respectively. Subsequently, the wavelet transformation (Sect. 2.4) and in particular the CWT (Sect. 2.5) are essentially explained using these wavelets.
2.1 What is a wavelet?
A wavelet is generally understood to be a continuous function with special properties, which is represented in digital signal processing by a finite series of support values. In some cases, these support values are obtained simply by evaluating a definition equation (crude wavelets; at the desired points in time). In other cases, special algorithms or simple lookup tables define a wavelet, whereby wavelets with discrete function values are referred to as wavelet filters (Fugal, 2009). Strictly speaking, the practical results presented in this paper are therefore obtained using wavelet filters.
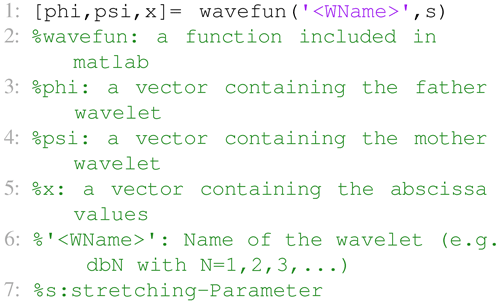
Common mathematical software tools can be used to generate wavelet support values, such as the MATLAB® function “wavefun” in the matlab listing from TheMathWorksInc. (2020), see Listing 1. As a result, this function returns the so-called father wavelet , the so-called mother wavelet and the variable x with the values of the abscissa, whereby the time t is entered here in this work. The mother wavelet is required to transform the signals to be analyzed from the time representation into the wavelet representation (wavelet analysis). The father wavelet used for the reverse transformation is not relevant for this work.
The parameter “<WName>” is a string and denotes the name of a specific wavelet, e.g. db1 for a first-order Daubechies wavelet, which will be discussed later. The stretching parameter s influences the number of interpolation values of the vector x with the values of the abscissa. Due to the constant sampling rate of a measurement data acquisition, the interpolation values are equidistant in time in metrological practice. Therefore, the number of interpolation values of the wavelet also determines the “duration” of the wavelet if the time t is used for the argument x.
2.2 Daubechies wavelets
Daubechies wavelets (named after Ingrid Daubechies) are a class of orthogonal discrete-time functions for which there is usually no continuous-time definition. The values of the wavelets are estimated from a set of initial values using special algorithms (Fugal, 2009). The Daubechies wavelets are not defined in terms of the resulting scaling and wavelet functions; it is generally not possible to describe them in closed form (Fugal, 2009). An exception here is the simplest Daubechies wavelet (db wavelet), the so-called “Haar wavelet”, according to Eq. (1).
In addition to the closed form definition, this db wavelet has the property that during a wavelet transformation, the first moment N=1 vanishes in the wavelet-transformed. Taking into account the moment order N of the db wavelet used, the convention “dbN” is used in this paper for the naming of the db wavelets, where “db” stands for Daubechies wavelets and “N” for the number of vanishing moments of the wavelet. The property of vanishing moments is discussed in more detail in Sect. 2.5. For the Mother Haar wavelet with the stretching parameter s, the following therefore applies ψHaar(s)=ψdb1(s).
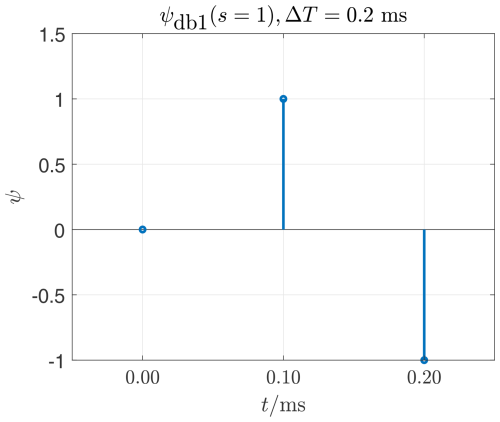
Figure 1In the case of the unitless x-axis returned by the Matlab function, both the range of values and the x-distance between the grid points vary depending on the name of the wavelet and the stretching parameter. For the time axis t used here, the time between two samples is always 0.1 ms since a sampling rate of 10 kHz is assumed. The duration of the wavelet Δ T is therefore proportional to the length of the vector ψ means the number of support values.
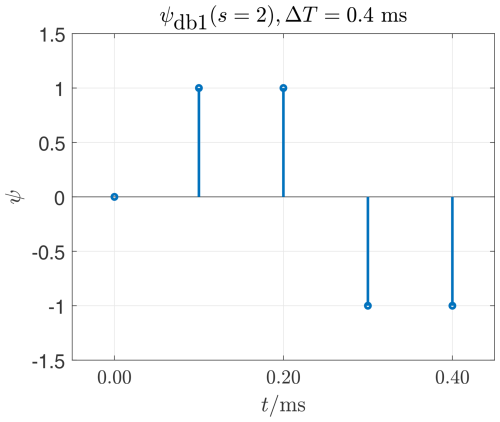
Figure 2The db1 mother wavelet stretched with s=2. Stretching increases the number support values. The duration of the wavelet ΔT is proportional to the number of support values, since a constant sampling rate is assumed.
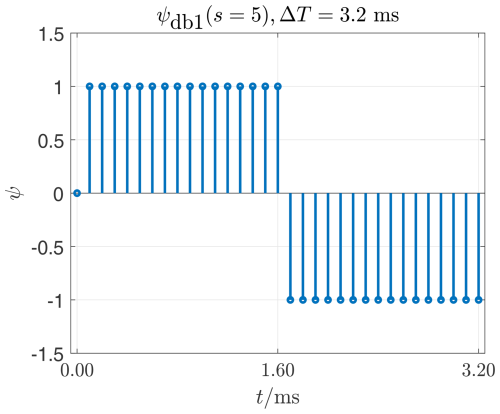
Figure 3The db1 mother wavelet stretched with s=5. The number of support values and therefore the duration of the wavelet, depends on the wavelet type (or its name) and increases with increasing stretching parameter s. The increase in duration is exponential.
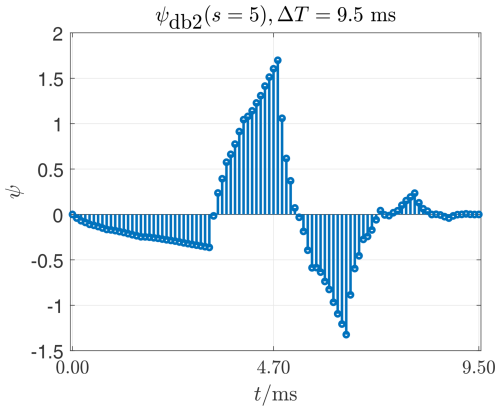
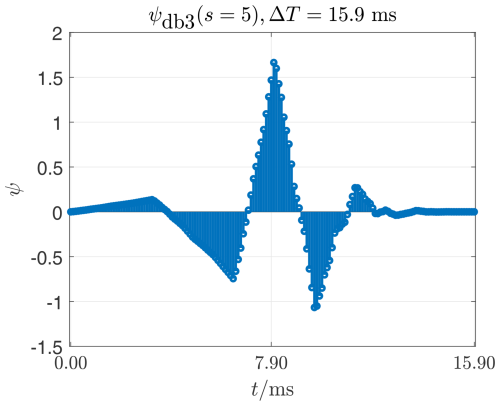
Figure 5The db3 mother wavelet (another completely different form used to make moments up to the 3rd order vanish) stretched with s=5.
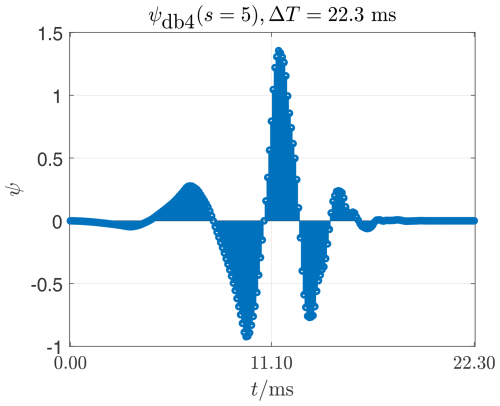
Figure 6Finally the db4 mother wavelet (used to make moments up to the 4th order vanish) stretched with s=5. The duration of this wavelet is ΔT=22.3 ms, which is approximately the duration of the fundamental oscillation at 50 Hz.
Figure 1 shows the db1, or Haar mother wavelet ψdb1(s=1) in its original form with stretching parameter s=1. In this work, the signal is always represented using the time t as an argument, whereby discrete-time values are used due to the sampling of measured values. The time interval Ts between two values therefore corresponds to the reciprocal of the sampling frequency fs, according to . This makes it possible to directly compare the time duration ΔT of wavelets with time intervals of the signals (e.g. with 20 ms period duration). For the wavelets in Figs. 1–6 a sampling frequency fs=10 kHz is used, resulting in a distance between two interpolation values of always Ts=0.1 ms. The temporal definition range for the ψdb1(s=1) according to Eq. (1) is therefore , the duration of the wavelet is therefore ΔT=0.2 ms. Due to the constant sampling frequency fs, the temporal definition range and the duration of the wavelet ΔT changes with the stretching parameter s.
When comparing Figs. 1–3, the influence of the stretching parameter s on a wavelet becomes visible. The parameter s does not change the shape of the envelope of the support values of a wavelet, but only the number of its support values. If the sampling frequency fs remains the same, the stretching parameter s also changes the duration of the wavelet ΔT. In order to influence the shape of the envelope of a db wavelet, the moment order N has to be changed. A comparison of Figs. 3–6 illustrates this aspect. Here, with constant stretching parameters s=5, the moment order N=1…4 is changed, which also influences the number of support points, but in particular the shape of the envelope. If the time interval Ts between two support values remains the same, the duration of the wavelet ΔT also increases as the moment order N increases. This property of db wavelets is crucial for the detection of abnormalities in signals using CWT. This is demonstrated in Sect. 2.5.
In summary, Figs. 1–6 show wavelets of the so-called Daubechies family. The stretching parameter s allows for an increase in the resolution of the signal under investigation after performing a CWT (higher number of support points). The parameter N defines the wavelet moment number. This property of Daubechies wavelets allows for the analysis of abnormalities in the moments of the signals under investigation (mean, standard deviation, curvature, etc.).
2.3 Complex wavelets
Figure 7 shows a wavelet from the family of complex Gaussian wavelets ψcgau. This is a crude wavelet based on the continuous-time function in Eq. (2).
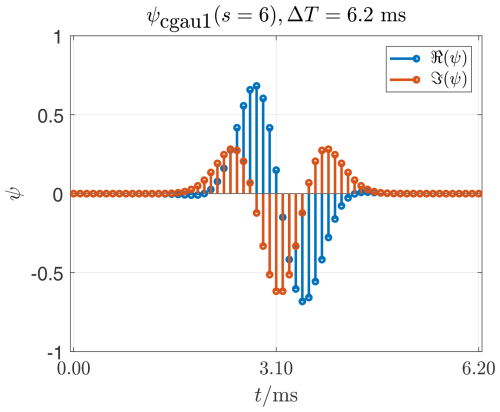
Figure 7Real part ℜ(ψ) and imaginary part ℑ(ψ) of the complex Gaussian wavelet ψcgau1. A crude wavelet which (unfortunately) has no vanishing moments.
This family is based on the complex Gaussian function. Complex-valued wavelets provide phase information and are therefore of great importance for the time-frequency analysis of transient signals. Unfortunately, abnormalities in the moments (mean, standard deviation, curvature …) cannot be analyzed with these wavelets. In Sect. 4 it is applied to current and voltage time series to investigate the propagation of harmonic active power.
2.4 Wavelet transformation
Wavelet transform (WT), similar to the Fourier transform (FT), is a way of analyzing time signals by decomposing them into reference signals. A complex reference signal e−jωt or a pair of orthonormal, harmonic functions is used for the Fourier transform. The Fourier transformation rule is as follows Eq. (3)
with the complex Fourier transform X(ω) and the time signal to be transformed x(t) (Strang, 2007).
Instead of harmonic functions of different frequencies (or period durations), the wavelet transform uses so-called wavelets as a reference signal (Fugal, 2009). The continuous wavelet transform (CWT) is given by Eq. (4)
with the function to be transformed x(τ) (for example a voltage or current measurement series); with the wavelet function ψ(t) (“mother wavelet”), which can be selected differently depending on the application; with the translation parameter t for scanning the data from x(τ) in the temporal or spatial dimension and with the scaling parameter a (Strang, 1996).
The transformation according to Eq. (4) can also be represented for a measured signal, e.g. a voltage u(t), as a convolution of the function u(t) to be transformed with a wavelet ψ(t), according to Eq. (5)
where capital letters always represent the wavelet transform (here in the example U(t)), with κ a scaling parameter is introduced, similar to a in Eq. (4).
The formula in Eq. (4) describes the so-called continuous wavelet transformation (CWT), whereby it is applied to discrete data. The term “continuous” refers here to a continuous scaling by varying (stretching or shrinking) the reference signal, i.e. the wavelet, and the subsequent convolution for each scaling according to Eq. (5), (Fugal, 2009).
The result of the CWT provides a multiple of the data volume of the original signal and can be displayed as a high-resolution image with a correspondingly large number of pixels (scalogram). This increased resolution of a CWT is of crucial importance for this work. For the applications considered here in the field of electrical power engineering, the scalograms obtained with CWT provide very good optical detection and intuitive interpretability, even for very short-term abnormalities in voltage and current measurement series recorded at electrical equipment.
2.5 CWT of synthesized discrete-time signals using db wavelets step by step
A very nice and useful feature of the Daubechies wavelets is the concept of the vanishing moment, the effect of which is demonstrated below. For this purpose, the CWT is to be applied to a synthetic polynomial function
corresponding to Eq. (6).
Figure 8 shows the graph of a discrete-time function which is constant in the intervals [0...5 ms] and [5...10 ms]. This function can be described as a polynomial function according to Eq. (6) with:
and . The CWT is now applied to this function u(t) with a Daubechies wavelet starting with the simplest, the db1 in its original form, i.e. the unstretched mother wavelet as introduced in Fig. 1.
The CWT is calculated by convolving the time function u(t) with the ψdb1 wavelet.
Since both u(t) and the ψdb1(t) are present at discrete times tk, the convolution is implemented via a sum, according to Eq. (9)
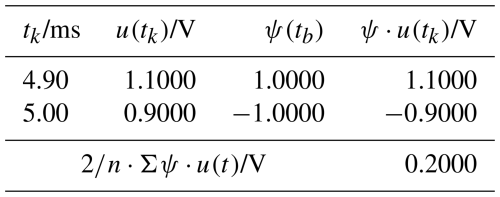
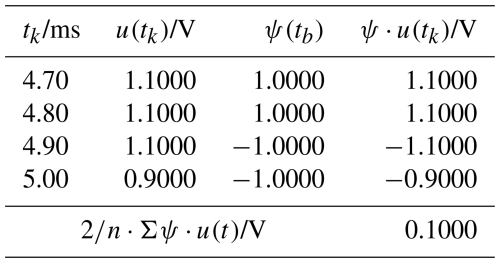
In this case, according to Eq. (9), this is simply the difference between two successive values u(tk) multiplied by a scaling factor κ. This always results in a value of zero for a “constant” function and a value other than zero only at the position of an abnormality (e.g. change in the value , see Table 1). The scaling has been selected here with so that U(tk) corresponds to the amount of change in the function u(tk). Here, n is the number of interpolation values of the wavelet.
In the result of the CWT according to Eq. (9), the mean value, i.e. the first moment, before the abnormality or after the abnormality has disappeared, i.e. U(tk)=0. At the point tk=5 ms the result is . The abnormality (change in the mean value or “constant” function value) is thus obvious.
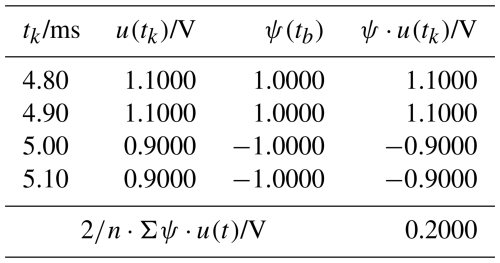
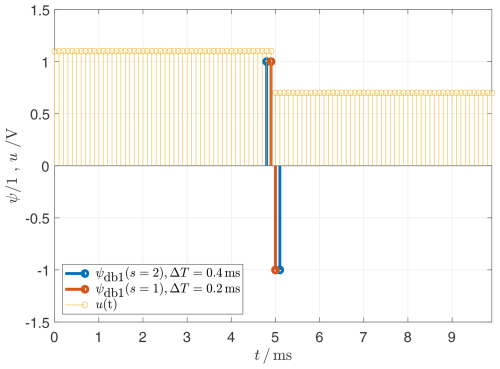
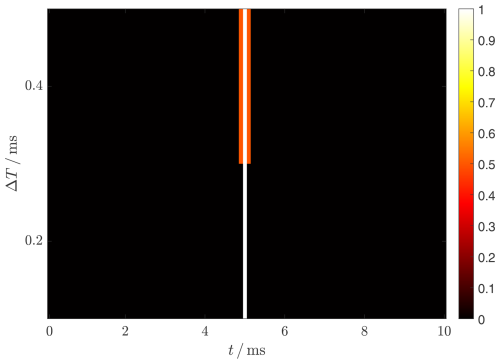
In the next step, the convolution is repeated with the stretched wavelet ψdb1(s=2). Table 2 and Fig. 9 are used to show this. The same value for the transform results again at the point of discontinuity. The step also affects the neighboring values and , shown with Table 3 and Fig. 10. The findings of the CWT are visualized as a graph in Fig. 11 and as a scalogram in Fig. 12.
In the scalogram, the brightness or color represents the value of the transform U(tk) normalized to the maximum amount. The column, or the abscissa value, also represents the time tk. The row or ordinate in the scalogram represents the duration ΔT or the number of interpolation values of the wavelet that have led to this value. The visualization of the CWT results by means of such scalograms enables a quick and intuitive detection and analysis of abnormalities in measured current and voltage measurement series.
The property of a db1 wavelet shown here to make the first moment of a function disappear makes it possible to detect the change in the mean value as an abnormality. Similarly, a db2 wavelet allows the first AND the second moment of a function to vanish. This means that a db2 wavelet can be used to detect abnormalities in both, the constant function value (mean value) and the slope (standard deviation) of a function. The same can be said about a db3 wavelet and the first, second and third moments (mean value, standard deviation and skewness) of a function. In general, it follows that a dbN wavelet causes all moments of a polynomial function up to degree N to vanish. Changes in the coefficients are detected as abnormalities with U(tk)≠0.
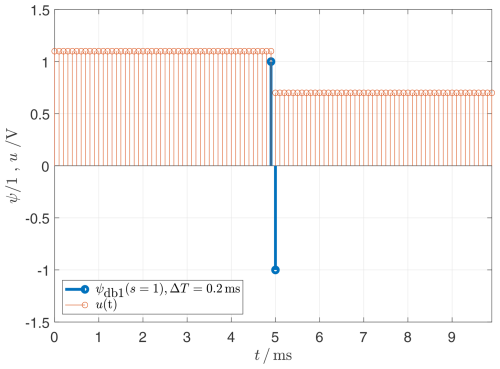
Figure 8Constant definition in sections. The Haar wavelet provides a contribution at this point, only.
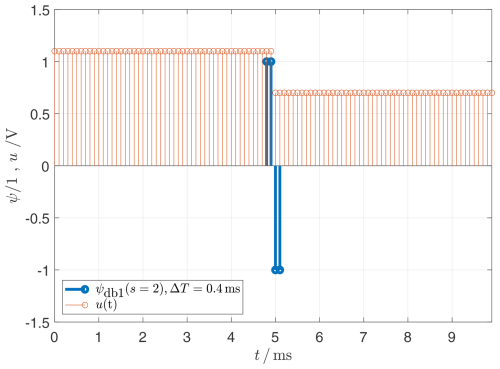
Figure 9By stretching the wavelet, neighboring time points of U(t) are also not equal to zero as well.
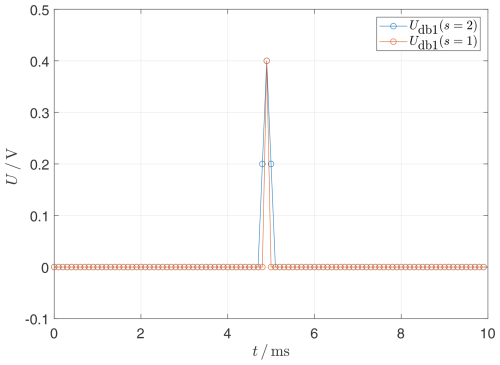
Figure 11Result of the transformation shown as a set of curves, based on samples in Fig. 10.
2.6 Quantities and edge artifacts
Finally, it should be emphasized here that the tools described are used to localize abnormalities and not to determine quantities. Accordingly, the values are scaled and the sign is ignored by forming the magnitude of the scalograms. A quantitative interpretation is therefore only permissible to a limited extent. It should also be noted that during the transformation at the temporal edges of the analyzed signals, a protrusion of the wavelet over the time function occurs. In the case of numerical findings, this very quickly leads to edge artifacts that nonsensically extend the range of the transformed values, which makes a meaningful interpretation of the findings difficult or even impossible. Experience has shown that these edge artifacts are not a problem in metrological practice if the sampling of the data is started with a sufficient lead time and ended with a slightly longer recording time (about ΔT of the most stretched wavelet).
In electrical power engineering, systems with three or four conductors dominate. In normal operation, single-phase equivalent quantities are traditionally used for the fundamental oscillation. A single-phase consideration can lead to extreme errors due to the coupling between the conductors if sufficient symmetry cannot be assumed. Considering variables such as the system impedance separately for each of the three conductors is also very problematic. Especially for low-voltage grids, assuming symmetry even in normal operation is risky.
Even with a 3-pole short-circuit to earth, at least the initial short-circuit current is always asymmetrical. Due to the dependence on the phase angle at the moment the fault occurs, even planned and deliberately induced short-circuit currents can only be predicted to a very limited extent and are hardly reproducible. Parameters and planning data such as minimum and maximum steady-state short-circuit current Ik and the decaying variables and are usually determined in accordance with IEC 60909-0 (EN60909-0 2016, VDE0102) using the transformation of fundamental quantities in symmetrical components (positive-, negative- and zero-sequence).
The determination of supply voltage characteristics is now uniformly regulated by the European standard (IEC 61000-4-30, 2021). This enables the quantitative assessment of the frequency and level of the supply voltage, flicker, voltage dips, voltage surges and voltage interruptions, rapid voltage changes, transient voltages, unbalance, harmonics, interharmonics and the testing of compliance with limit values, e.g. specified in DIN EN 50160 (2020). The procedure described below, on the other hand, focuses on ad hoc detection and classification of abnormalities, e.g. during commissioning of systems or troubleshooting.
3.1 Process concept and premises
The CWT-based method presented here makes it possible to analyze 3-phase voltages and currents in order to localize phenomena in time and classify them using scalograms. According to typical patterns the following abnormalities can be detected:
-
symmetrical abnormalities: e.g. zero sequence events like indirect lightning strike or ripple control signals. These abnormalities can be recognized by different shades of gray.
-
asymmetrical abnormalities: e.g. single-pole earth fault or insulation fault. These abnormalities can be recognized by different phase depended colors.
The method can be used regardless of the voltage level. In this work, synthesized low-voltage signals (Sect. 3.3) and metrologically obtained medium-voltage signals (Sect. 3.4) are presented and analyzed as examples.
The method is based on the following premises:
- a.
Harmonic functions can be approximated well with continuous and continuously differentiable polynomial functions defined by sections such as Eq. (6).
- b.
Events such as the change in frequency or the amplitude of harmonic functions cause changes in slope and curvature. This is followed by a change in the coefficients of the interpolating polynomial.
- c.
The changes of coefficients in polynomial functions can be well localized by means of CWT generated scalograms, since time-invariant moments disappear by using Daubechies wavelets in the CWT, as shown in Sect. 2.4.
To achieve the best possible fit of the harmonic functions to a polynomial, the degree of the polynomial during interpolation should be as high as possible. This ensures maximum sensitivity to temporal variances and the best possible suppression of artifacts by the remaining residual.
However, a high polynomial degree also has disadvantages because, for example, the temporal uncertainty increases with the increasing polynomial degree due to the rising number of required sampling points and thus the duration of the wavelet. Furthermore, high-degree polynomials can introduce an artificially generated oscillation that distorts the measurement data. In investigations of current and voltage measurements in 50 Hz power supply grids with the sampling rate of approx. 10 kHz often used here, it was possible to obtain easily interpretable findings when using Daubechies wavelets dbN with N=4. A CWT with a db4 wavelet enables the disappearance of the first four moments of the fundamental of the analyzed signal (continuous change in level, slope and curvature) and the resulting interfering artifacts. This simplifies the detection of transient phenomena significantly.
However, the presented method is not limited to harmonics in 50 or 60 Hz grids. Subharmonic oscillations such as those typically occurring in turbo generators can also be detected and identified using the characteristic scalograms if the representation is expanded vertically by means of a large stretching parameter. The fundamental oscillation does not have to be constant. The method is therefore also a valuable tool for analyzing vector jumps and frequency gradients (ramping up when lifting loads) in asynchronous machine drives with frequency converters, for example.
The methodology for three-phase electrical quantities is explained in Sect. 3.2 and then applied to synthesized data in Sect. 3.3. In Sect. 3.4, findings from the application of the method in the context of free-field tests at a wind turbine are presented.
3.2 Methodology and procedure
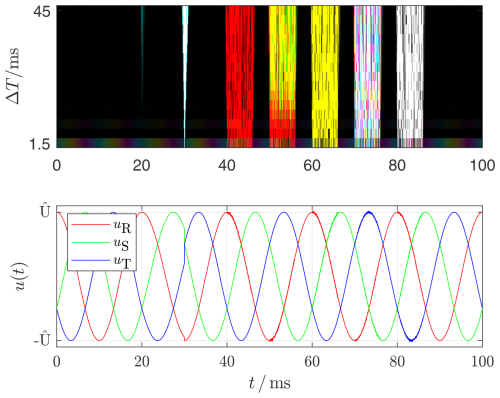
For each of the three conductor voltages , as for the test signals in Sect. 2.5, the magnitude of the wavelet transformation is calculated by means of CWT using a Daubechies wavelet ψdb4. A red-green-blue (RGB) scalogram is introduced here to visualize the result of the CWT of the 3-phase signal. For this purpose, an RGB intensity, i.e. a color channel, is assigned to each transform of the conductor voltages according to Table 4.
This results in the subplots shown in Fig. 16, which are superimposed in Fig. 17 to form an overall picture. The scaling factor κ is optimized individually for each strain for maximum contrast, but uniformly for all three conductors in order to make the symmetry of abnormalities recognizable.
The RGB visualization was specially developed for use on three-phase grids. However, the CWT itself is not limited to this and is also very useful for DC drives with converters.
3.3 Procedure demonstration based on a synthesized 3-phase low-voltage time series
In order to demonstrate the procedure, time series with sampled values are generated here using the function Eq. (10)
with
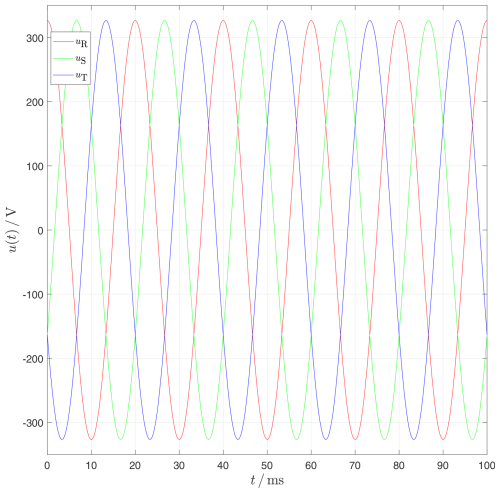
and These time series correspond to the idealized three-phase voltage curve over 5 periods in a 400 V low-voltage grid. Figure 13 shows the graph of the undisturbed voltage time curve.
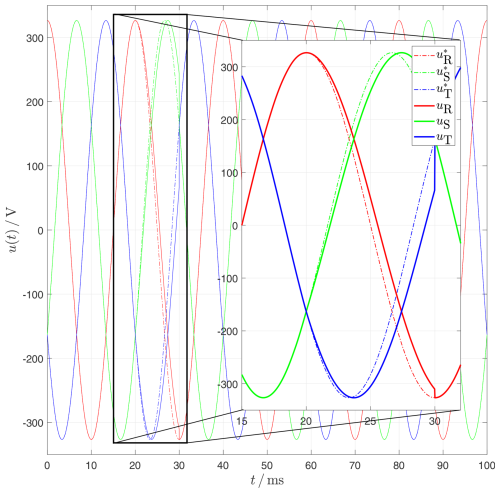
Figure 14Change of the grid frequency from 50 to 45 Hz for the interval [20...30] ms. For comparison, the undisturbed voltage time curve from Fig. 13 is added as a dashed line.
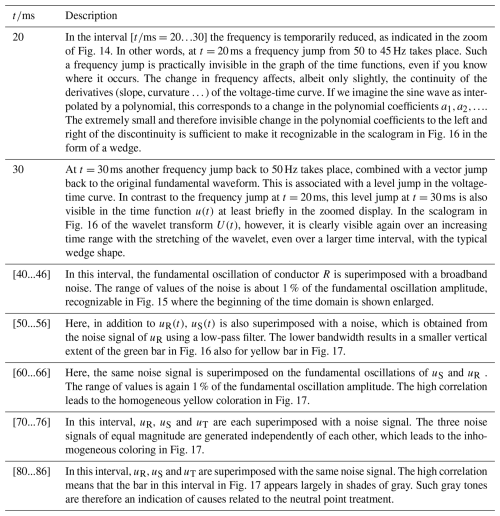
The initially ideal-typical process is manipulated at six points in such a way that a typical abnormality arises at these points during the subsequent analysis. For each of the resulting abnormalities, the type of manipulation is explained in Table 5 and the associated finding by the analysis procedure is described.
Figures 14 and 15 show individual fault types, which are highly magnified in the time domain. The most important illustration is Fig. 17, where the graphs of the three voltage time series are plotted against the RST-superimposed scalogram as the result of the analysis.
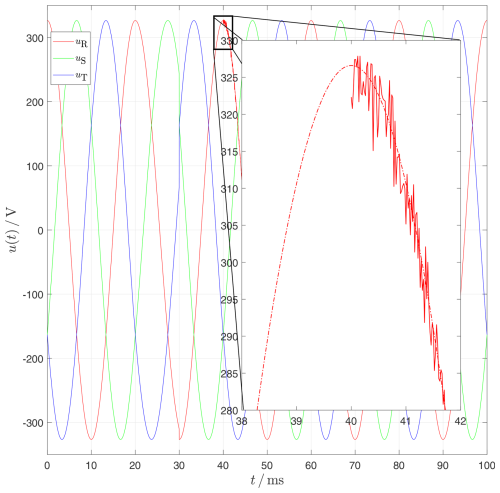
Figure 15Superimposition of a noise on the idealized voltage uR starting at t=40 ms. The amplitude of the noise amounts to 1 % of the fundamental amplitude. The dashed line shows the undisturbed voltage curve again.
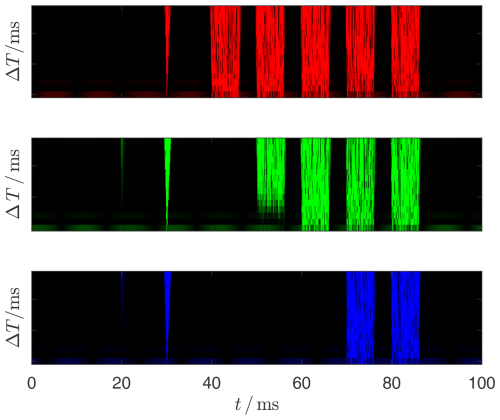
Figure 16Monochrome scalograms generated using CWT for each of the 3 conductor voltages uR, uS and uT. The scaling of the transforms is uniform for all three conductors. The value of the transform U(t) corresponds to the color intensity. The assignment of the color channels is according to Table 4.
3.4 Application of the method in the context of open-field tests at a wind turbine
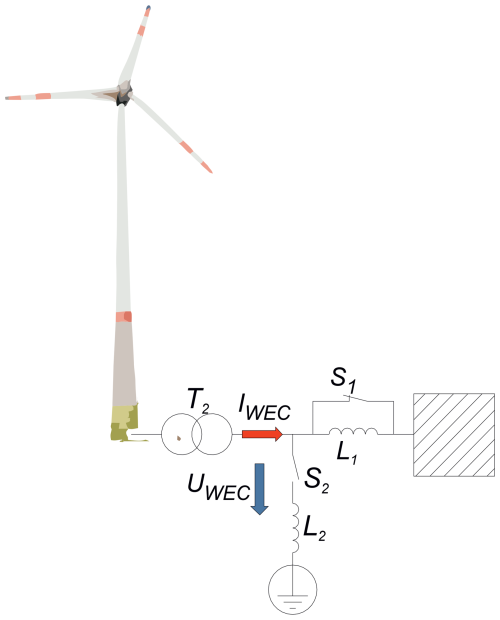
The procedure explained above for the RGB visualization of CWT results is applied in the context of free-field measurements at a wind turbine. For this purpose, a test container (40 feet) according to Figs. 18 and 19 with a transmission power of 30 MVA is looped into the 20 kV medium-voltage connection line of the wind turbine. By switching the air-core chokes accordingly, a wide range of grid fault events can be simulated.
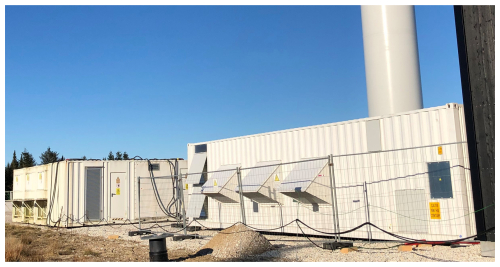
Figure 18Exterior view of test containers for the experimental setup at the wind turbine. Source: http://delta-energie.de (last access: 8 January 2025).
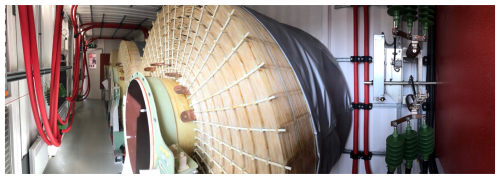
Figure 19A look inside one of the test containers. In the foreground, some taps can be seen on one of the man-sized air coils. Source: http://delta-energie.de (last access: 8 January 2025).
Figure 20 shows a highly simplified sketch of the principal design of the free-field experiment with a single-phase equivalent circuit diagram. The hatched area represents the medium-voltage grid. L1 represents a set of three-phase inductive coils for limiting the short-circuit current. S1 represents a set of circuit breakers that allow L1 to be deactivated as a bypass. S2 represents a set of circuit breakers that can be used to simulate different grid faults and L2 a set of air-core reactors that allow for the configuration of different residual fault voltages. This also allows the behavior in the event of faults in the higher-level high-voltage grid to be simulated, taking into account the vector groups and star point treatment of the substation, as well as sequences of subsequent faults.
3.4.1 Viewing the time series
In the following, the sequence of a typical undervoltage ride-through (UVRT) test is considered section by section and the associated time series are explained.
t<28.77 s
The reactor L1 is initially short-circuited via S1 and is therefore ineffective. The reactor L2 is initially ineffective due to the open circuit breaker S2 in series. The plant is feeding in about 700 kW of active power. The current contains noise components, which can be seen in Fig. 21. The voltage at the wind turbine in this time range is unremarkable, see Fig. 22.
t≥28.77 s
When S1 is opened, L1 is in series with the short-circuit impedance of the grid connection point. In Fig. 22 an influence on the voltage is clearly visible. The current time characteristic is only slightly affected by an additional longitudinal reactance in this type of wind turbine. In the transient current time characteristic in Fig. 21, one can only make guesses about a change having occurred or not. Even if one zooms in on the moment the change is still difficult to see.
t≥30.8 s
The switch S2 is closed. Due to the ratio between L1 and L2 the voltage UWEC drops to 50 %, see Fig. 22. This tests simulates the short circuit fault. As this type of wind turbine is designed as current source, the current does not change for the first moment. Due to the error strategy of the wind turbine, the current is set to 0 A shortly afterwards, as shown in Fig. 21.
t=31.8 s
The switch S2 is opened. The voltage jumps to the open-circuit voltage, causing the transformer to draw an enormous inrush current for the magnetization from the grid. Due to the permissible voltage, the inverter ramps up the current again, but this is initially lost in the inrush current of the system transformer (t≈31.9 s).
t=33.8 s
Here, by closing S1, the series reactor L1 is bridged again and the original standard state is restored.
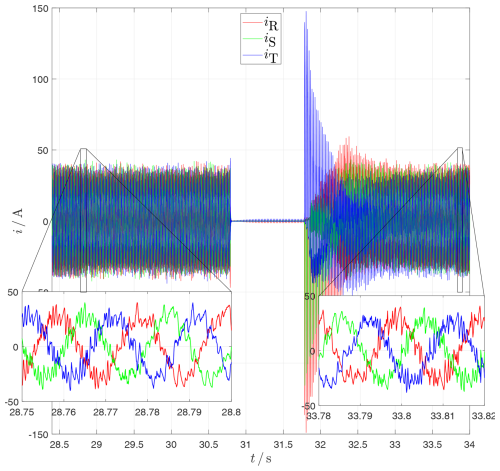
Figure 21Transient current IWEC at the grid connection point of the wind turbine. Switching on L1 at t=28.77 s reduces the harmonic bandwidth (low-pass behavior). At the 3-phase ground fault (t≈30.8 s), the current is practically 0 A (current source) with 50 % residual voltage and not, as one might think, very large. After switching off L1 at t=33.8 s, the initial state is restored (no low-pass behavior). The corresponding voltage drop is shown in Fig. 22.
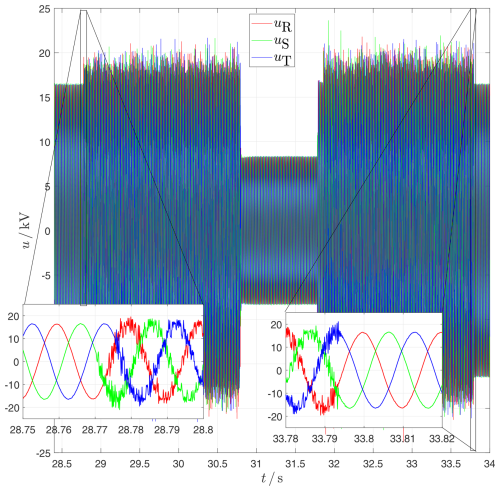
Figure 22Transient voltage UWEC at the grid connection point of the wind turbine. Activating the 3-phase choke L1 in the series path significantly increases the reactance of the grid impedance from the wind turbine's point of view and reduces the effectiveness of the turbine's grid filter. Thus, the harmonics can now be seen not only in the current but also in the voltage at the point of common coupling (PCC) of the turbine.
3.4.2 Analysis with CWT scalograms
In Fig. 23, there is no indication of local resonances (no bright spots) or asymmetries (no dominant red, green or blue areas). L1 increases the amount and in particular the ratio of the effective grid impedance. This causes a significant impairment of the voltage quality due to the harmonic currents fed in with the fundamental power. This is not critical, however, since it only occurs when L1 is effective and which is only looped in temporarily for this test.
A warning signal would be if one of the three colors (R, G, B) dominated in one of the two vertical light stripes in Fig. 23 or Fig. 24. In Fig. 24 one can see that due to the tolerance band control a broadband noise is typical of this type of wind turbine (extended vertically over ΔT). L1 causes only a small reduction in the switching frequency of the switching transistors (IGBTs) of the inverter when connected in series. During the voltage drop, the system switches to zero power mode for about 1 second as specified by the grid operator. This can be recognized by the narrow, continuous vertical black stripe. Both current influences cause a dark triangle pointing with the tip upwards, indicated by the yellow arrows. Overall, Figs. 23 and 24 give no cause for concern. The system and test container have apparently behaved as designed.
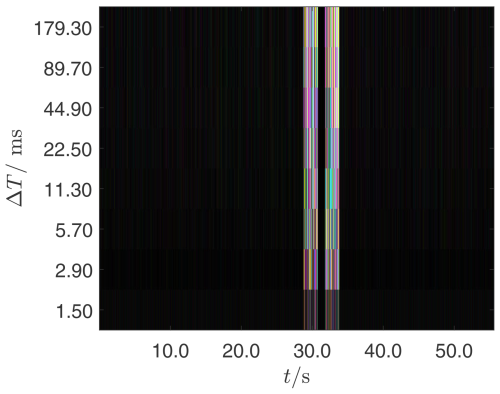
Figure 23Scalogram of the voltage at the grid connection point of the wind turbine corresponding to the transient representation in Fig. 22. Abnormalities are different from black. The colored vertical bars show a broadband uncorrelated noise of the voltages (colored not gray). This is a consequence of the voltage drop across the series choke L1 which is active due to the open switch S1. A defect in the series reactor or a fault in the inverter is typically asymmetrical. In these cases, one of the colors red, green or blue is dominant or underrepresented, which is not the case here. Without the series reactor L1, the harmonic currents have practically no effect on the voltage due to the low system impedance. The system does not supply any power while the fault is present. Although the fundamental oscillation is reduced to 50 %, it is sinusoidal and therefore inconspicuous (black) for the ΔT under consideration.
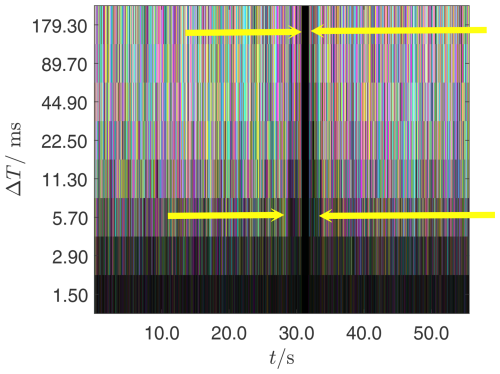
Figure 24Scalogram of the wind turbine current corresponding to the transient shown in Fig. 21. The broadband noise is dominant here due to not black areas. This is not a fault, but a design feature of this type of inverter. For the current is 0. This leads to a vertical black bar in the interval between the upper arrows. The activation of L1 for reduces the currents' higher harmonics at ΔT=2.9…5.7 ms (∼ higher frequencies). This leads to the wider black bar at the bottom of the scalogram (lower arrows).
In the voltage scalogram in Fig. 23 (when L1 is switched on), a similarity to the synthesized noise in Fig. 17 can be seen. The current scalogram in Fig. 24 is also very typical. The system behaves (typically for the manufacturer) more like a current source. The fundamental current is unaffected by the grid impedance (this is controlled by the DC link voltage). The slightly darker area in Fig. 24 shows where the series reactor L1 was effective. (Limiting the maximum switching frequency and slightly reducing the average switching frequency in the inverter with the functional principle of tolerance band control). The CWT in conjunction with the visualization as an RGB scalogram makes it possible to detect and localize the typical pattern in 3-phase inverters, for example, at a glance and, in some cases, to classify it without a complex detailed analysis (zooming). Erroneous behavior is asymmetrical in the vast majority of cases and leads to the dominance of one of the three RGB colors.
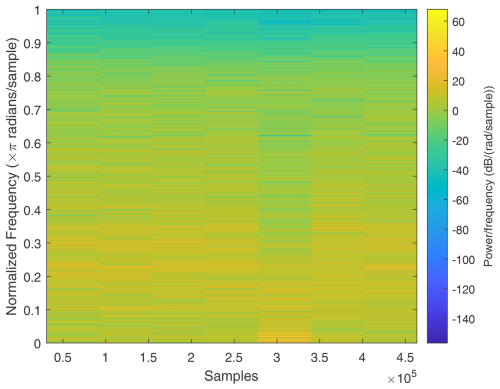
In order to illustrate the effectiveness of the CWT scalograms, Figs. 25 and 26 show scalograms of currents and voltages generated with the Short Term FFT. It can be seen that the events detected in CWT scalograms can not be detected here. This example shows the advantages of the CWT over the FFT when analyzing transient abnormalities.
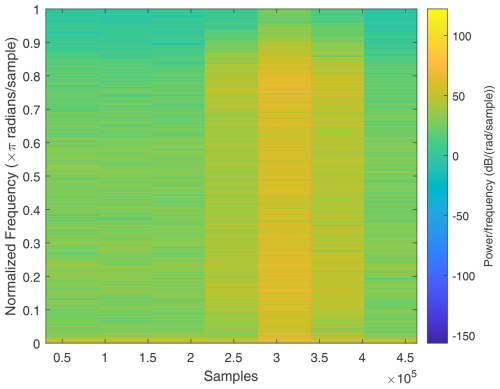
Figure 25Voltage short term FFT of one phase generated with standard matlab syntax “stft(u)” for comparison to CWT scalogram. No statement about abnormalities is possible.
In order to ensure the reliability of electrical power supply grids, devices must not interfere with each other. For this reason, the relevant standards (e.g. DIN EN 50160, 2020; IEEE519-2022, 2022; IEC 61000-4-7, 2009) and the technical connection conditions of the grid operators define both limit values for the emission of disturbance variables and tolerance limits. If these limits are violated, the party responsible is obliged to remedy the defect.
In case of short-term disturbances (≪200 ms) in 50 or 60 Hz energy systems, the Fourier analysis of voltage or current time series potentially only provides limited interpretable findings. On the one hand, the method assumes that the analyzed time series is repeated infinitely often in both directions (future and past). On the other hand, these short-term disturbances disappear from findings due to the averaging over comparatively long-time intervals (usually 200 ms). The use of wavelets promises a remedy for this (Nicolae and Nicolae, 2011).
But even if the determination of key figures such as harmonic current and voltage levels is successful, the problem of eliminating them and determining the causes remains a challenge. According to Diedrichs et al. (2002) the propagation of non-fundamental frequency voltage interferences is decisively influenced by the resonance properties of the grid. Similar results can also be found in Nicolae and Nicolae (2006).
If, for example, an impermissible harmonic voltage level is detected at grid connection node B of a wind turbine (see Fig. 27), it stands to reason that this wind turbine is feeding harmonic current into grid connection node B. Therefore, the wind park seems to be responsible for the harmonic voltage detected. However, it is also possible for harmonic voltages to occur at the grid node B because this node is part of a local resonance structure that is excited to oscillate by feeding power into another grid node A. In other words, there is a source at a grid node A which supplies the harmonic active power absorbed locally in the resonance structure of the grid.

Figure 27Topology diagram of a minimal grid with two local resonances. The color profile represents the propagation of the harmonic from grid node A to grid node B.
For analytical purposes, the transmission path from A to B can be considered as a passive filter and its transfer function describes the transmission path. This means, the harmonic voltage levels can either be increasing or decreasing from A (filter input) to B (filter output) depending on the transfer function. However, when considering the power flow, the sign of the active power into the B node, described by the load reference-arrow system, must always be positive, see Fig. 28. In addition, the active power between A and B must decrease monotonically in magnitude, due to the law of conservation of energy.
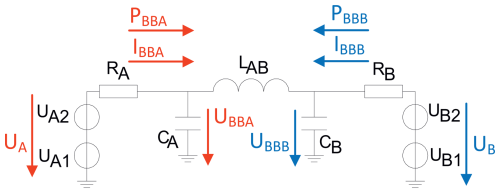
Figure 28Equivalent circuit diagram of the simulated grid. The reference arrows result in the generator reference-arrow system for voltage sources with the internal resistance, and the load reference-arrow system for the active power transit from the voltage source to the adjacent busbar.
The following demonstrates the sign-correct determination of the active power transition for a numerically simulated grid model using the CWT and the complex Gaussian wavelet. In the grid model, two identical grid areas are connected via a line. As shown in Fig. 28, the line is represented by a π-equivalent circuit CA, LAB, CB. The two grid areas are each formed by the series connection of a fundamental and a harmonic voltage source with a resistive short-circuit impedance. The grid simulation is done using LTSpice® according to the model in Fig. 28.
As shown in Fig. 29, the harmonic source UA2 is active in the interval . However, significant harmonic voltage levels occur during this time interval at the remote busbar B where the voltage UBBB can be detected, see Fig. 30.
The ratios are reversed for the interval . Here, the harmonic source UB2 is active. The increased harmonic voltage level occurs on the other side of the line at busbar A (see UBBA in Fig. 30), despite the injection of UB2, see Fig. 29.
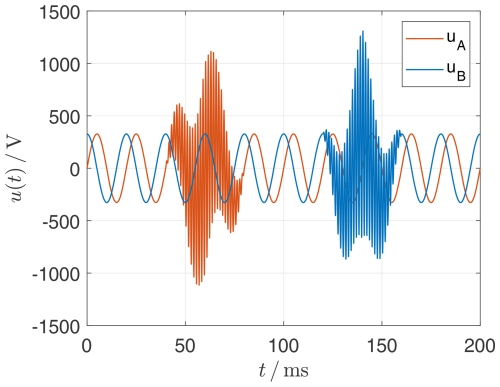
Figure 29Voltage-time curves of the source voltages. In the interval [40...60] ms the harmonic source of UA is active, in the interval [140...160] ms the harmonic source of UB.
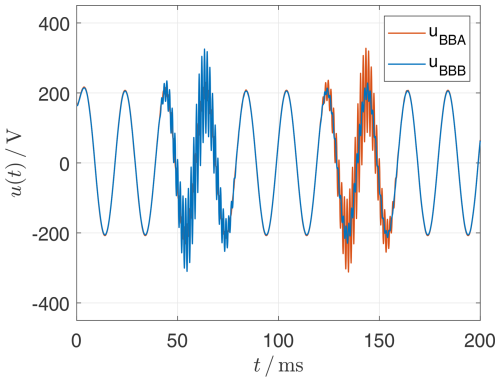
Figure 30In the interval [40...60] ms at the time when the harmonic source at UA is active, the harmonic at UBBB occurs, i.e. at busbar B at the remote end of the line and so it does in the interval [140...160] ms accordingly.
This means that the direction of cause and effect of the harmonic can be determined from the active power transit. For linear time-invariant systems, the frequency-specific active power transit and thus its sign results from the multiplication of the complex coefficients of voltage and conjugate complex current:
The CWT, using differently stretched complex Gaussian wavelets, transforms the real voltage and current time series u(t) calculated by transient simulation into the complex time series UBBA(t,ΔT) and IBBA(t,ΔT). According to Eq. (11) for the complex apparent power, the real part for the active power is determined and visualized in the scalogram in Fig. 31. The counterpart for the busbar B is shown in Fig. 32.
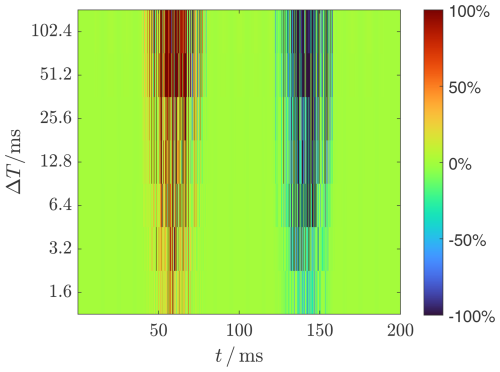
Figure 31Scalogram for the active power transit through the resistor RA into busbar A. The active power is positive in the interval [40...60] ms, thus correctly indicating that the harmonic source UA2 feeds into busbar A. In the interval [140...160] ms, the active power is negative (blue). This means that the harmonic at busbar UBBA is dampened by the current in RA.
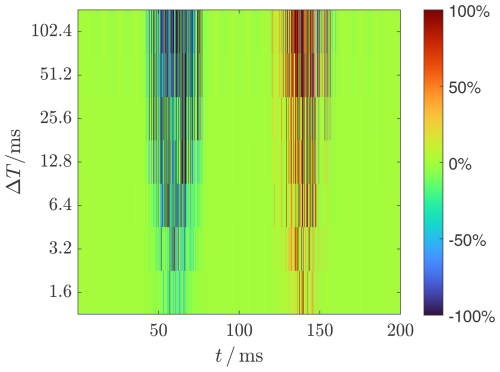
Figure 32Scalogram for the power transit PBBB from source B to busbar B. The active power is negative (blue) in the interval [40...60] ms. This means that the harmonic at busbar UBBB is damped by the current in RB. In the interval [140...160] ms, the active power is positive (red), thus correctly indicating that the harmonic source UB2 feeds into busbar B.
This work shows that continuous wavelet transformation (CWT) is very useful for analyzing short-term/transient abnormalities in energy grids. Using so-called Daubechies wavelets (db wavelet), spikes, vector jumps, short-circuits, earth connections and frequency deviations in 3-Phase systems could be detected and analyzed. The reason for this is the vanishing moment property of a CWT with a db wavelet which is also explained and discussed. Visualizing the CWT using scalograms also allows for a simple analysis of the CWT results. Furthermore, it is demonstrated that the family of so-called complex Gaussian wavelets can be used to analyze the transfer of active power in the power system, even during transient events. This can be used to analyze resonant power grid structures and to identify the causes of violations of current and voltage limits at the grid connection point.
The data are available from the corresponding author upon request.
All authors contributed to the design and implementation of the research, the analysis of the results and the writing of the manuscript.
The contact author has declared that none of the authors has any competing interests.
Publisher’s note: Copernicus Publications remains neutral with regard to jurisdictional claims made in the text, published maps, institutional affiliations, or any other geographical representation in this paper. While Copernicus Publications makes every effort to include appropriate place names, the final responsibility lies with the authors.
This article is part of the special issue “Kleinheubacher Berichte 2024”. It is a result of the Kleinheubacher Tagung 2024, Miltenberg, Germany, 24–26 September 2024.
The authors extend special thanks to: Achim Abels, Development Engineer at WRD GmbH, for his support during the measurement campaigns; Rainer Klosse, Managing Director of “delta energy solutions for technical applications GmbH” for his support during the measurement campaigns and for providing the container images; Luka Dorotic, Student at JADE University of Applied Sciences, for his tireless support in LaTeXchallenges.
This paper was edited by Thomas Kleine-Ostmann and reviewed by Ileana-Diana Nicolae and one anonymous referee.
Diedrichs, V., Kasdorf, F., and Lorenzen, H.: Propagation of voltage influences, in: Propagation of power quality impacts in distribution grids, Final Report, funding code 0329855A, https://enargus.de/pub/bscw.cgi/?op=enargus.eps2&q=Jade%20Hochschule%20Wilhelmshaven/Oldenburg/Elsfleth%20-%20Standort%20Wilhelmshaven%20-%20Fachbereich%20Elektronik%20-%20Labor%20f%c3%bcr%20Elektrische%20Energieversorgung/Labor%20f%c3%bcr%20Leistungselektronik%20und%20EMV&m=1&v=10&id=855319 (last access: 11 August 2025), 2002. a
DIN EN 50160: Voltage characteristics of electricity supplied by public electricity networks, Beuth Verlag GmbH, https://doi.org/10.31030/3187943, 2020. a, b
Fugal, D. L.: Conceptual wavelets in digital signal processing, Space and Signals Technologies LLC, ISBN 978-0-9821994-5-9, 2009. a, b, c, d, e, f, g
IEC 60909-0: Short-circuit currents in three-phase a.c. systems – Part 0: Calculation of currents, IEC, ISBN 9782832231586, 2016. a
IEC 61000-4-30: Electromagnetic compatibility (EMC) – Part 4-30: Testing and measurement techniques – Power quality measurement methods, IEC, ISBN 9782832295380, 2021. a
IEC 61000-4-7: Electromagnetic compatibility (EMC) – Part 4-7: Testing and measurement techniques – General guide on harmonics and interharmonics measurements and instrumentation, for power supply systems and equipment connected thereto, IEC, ISBN 9782889103775, 2009. a
IEEE519-2022: IEEE standard for harmonic control in electric power systems, IEEE, https://doi.org/10.1109/IEEESTD.2022.9848440, 2022. a
Lorenzen, H., Koj, S., Timmerberg, J., and Mylvaganam, S.: Labscale emulation of abnormalities in three-phase power systems and their preemptive detection using wavelets, in: 2023 Power Quality and Electromagnetic Compatibility at Low Frequency (PQEMC-LF), 1, 37–40, https://doi.org/10.1109/PQEMC-LF58184.2023.10211747, 2023. a
Nicolae, I., Nicolae, P., and Nicolae, M.: Hybrid wavelet-based algorithms for fast harmonic identification, Annals of the University of Craiova, Series Automation, Computers, Electronics and Mechatronics, 9, 13–19, 2012. a
Nicolae, I.-D. and Nicolae, P.-M.: Using discrete wavelet transform to evaluate power quality at highly distorted three-phase systems, in: 11th International conference on electrical power quality and utilisation, Lisbon, Portugal, 17–19 October 2011, 1–6, https://doi.org/10.1109/EPQU.2011.6128825, 2011. a
Nicolae, P. M. and Nicolae, I. D.: Distorting and unbalanced impact over the operation of an electro-energetic group from an electric power plant, in: 2006 IEEE International Symposium on Industrial Electronics, 3, 1852–1857, https://doi.org/10.1109/ISIE.2006.295854, 2006. a
Qian, S. and Chen, D.: Discrete gabor transform, IEEE transactions on signal processing, in: IEEE Transactions on Signal Processing, vol. 41, 2429–2438, 1993. a
Strang, G.: Wavelets and filter banks, Wellesley-Cambridge Press, ISBN 978-0-9614088-1-7, 1996. a
Strang, G.: Computational science and engineering, Wellesley-Cambridge Press, Philadelphia, PA, ISBN 978-0-9614088-1-7, 2007. a
TheMathWorksInc.: Wavelet Toolbox Version 5.6 (R2021a), https://www.mathworks.com (last access: 31 March 2025), 2020. a
- Abstract
- Introduction and motivation
- Wavelets and wavelet transformation
- Identification of abnormalities in three-phase signals
- Cause of harmonic and non-harmonic oscillations
- Conclusions
- Data availability
- Author contributions
- Competing interests
- Disclaimer
- Special issue statement
- Acknowledgements
- Review statement
- References


