 | 19 May 2026
A quarter of a century of polar mesospheric summer echo observations over Andøya: climatology and trends
Franz-Josef Lübken
Polar mesosphere summer echoes (PMSE) are strong radar signals received at very high radar frequencies at altitudes between about 80 and 95 km at polar latitudes during summer. PMSE are caused by inhomogeneities in electron density on the radar Bragg scale of 3 m (for a monostatic 53.5 MHz radar), which originate from density fluctuations in negatively charged ice particles. Continuous monitoring of PMSE takes place on the northern Norwegian island of Andøya (69.3° N, 16.0° E) with the ALWIN (1999–2008) and MAARSY radars (since 2011), respectively. Both radars are calibrated which allows the conversion of the received PMSE echo strength to absolute signal power and the determination of the volume radar reflectivity η, which is now available for more than a quarter of a century. The distribution of the mean volume reflectivity covers a range starting at the detection limit of the radars and extending to a maximum value of m−1 with peak values at around and m−1 for ALWIN and MAARSY, respectively. Seasonal, diurnal, and height variations of PMSE occurrence rates based on the 26-year data set of η are presented. Since PMSE reflectivity is affected by ionization from solar radiation and high-energy particle precipitation, seasonal mean values of PMSE reflectivity have been analyzed with respect to solar and geomagnetic activity. Regarding long term trends, PMSE measurements from the ALOMAR SOUSY radar covering the period 1994–1997 are included which leads to a time series of 32 years, making it the longest measurement series of its kind worldwide.
- Article
(3293 KB) - Full-text XML
- BibTeX
- EndNote


VHF radar echoes originating from the mesosphere and lower thermosphere have been detected over the Norwegian island of Andøya for more than thirty years. The intense echoes observed from the mesopause region, primarily occurring during the summer months, are known as Polar Mesosphere Summer Echoes (PMSE) for over four decades. These echoes result from electron density irregularities on the scale of the radar's Bragg wavelength, produced by neutral air turbulence in conjunction with negatively charged ice particles forming only in the extremely cold mesopause region during summer. The presence of ice particles in the mesopause region, as well as the related visual manifestation of noctilucent clouds (NLC), has been confirmed through numerous ground-based, rocket-borne, and satellite observations. The close relationship between PMSE and NLC was established early on through simultaneous, co-located lidar and radar measurements (e.g. von Zahn and Bremer, 1999). A detailed review of early PMSE observations and their connection to NLC is provided by Cho and Röttger (1997) while a comprehensive summary of the current understanding of this phenomenon can be found in Rapp and Lübken (2004).
Since PMSE arise from electron density irregularities their occurrence depends on ionization produced by solar radiation and/or incoming high-energy particle fluxes. In addition, PMSE occurrence provides insight into upper mesosphere background conditions, such as water vapor or electron densities. Therefore, long-term measurements of PMSE can be used to infer possible variations or trends in mesopause conditions. Continuous, long-term PMSE observation series and corresponding studies of their variability (e.g. Smirnova et al., 2010, 2011; Bremer et al., 2009; Latteck and Bremer, 2017) exist only for Northern Scandinavia, specifically from the ESRAD radar (Chilson et al., 1999) near Kiruna, Sweden, and the ALWIN/MAARSY radars (Latteck et al., 1999, 2012) on Andøya, Norway. Studies based on shorter data sets have also been conducted, for example by Swarnalingam et al. (2009) using PMSE observations from the Resolute Bay VHF radar in Canada (Hocking et al., 2001).
This study offers a comprehensive overview of PMSE radar reflectivities based on uninterrupted measurements carried out at the Norwegian island of Andøya (69.3° N, 16.0° E) between 1999 and 2025, covering a quarter of a century and encompassing two and a half solar cycles. Regarding trends, this study is limited to the summer months of June and July, but includes observations from the ALOMAR SOUSY radar from 1994 to 1997, so that a total period of 32 years is available.
Observations of mesospheric radar echoes at Andøya began in the early 1980s with the mobile SOUSY radar (Czechowsky et al., 1984) and continued from 1994 using the ALOMAR SOUSY radar (Singer et al., 1995). In 1998, ALOMAR SOUSY was replaced by the ALWIN radar (Latteck et al., 1999), which operated continuously from 1999 to 2008. During the construction of MAARSY in 2009, ALWIN continued PMSE observations with a reduced antenna array (Latteck et al., 2010). Mesospheric monitoring resumed in summer 2010 with the Middle Atmosphere ALOMAR Radar System (MAARSY), which became fully operational in May 2011 (Latteck et al., 2012).
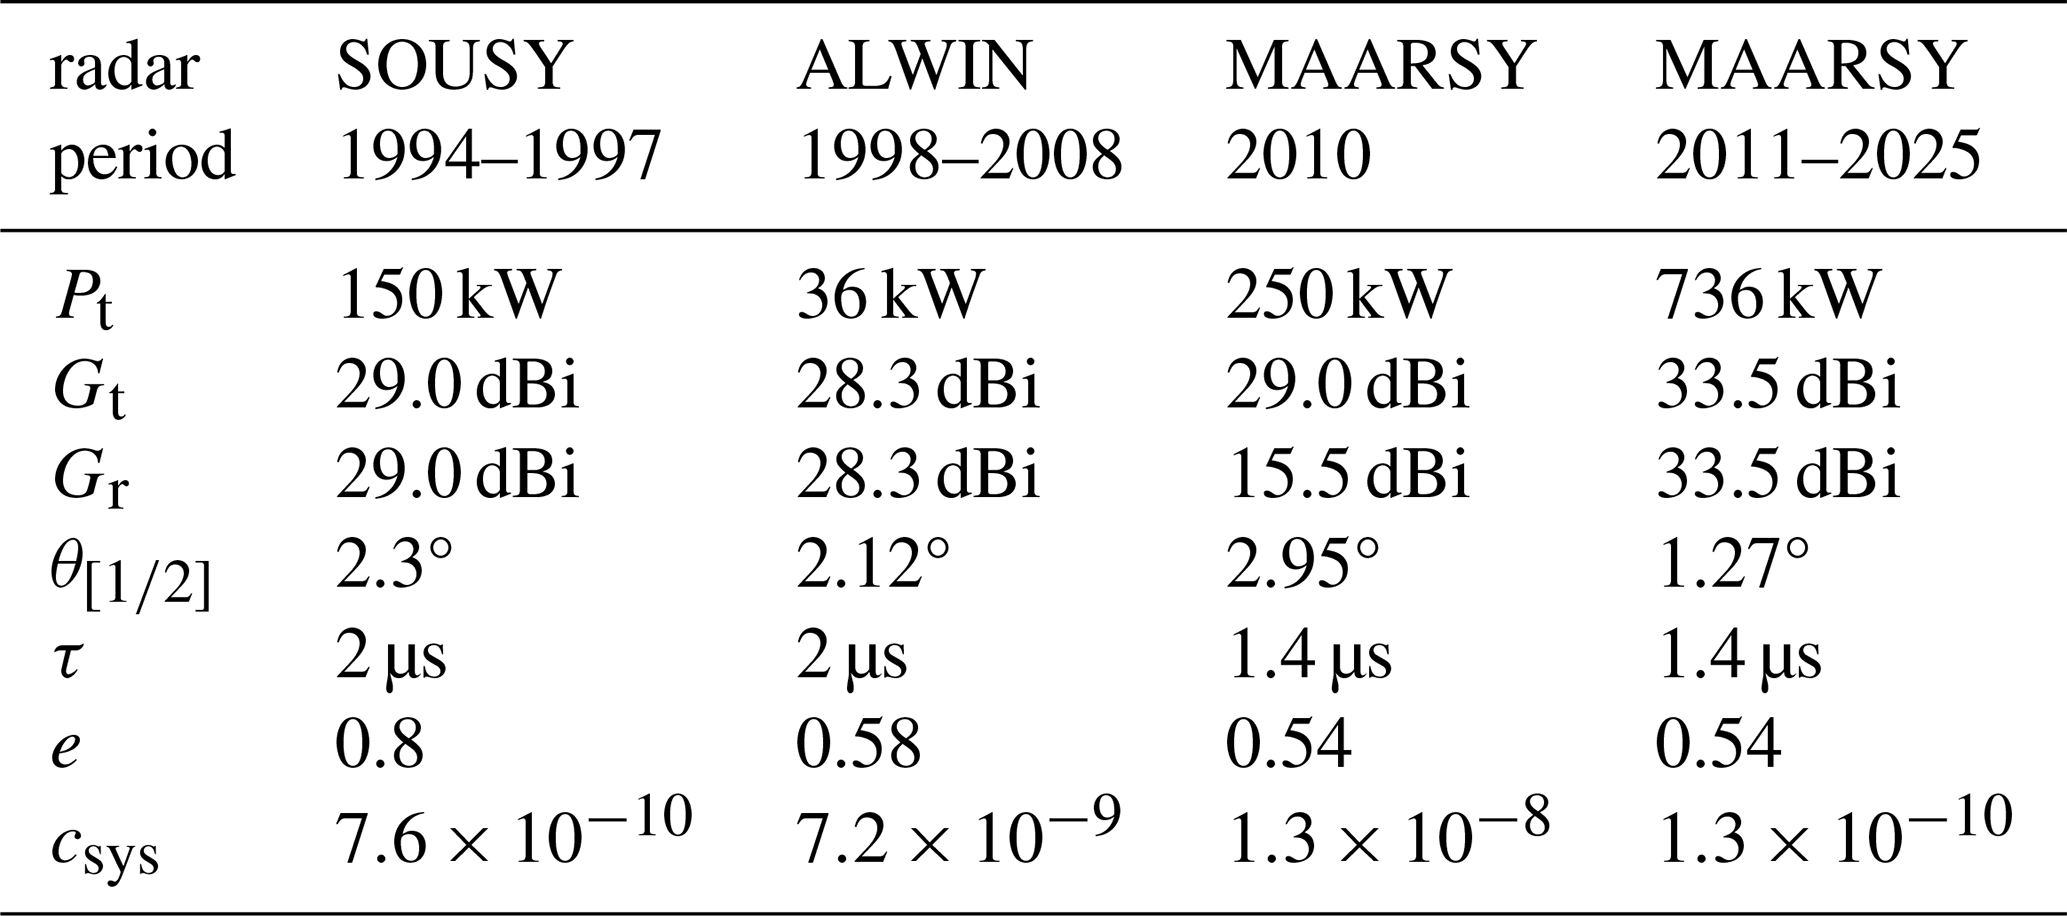
All VHF radars at Andøya operate at 53.5 MHz, while other technical parameters such as transmitter power, antenna aperture, and receiver characteristics differ between systems. Detailed descriptions of the radar configurations and standard mesospheric observation parameters are given in Latteck and Bremer (2017); the most relevant parameters for this study are summarized in Table 1. Some parameters varied during dedicated campaign modes.
Table 1Basic radar parameters (Singer et al., 1995; Latteck et al., 1999, 2010, 2012) and experiment configurations relevant for the determination of volume reflectivity from PMSE observations as used in this study. The symbols are described in Sect. 3.1.
3.1 Signal strength of PMSE
In order to evaluate the radar echoes detected by two different systems in terms of strength, underlying backscatter mechanism and frequency, the received signals were converted to radar volume reflectivity η. Radar volume reflectivity is defined as the power which would be scattered if all power were scattered isotropically with a power density equal to that of the back-scattered radiation, per unit volume and per unit incident power density (Hocking, 1985). In other words, it describes how much power a small volume scatters evenly in all directions relative to the incoming radar power. This leads to the following expression:
where r is the range to the scatterers; Gt and Gr denote the one-way gains of the transmitting and receiving antennas, respectively; represents the effective half-power half-width of the combined transmit–receive antenna beam; λ is the radar wavelength; e is the system efficiency, primarily accounting for losses within the antenna feed system; Pt and Pr are the transmitted peak power and the received signal power, respectively; c is the speed of light; and τ is the effective pulse width (Hocking and Röttger, 1997). The factor 2ln (2) serves as a correction term that compensates for the non-uniform antenna gain across the half-power beamwidth (Probert-Jones, 1962; Skolnik, 1990).
The conversion of the received signal to an absolute quantity, namely radar reflectivity, requires precise calibration of the radar system, which serves as the fundamental basis for the quantitative interpretation of radar experiments conducted with ALWIN and MAARSY. Detailed descriptions of two calibration techniques routinely employed for these systems are provided in Latteck et al. (2008). All system-dependent parameters in Eq. (1) can be concentrated into a single system constant, csys. In this paper only vertical sounding is considered. Consequently, the radar reflectivity η becomes a function solely of the height of the scatterers, z, and the absolute value of the received signal power, Pz.
The PMSE datasets used in this study consist of radar volume reflectivity measurements averaged over 5 min and 300 m, both for ALWIN and MAARSY. To ensure data reliability and remove outliers, PMSE occurrences were identified and flagged within the datasets. A PMSE event was defined as an increase in radar reflectivity above the detection threshold that persisted for at least 20 min, corresponding to four consecutive averages within a single range gate.
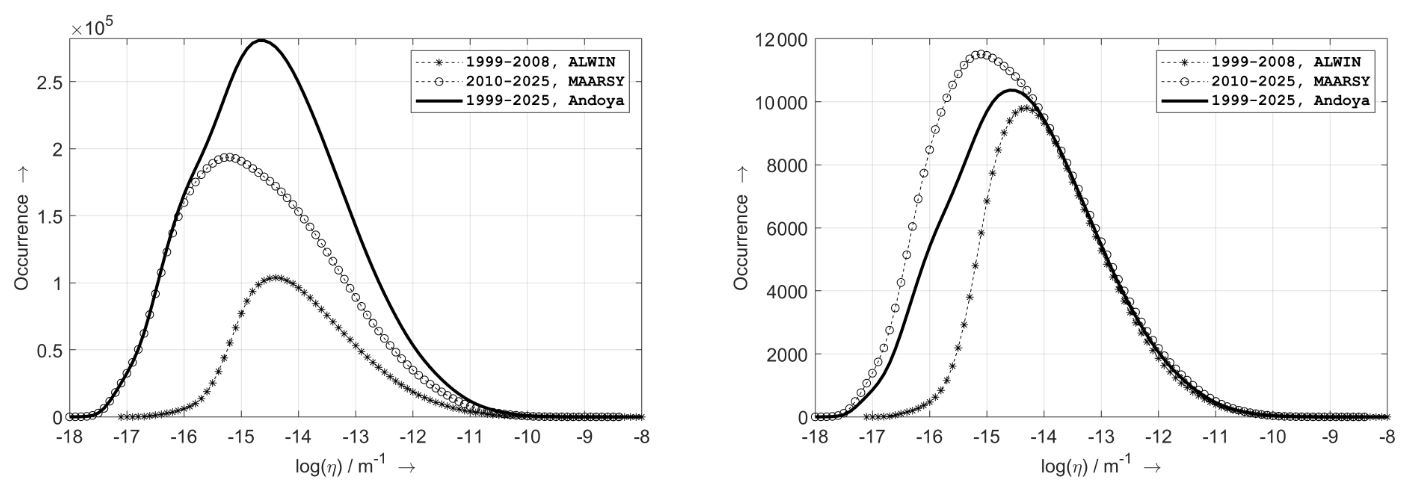
Figure 1Left: Histogram of all available detections of volume reflectivities during PMSE observed at Andøya (1999–2025, solid black line), and the contributions from ALWIN (1999–2008, stars) and MAARSY (2010–2025, circles). Right: Same, but histograms for each year were determined separately and then averaged for all years.
Figure 1 shows a histogram of the total number of PMSE events as a function of volume reflectivity for the entire data set (1999–2025), as well as the contributions from ALWIN (1999–2008) and MAARSY (2010–2025). The histograms for each year were also determined separately and then averaged for all years (right panel in Fig. 1). Differences in minimum signal detectability, which controls the left-hand slope of the distributions in both panels in Fig. 1 are primarily related to antenna array size and peak transmitted power. In addition, variations in radar experiment configurations, particularly changes in receiving antenna setups and the number of coherent integrations used during specific campaigns, also contribute to different detectability (Latteck and Bremer, 2017). Variations in other system parameters were corrected for using the system factor in Eq. (1) and through receiver calibration.
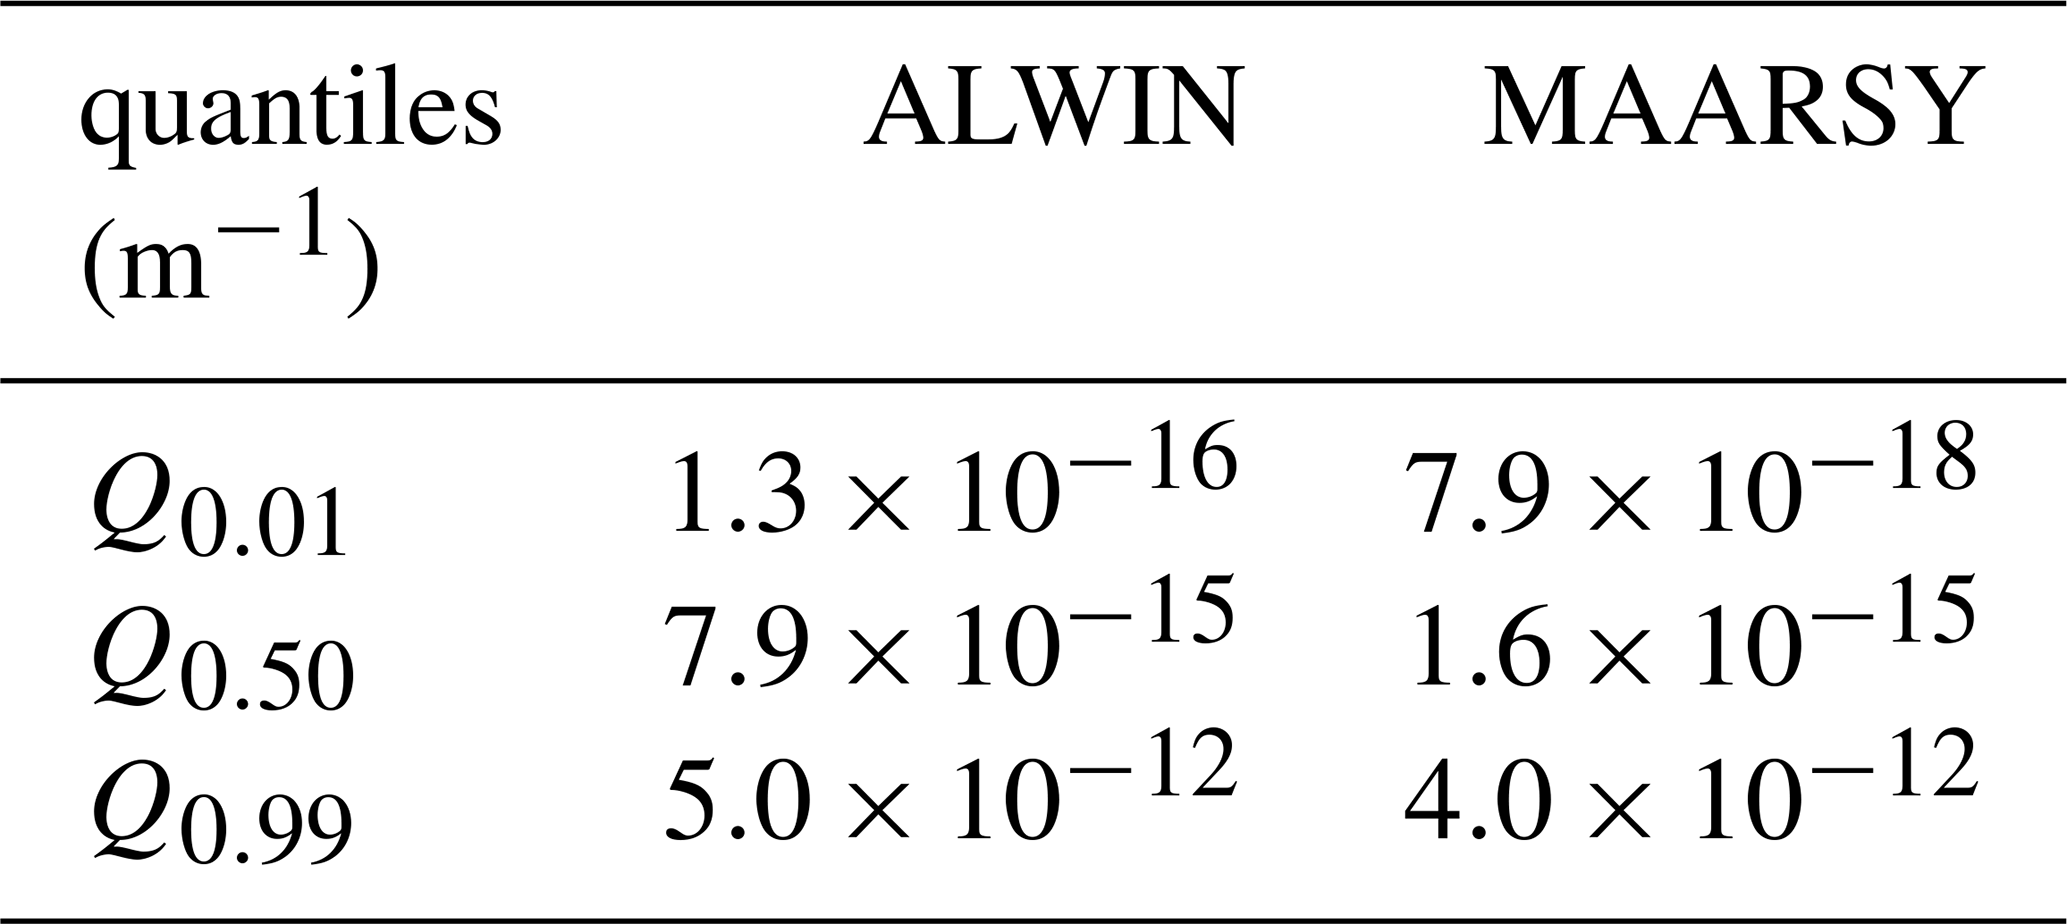
The mean volume reflectivity distribution shown in Fig. 1 spans from the radar detection limits up to maximum values of approximately 10−9 m−1 for both ALWIN and MAARSY. For ALWIN, the distribution peaks at about m−1, whereas the peak for MAARSY occurs at a lower value of m−1. The volume reflectivity quantiles are listed in Table 2. For ALWIN, the weakest 1 % of detected echoes (Q0.01) exhibit reflectivities of m−1. In contrast, the corresponding MAARSY value Q0.01 is substantially lower, with m−1 reflecting the radar's superior sensitivity.
Table 2Quantils of distribution of volume reflectivity of PMSE obtained by ALWIN (1999–2008) and MAARSY (2010–2025).
3.2 Seasonal, diurnal and altitude-dependent fluctuations in PMSE
To obtain an occurrence rate (OR) analysis of PMSE which is as unbiased as possible with respect to seasonal and diurnal variability, and in order to allow for a qualitative comparison with other studies (e.g. Kirkwood et al., 2007; Latteck and Bremer, 2013; Sato et al., 2017; Latteck and Bremer, 2017; Latteck et al., 2021) a lower threshold was applied which is defined as follows (see also Fig. 2):
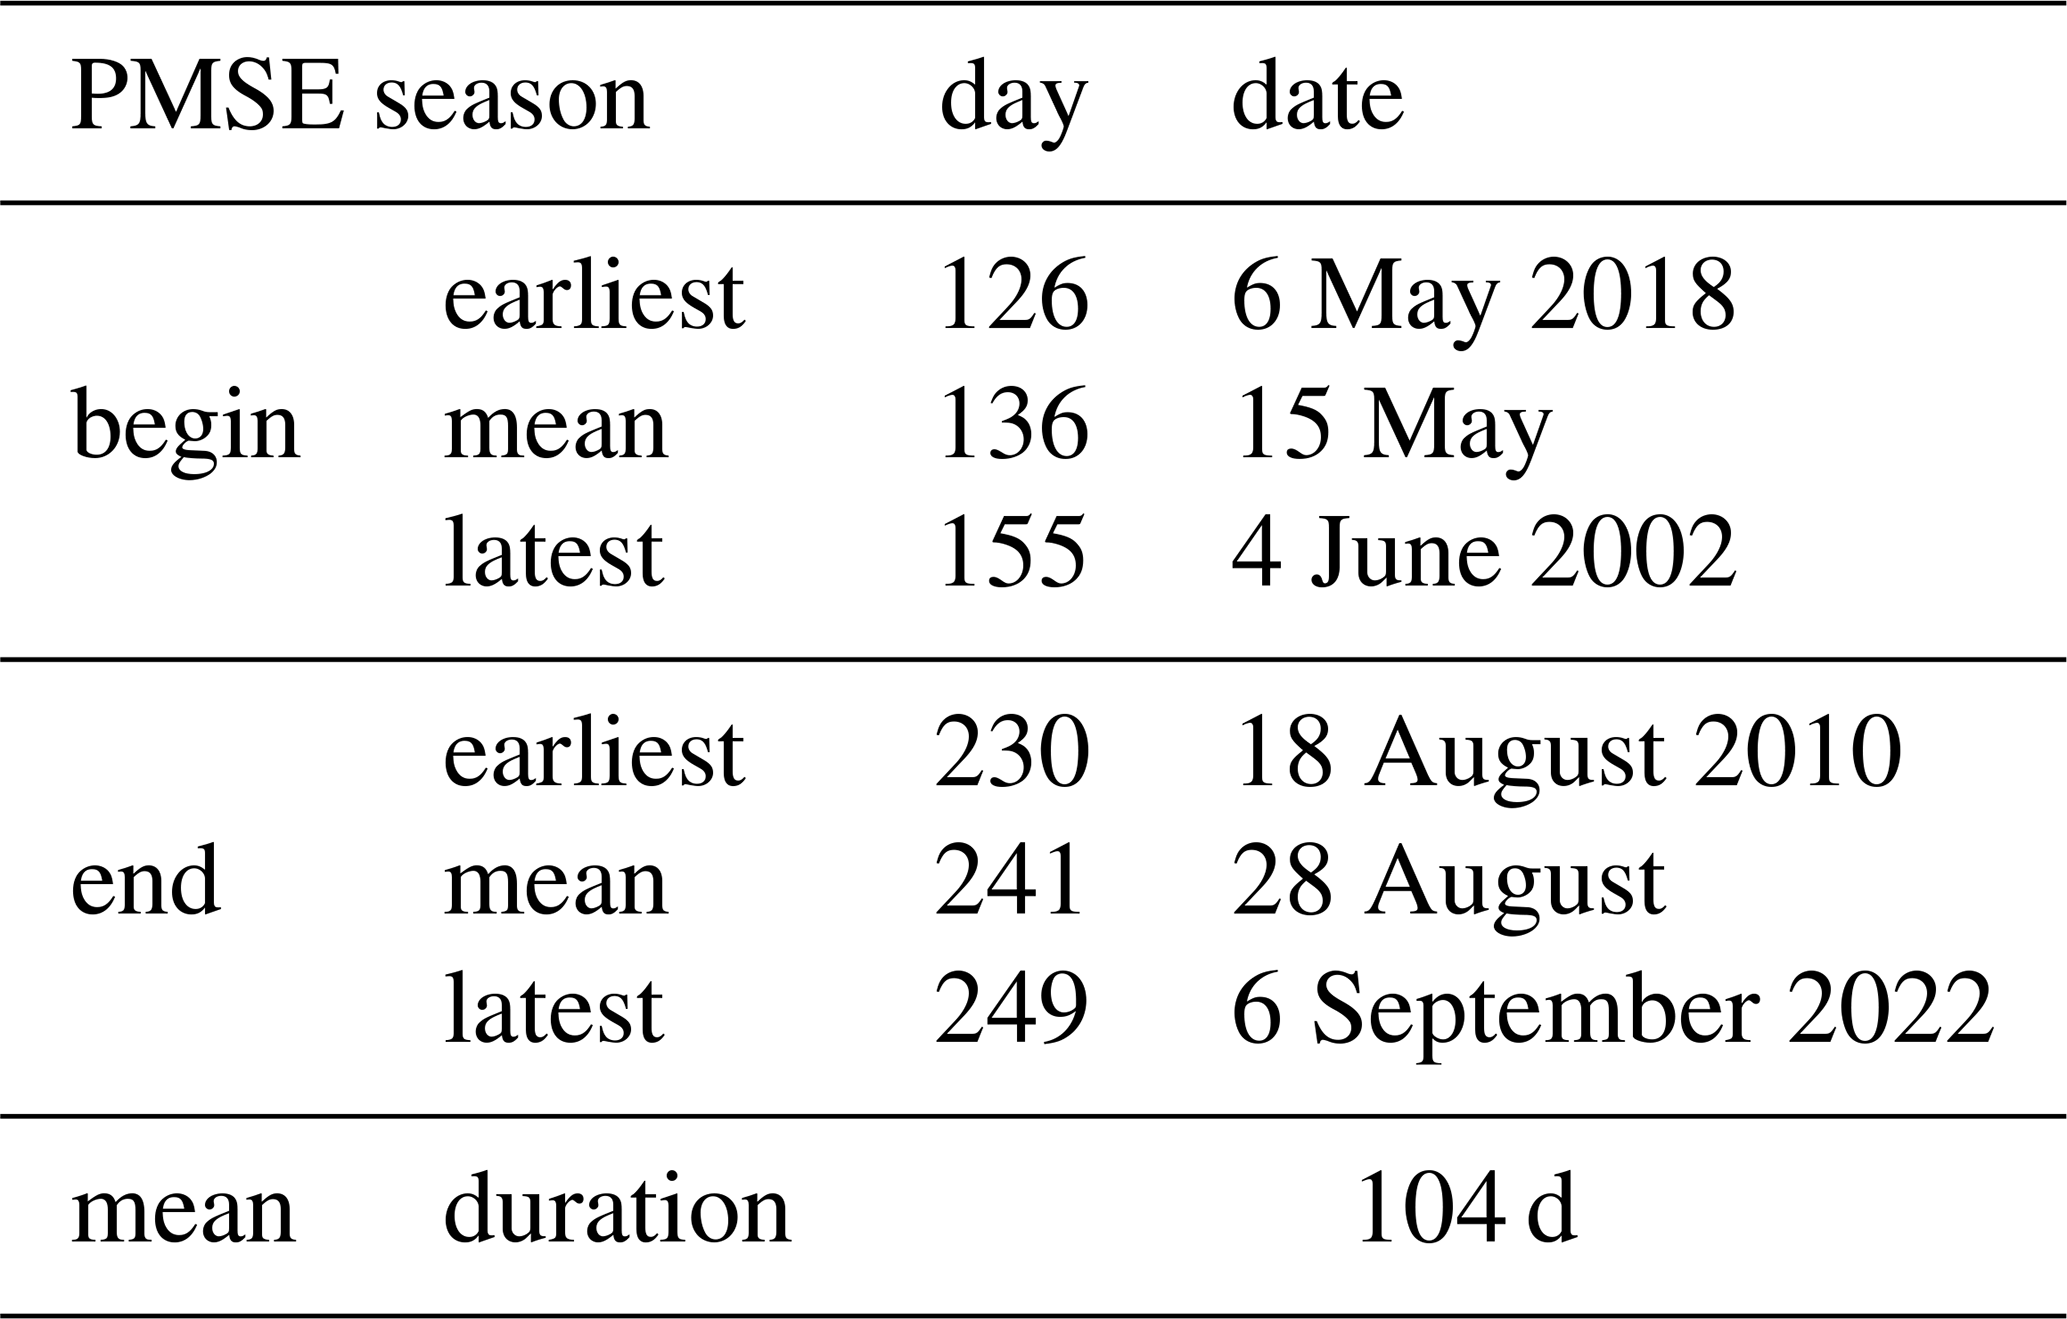
which takes into account the height dependence of η as introduced in Eq. (2) (z = height in km). A detailed analysis of the occurrence rates from ALWIN and MAARSY is shown in Fig. 3 where a common threshold of has been applied. The average seasonal occurrence rate (blue curve in the top panel) is consistent with, and directly comparable to, the results reported in previous studies (e.g. Bremer et al., 2009; Latteck and Bremer, 2013, 2017). PMSE with volume reflectivity were observed, on average, between day 136 (15 May) and day 241 (28 August). The standard deviations associated with the start and end dates are 6.36 and 4.51 d, respectively, yielding an average PMSE season length of approximately 104 d. During the core period from mid-June to mid-July, the average occurrence rate is about 83 %. The earliest onset of the PMSE season at Andøya was recorded on day 126 (2 May 2018), while the latest onset occurred on day 155 (4 June 2002). The earliest seasonal termination was observed on day 230 (18 August 2010), and the latest on day 249 (6 September 2022). These values are summarised in Table 3.
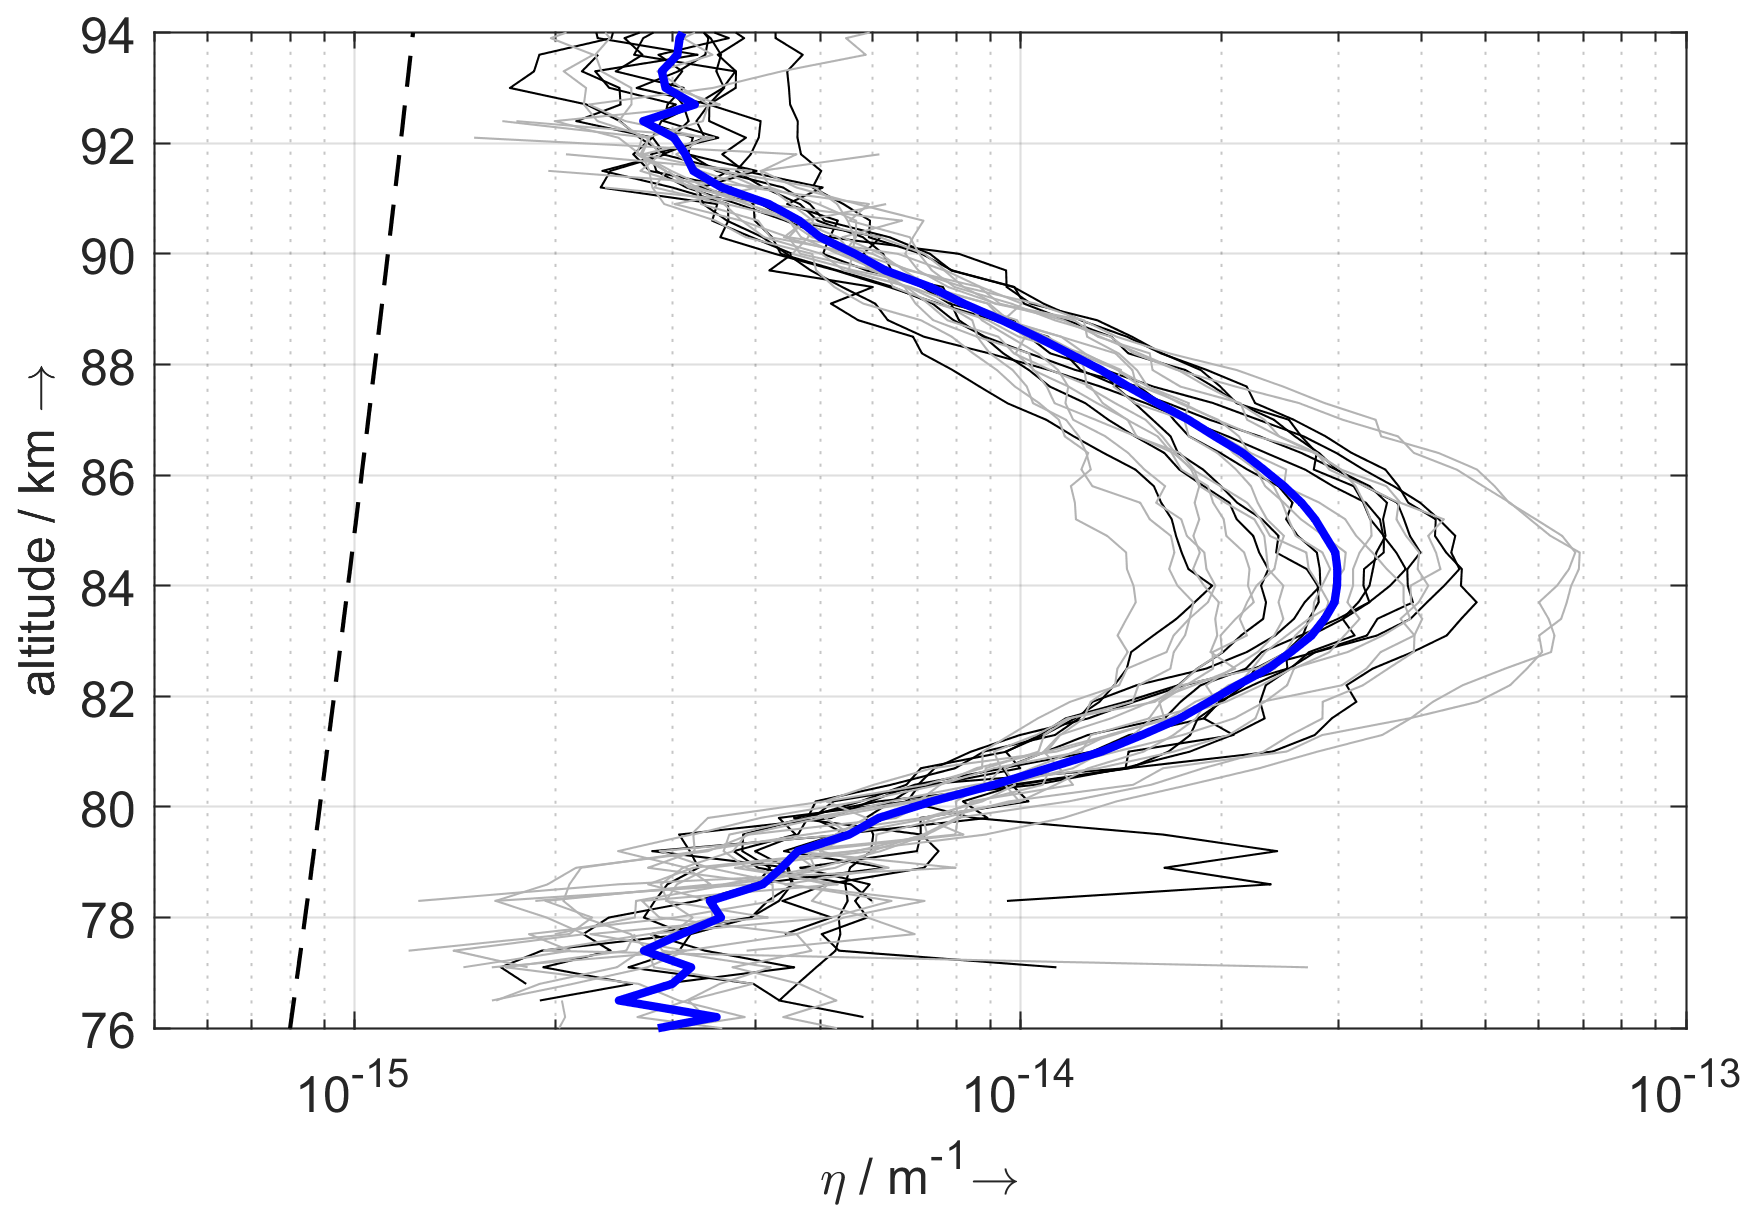
Figure 2Mean profiles of radar volume reflectivity of PMSE at Andøya for June/July 1999–2025. The grey and black curves show the average profiles for the individual summer observation periods for MAARSY and ALWIN, respectively, while the blue curve shows the average profile of all mean profiles for 26 years. The dashed curve indicates the threshold of ηmin as defined in Eq. (3).
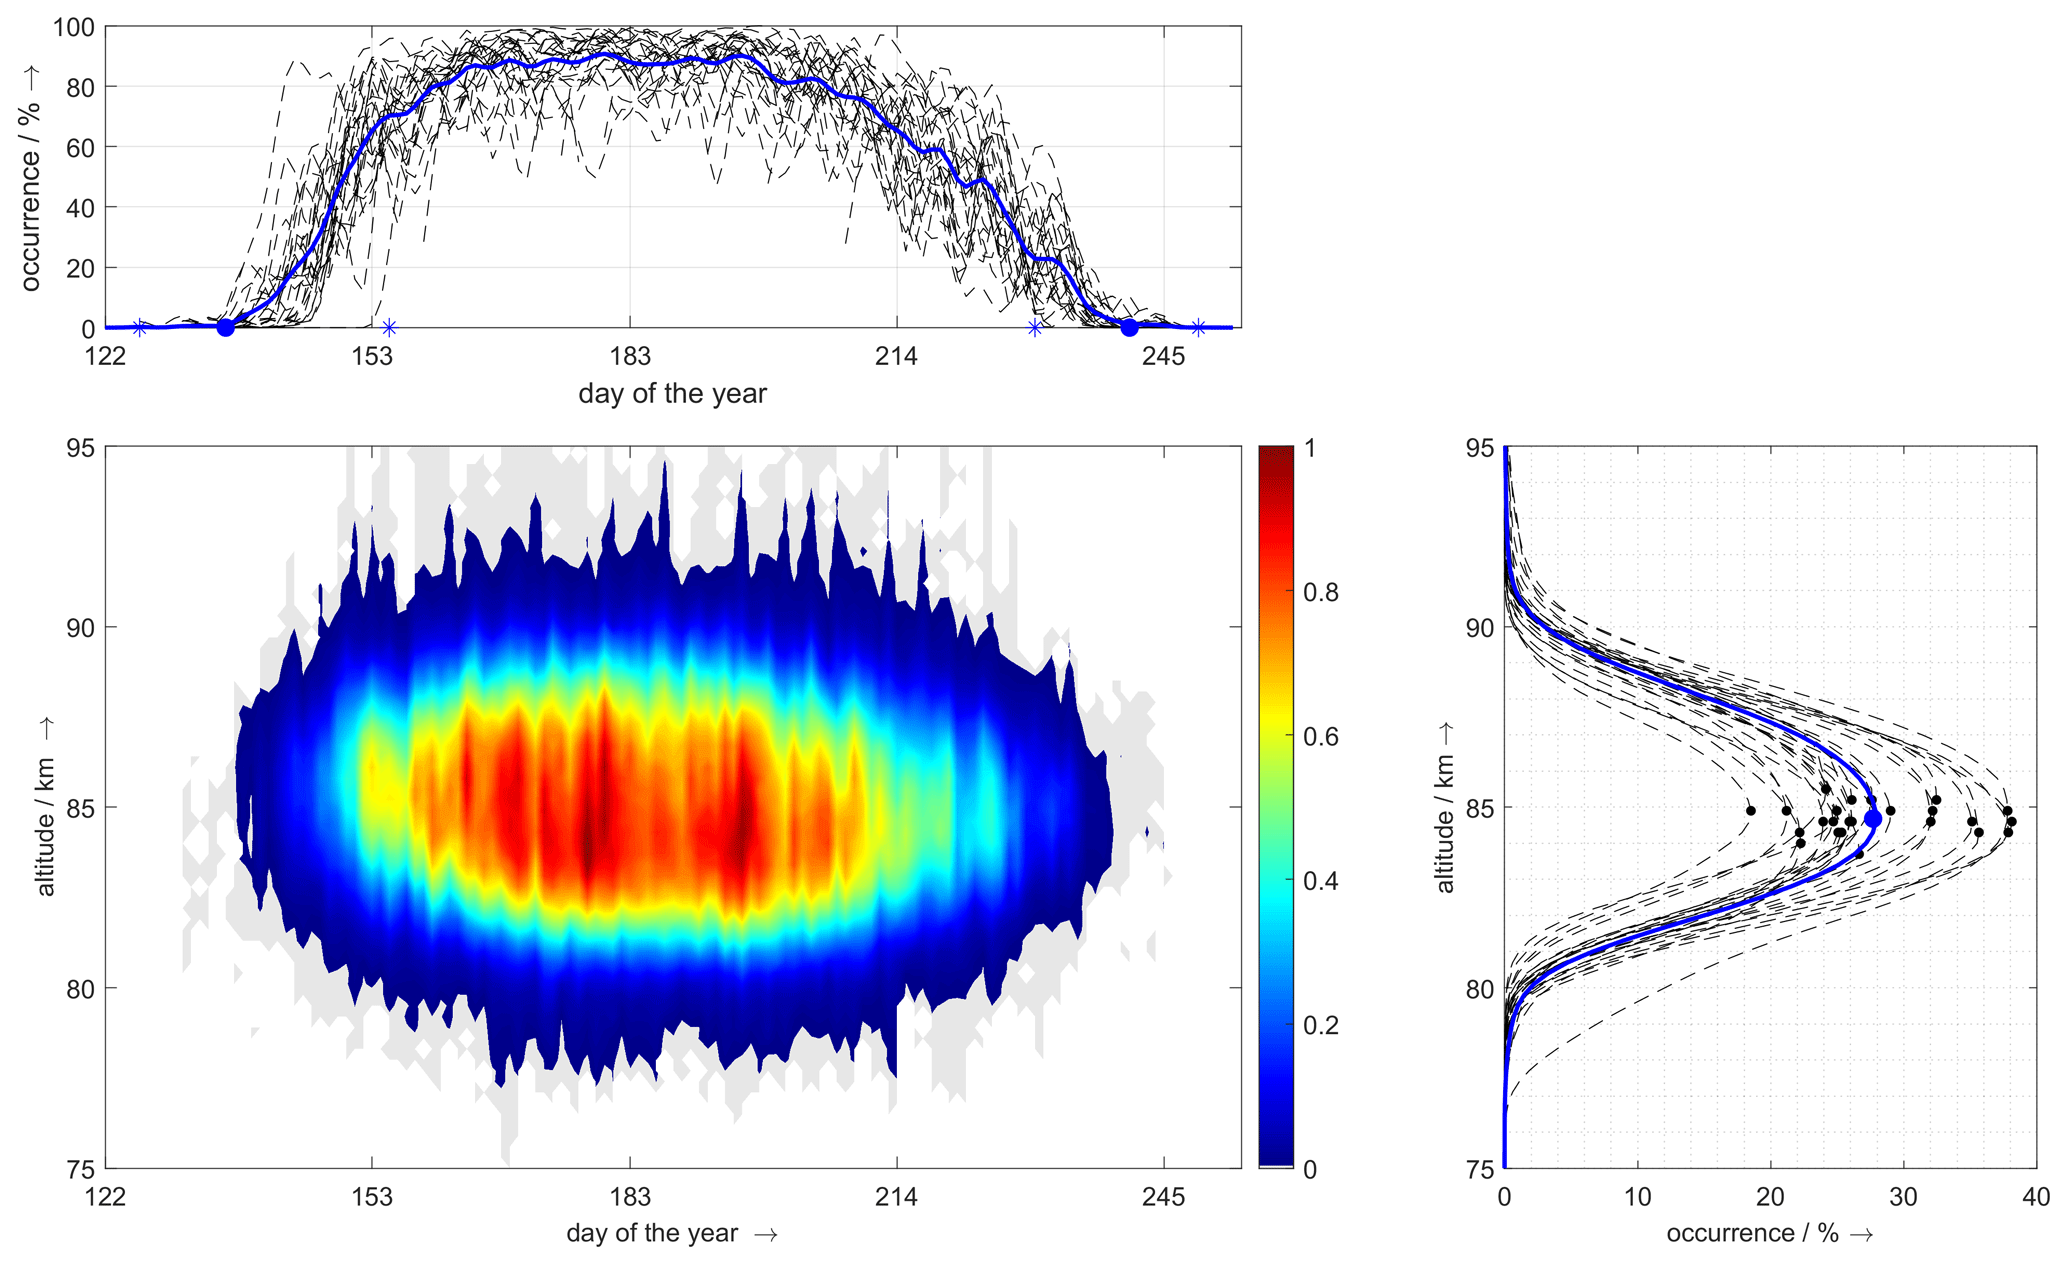
Figure 3Mean full-year-over-altitude occurrence rate (bottom left panel), seasonal variation (top panel) and altitude distribution (bottom right panel) of PMSE derived from radar volume reflectivities obtained with ALWIN (1999–2008) and MAARSY (2010–2025). The blue solid curve in the top panel represent the mean values of the occurrence rates over the entire observation period. The blue stars mark the earliest and latest start and end, the blue dots mark the mean start day and the mean end day of the of the mean PMSE Season. The blue dot in the bottom right panel marks the mean peak height of mean altitude distribution of PMSE, the black dots indicate the corresponding heights of the individual seasons.
Table 3Earliest, mean, and latest onset and end of PMSE season in Andøya (1999–2025) for volume reflectivities .
The altitude distributions of the PMSE occurrence rates of individual years and their average value are also shown in Fig. 3. They are characterized by a nearly symmetric, Gaussian-like shape. The maximum value of the mean altitude distribution occurs at an altitude of 84.7 km with a standard deviation of 412 m.
The mean diurnal, altitude-resolved variation of PMSE occurrence (see Fig. 4) reveals a region of enhanced occurrence between 83 and 87 km. This region emerges shortly before midnight LT and persists until approximately 15:00 LT. During the afternoon hours, the occurrence frequency exhibits a pronounced decline. The daily variation in PMSE occurrence for the individual years as shown in the top panel of Fig. 4 reflects the measurement time; that is a value of 100 % per range gate means that an echo has been recorded in the same range gate during one of the 5 min daily time intervals on all days with available measurements. The mean diurnal PMSE occurrence in the top panel of Fig. 4 exhibits a pronounced pattern, with large variability around a mean value of approximately 20 % between midnight and 17:00 LT. During the morning hours, the mean diurnal cycle shows a weak maximum at 05:09 LT. This feature is not well defined, as indicated by the large spread of the individual annual maxima. All yearly mean curves show a clear maximum between 11:00 and 15:00 LT, with an average peak occurring around 12:59 LT. The curves show a pronounced minimum between 17:00 LT and midnight. The 26-year mean occurrence rate decreases sharply during this interval, reaching about 10 % at 20:39 LT, before increasing again to approximately 20 % by around 01:30 LT. Potential reasons for this variation will be discussed in a later section.
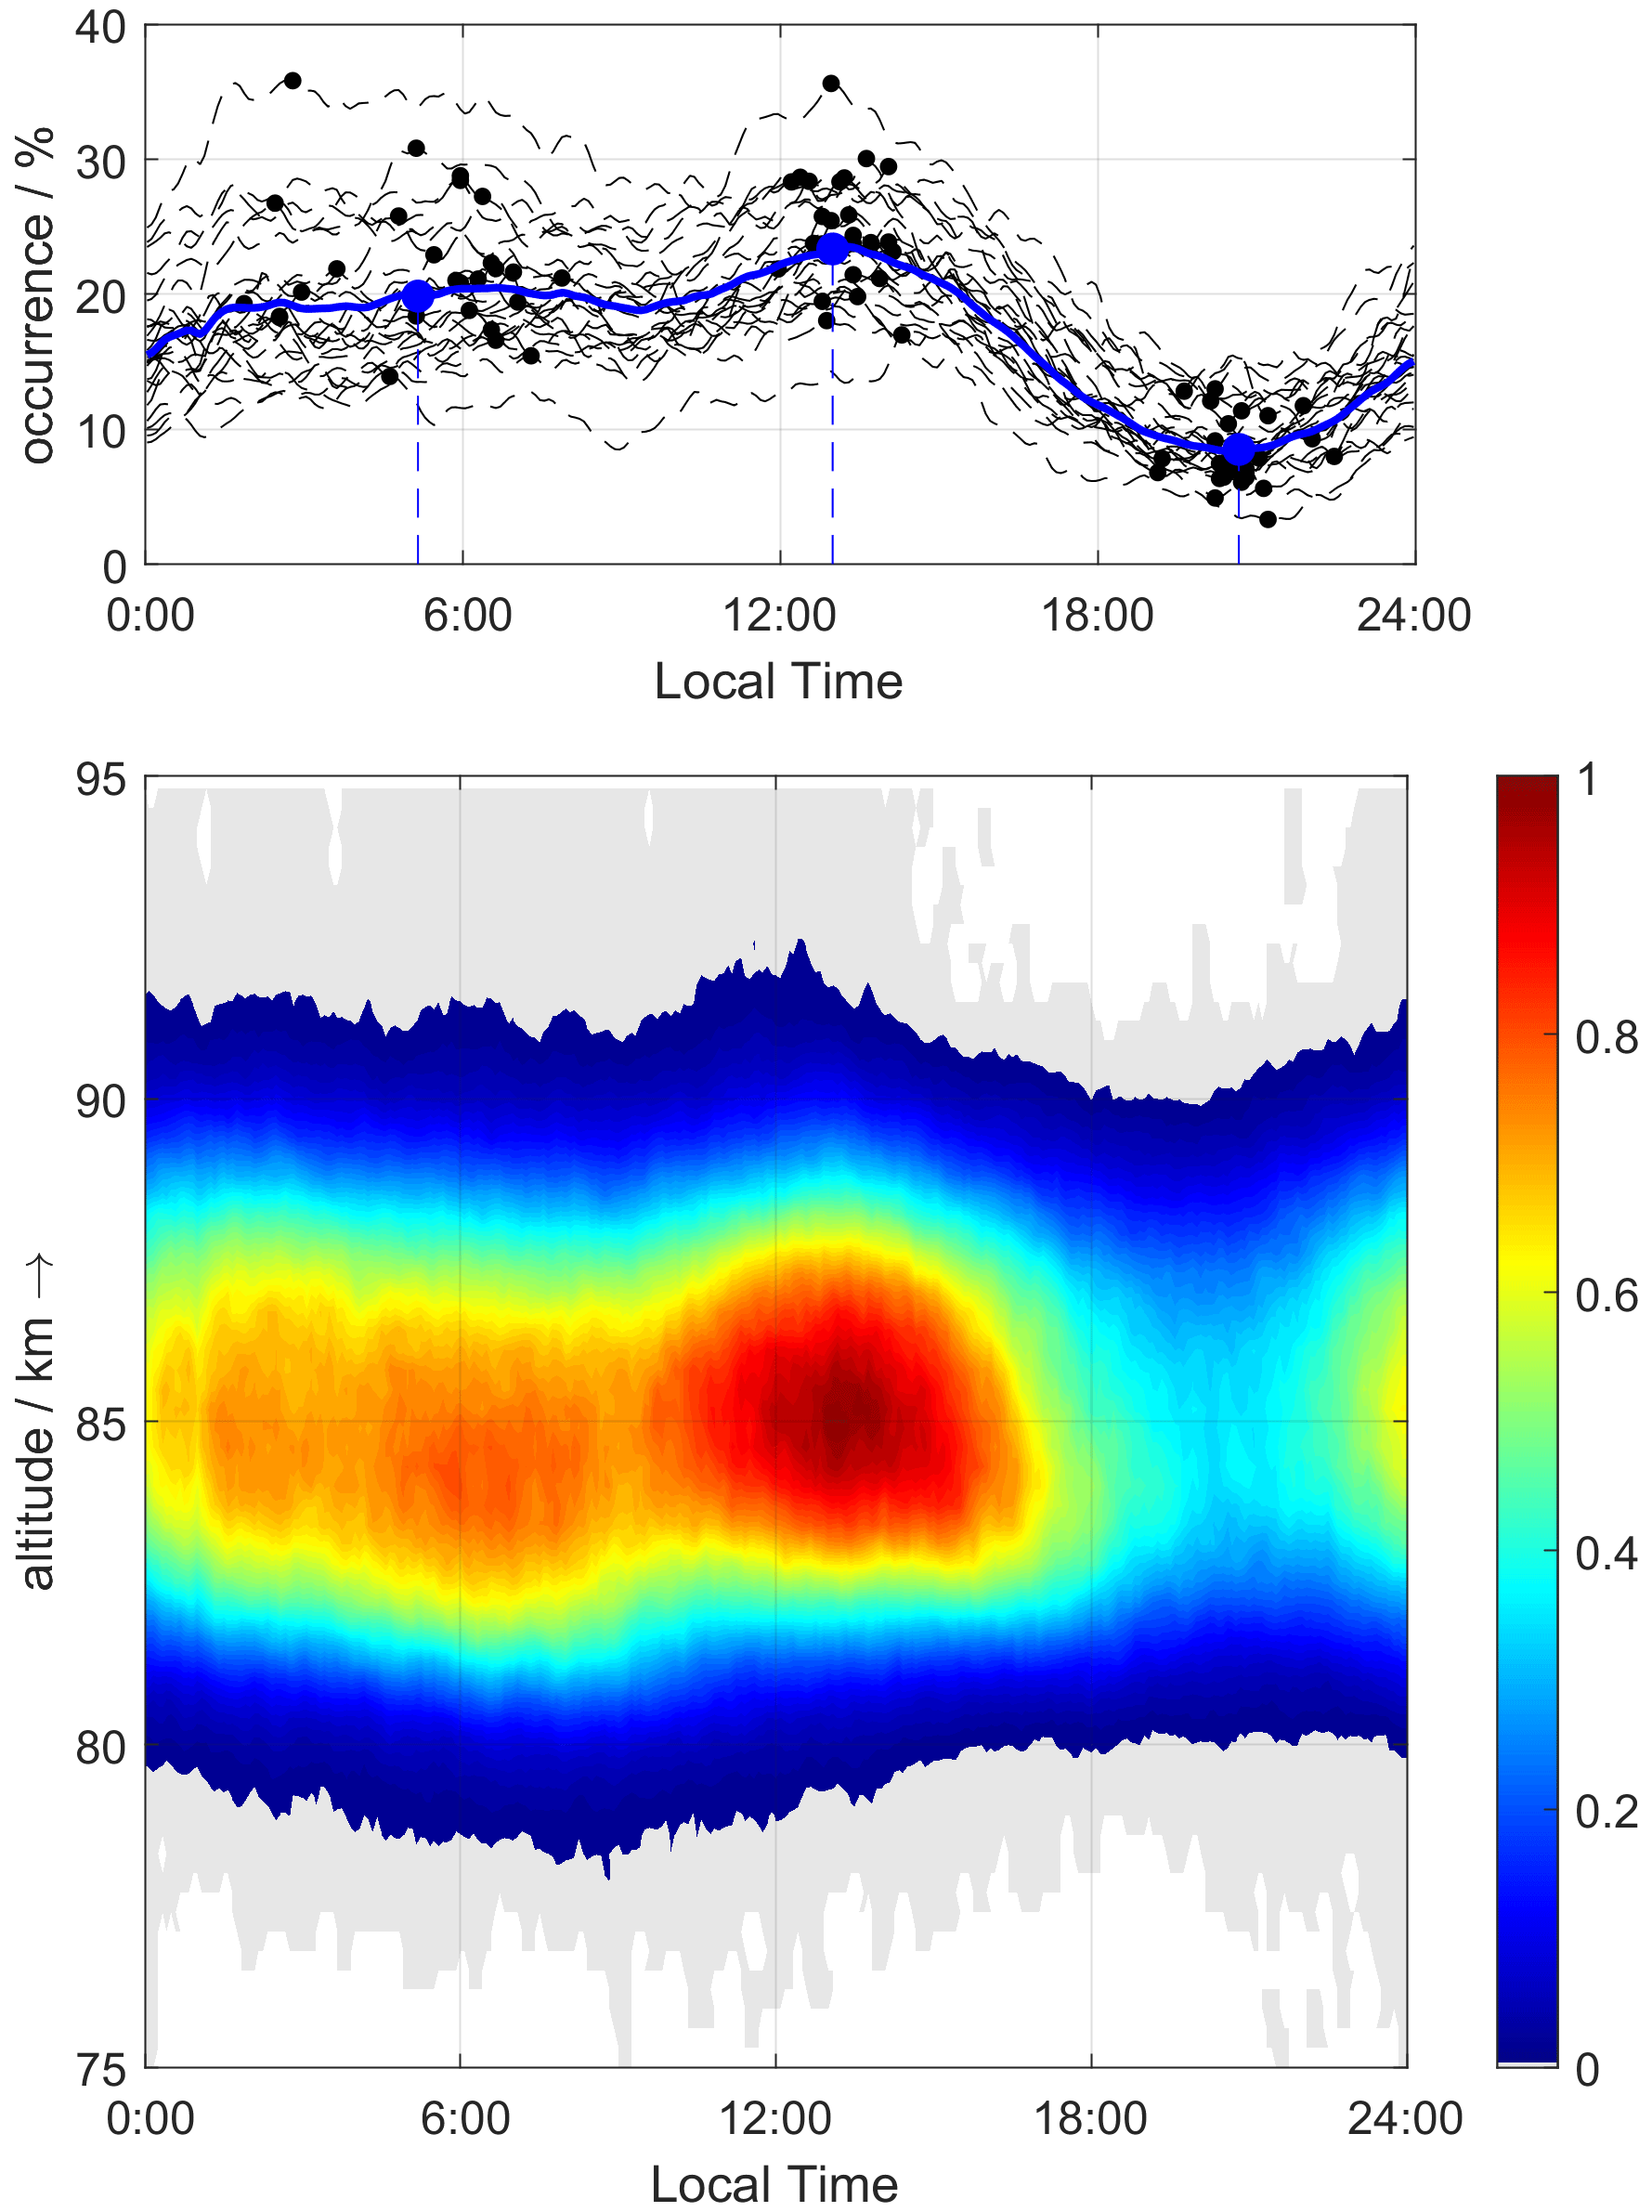
Figure 4Mean diurnal-over-altitude variation (bottom panel) and diurnal variation (top panel) of PMSE derived from radar volume reflectivities obtained with ALWIN (1999–2008) and MAARSY (2010–2025). The blue dots mark the daily times of the first and second maxima as well as the minimum of the mean daily occurrence of PMSE, the black dots indicate the corresponding times of the individual seasons.
4.1 Trends in PMSE occurrence rates (1994–2025)
In order to investigate long-term trends of PMSE appearance over Andøya, the start and end dates and the resulting length of the PMSE season were determined. The upper panel of Fig. 5 illustrates the start and end dates of the PMSE seasons from 1999 to 2025, derived from daily PMSE occurrence rates exceeding the threshold of ηmin (see Eq. 3). Both the onset and termination of the PMSE season exhibit pronounced interannual variability, with particularly late onsets observed in 2002 and 2010. Linear trend analysis reveals a negative trend for the season onset (−0.22 d yr−1) and a positive trend for the season termination (0.24 d yr−1). These opposing trends, most notably the progressively earlier onset of the PMSE season, also impact the overall season duration (see Fig. 5).
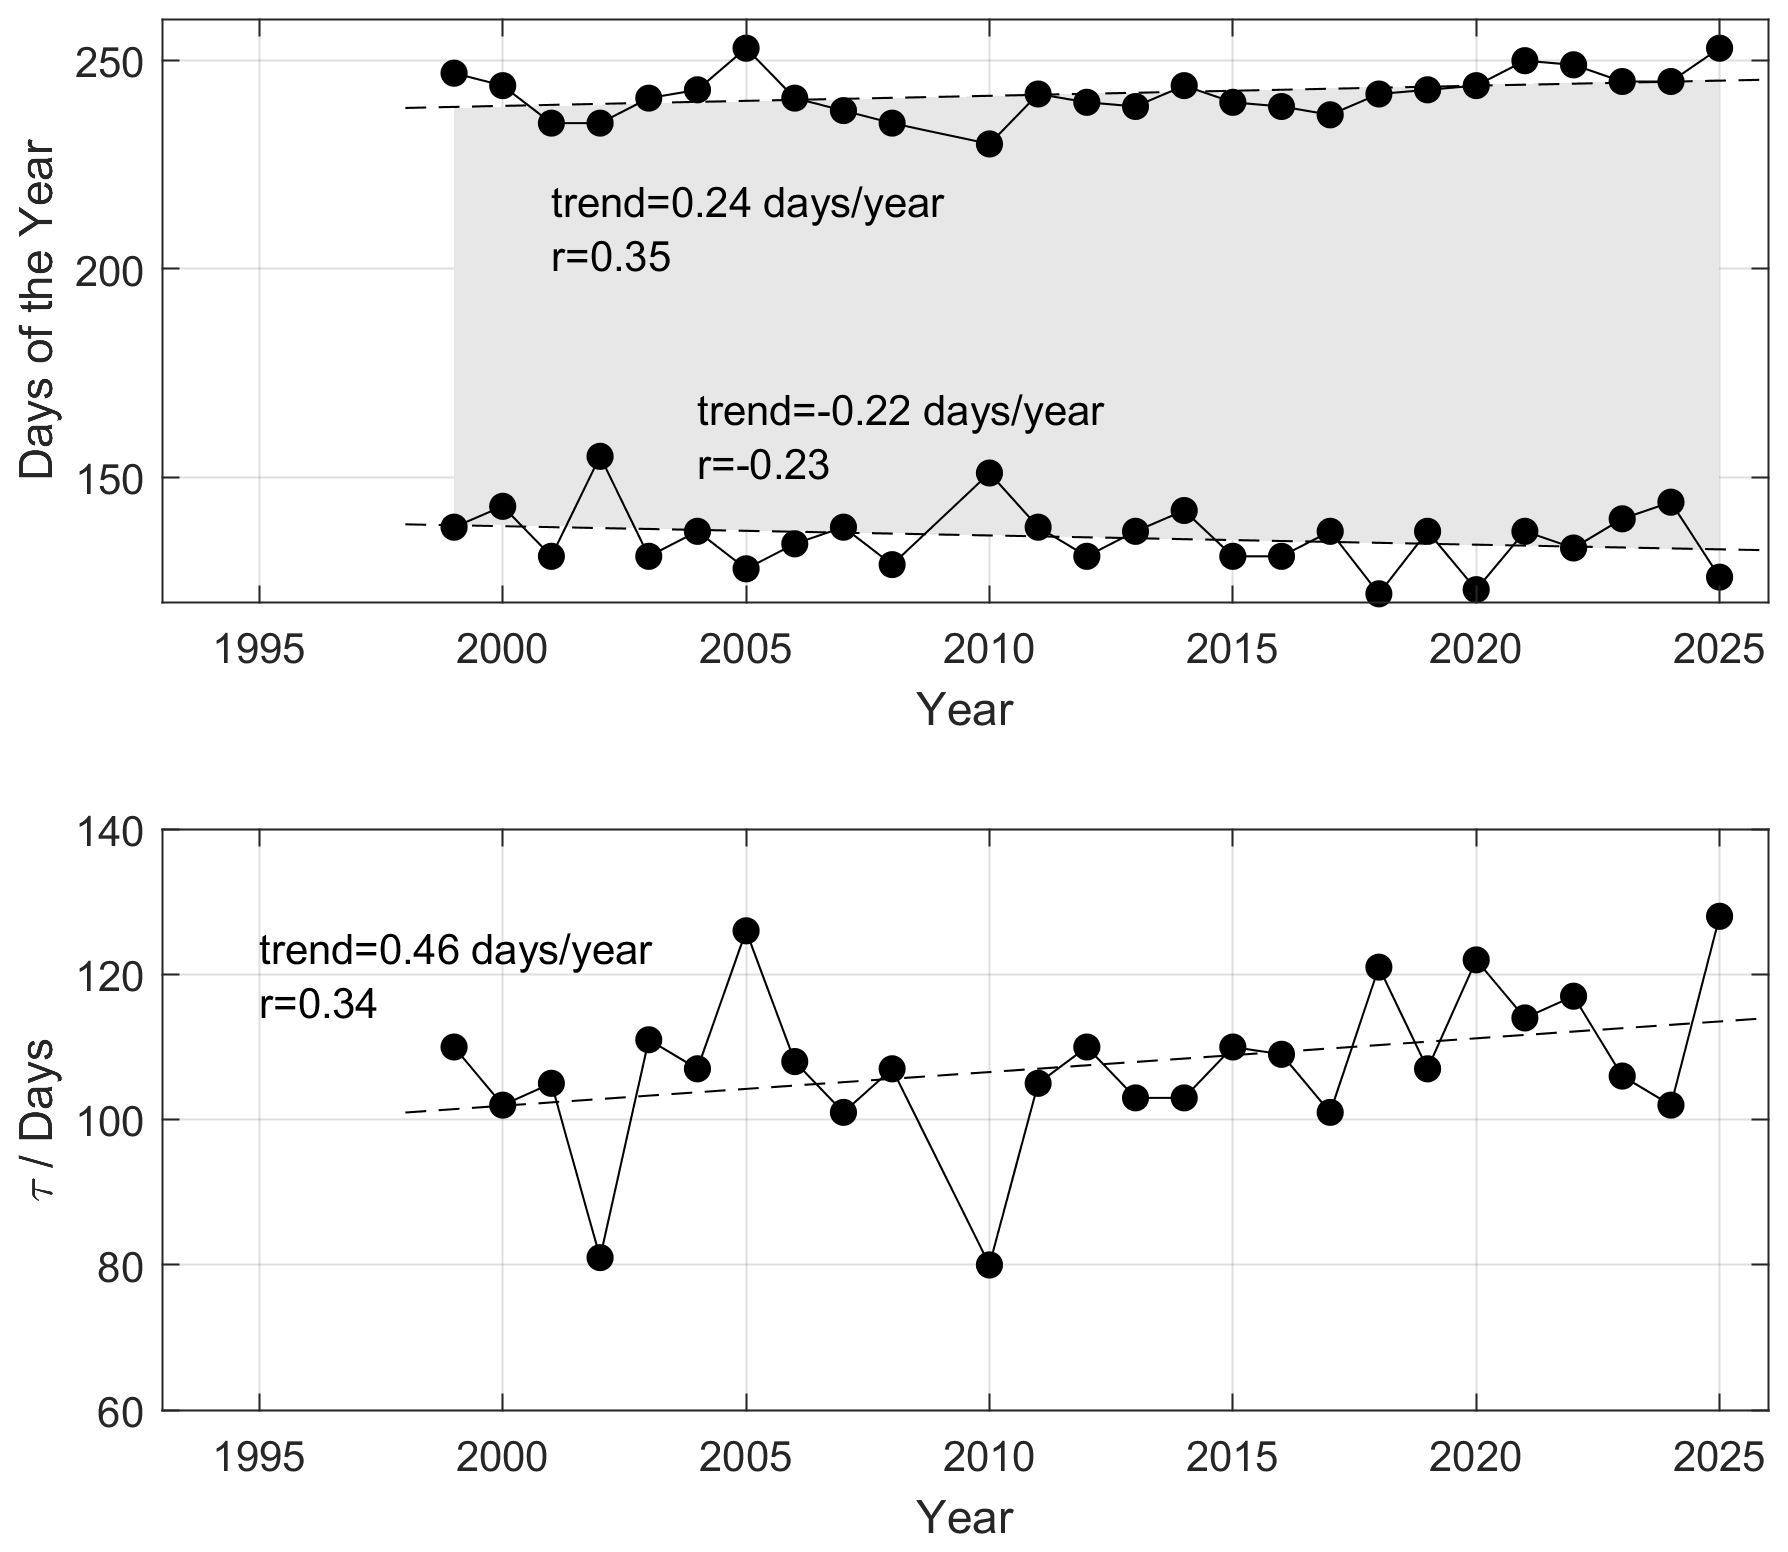
Figure 5Long-term variation of the first and last detected PMSE in each season (upper panel) and the duration τ of the PMSE season (lower panel). All results are based on PMSE events with radar volume reflectivities .
For the study of the long-term behaviour of PMSE occurrence rates, a procedure previously applied by Bremer et al. (2009) and later by Latteck and Bremer (2013, 2017) was applied. From the daily PMSE occurrence rates with a signal strength of mean values were calculated for each year for the period from 1 June to 31 July. The data set was extended by using SOUSY measurements for the years 1994–1997, as described above. The extended data set comprises a total of 30 years of measurements between 1994 and 2025 in Andøa over a period of 32 years, making it the longest measurement series of its kind worldwide.
The extended time series of mean PMSE occurrence rates (OR−15) is shown in the middle panel of Fig. 6. The dashed black line indicates a positive linear trend of 0.28 % yr−1. Corresponding mean values (June/July) of the solar Lyman-α (Lyα) radiation and the geomagnetic Ap index are also shown. Solar Lyα radiation is the dominant ionisation source (via ionisation of nitric oxide) in the undisturbed ionospheric D region, whereas the geomagnetic Ap index may serve as an indicator of precipitating high-energy particle fluxes (Bremer et al., 2009). The correlation coefficients between the mean PMSE occurrence rates and the corresponding Lyα and Ap index averages are r=0.32 and r=0.39, respectively, indicating that PMSE occurrence depends on both solar activity and high-energy particle fluxes.
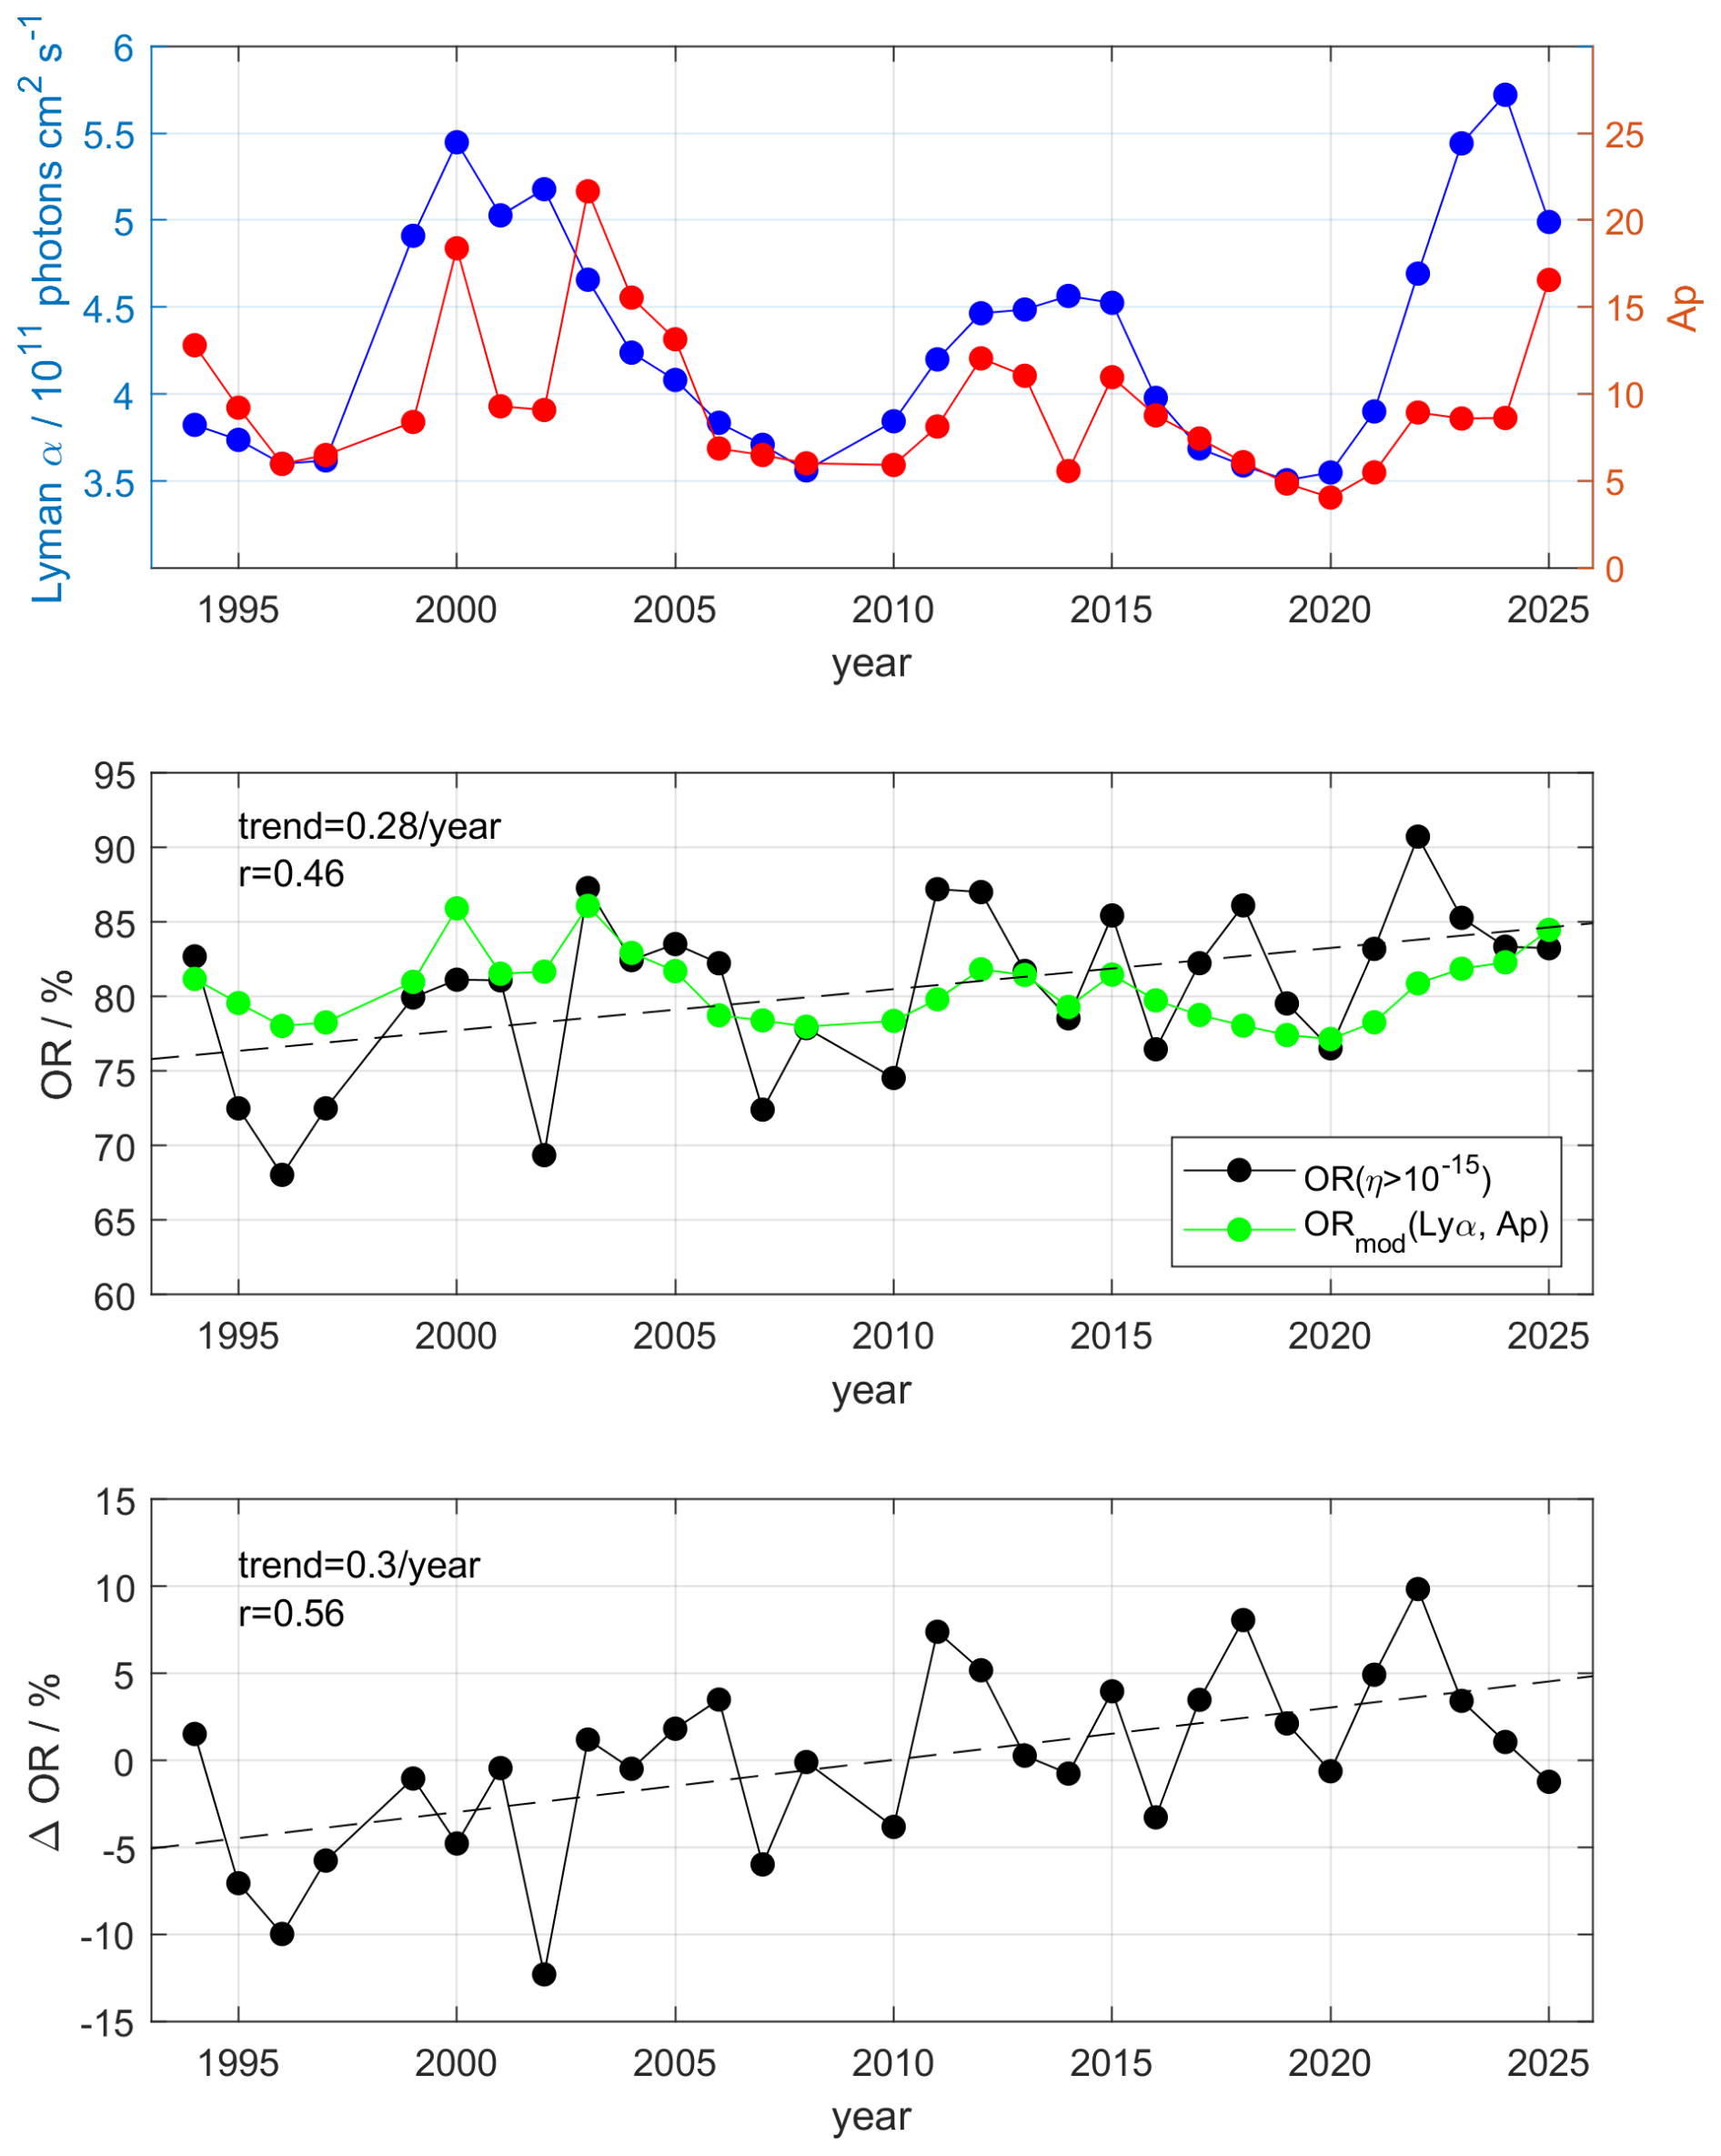
Figure 6Mean values (June/July) of the solar Lyα radiation (top panel, blue), of the geomagnetic activity index Ap (top panel, red), and of the PMSE occurrence rate OR−15 including a linear trend (middle panel, black). The impact of Lyα and Ap on occurrence rates is shown in the middle panel (green). The lower panel shows the long-term variation of PMSE occurrence rates after the solar and geomagnetically influence has been removed.
The solar- and geomagnetically induced components were removed using a simple twofold regression analysis. Mean PMSE occurrence rates, denoted as ORmod, were estimated as a function of Lyα and the geomagnetic Ap index:
The estimated values ORmod were then subtracted from the observed occurrence rates OR−15:
The resulting residuals, ΔOR, are shown in the lower panel of Fig. 6 and exhibit a clearly positive linear trend of 0.3 % yr−1.
To ensure consistency with previous studies by Latteck and Bremer (2013, 2017) and recently by Latteck et al. (2021), an additional regression analysis using a threefold formulation,
was applied to the mean values of Lyα, Ap, and PMSE occurrence rates OR−15. In this formulation, the partial regression coefficient d (in % yr−1) directly represents the long-term trend in PMSE occurrence and can directly be compared with the trend derived from the residual PMSE occurrence rates ΔOR obtained from the twofold regression analysis (Eqs. 4 and 5). In addition, the methods already used in Latteck and Bremer (2017) were also applied, which are based on Eqs. (4) and (5) and only consider the influence of Ap, while Lyα is neglected and vice versa.
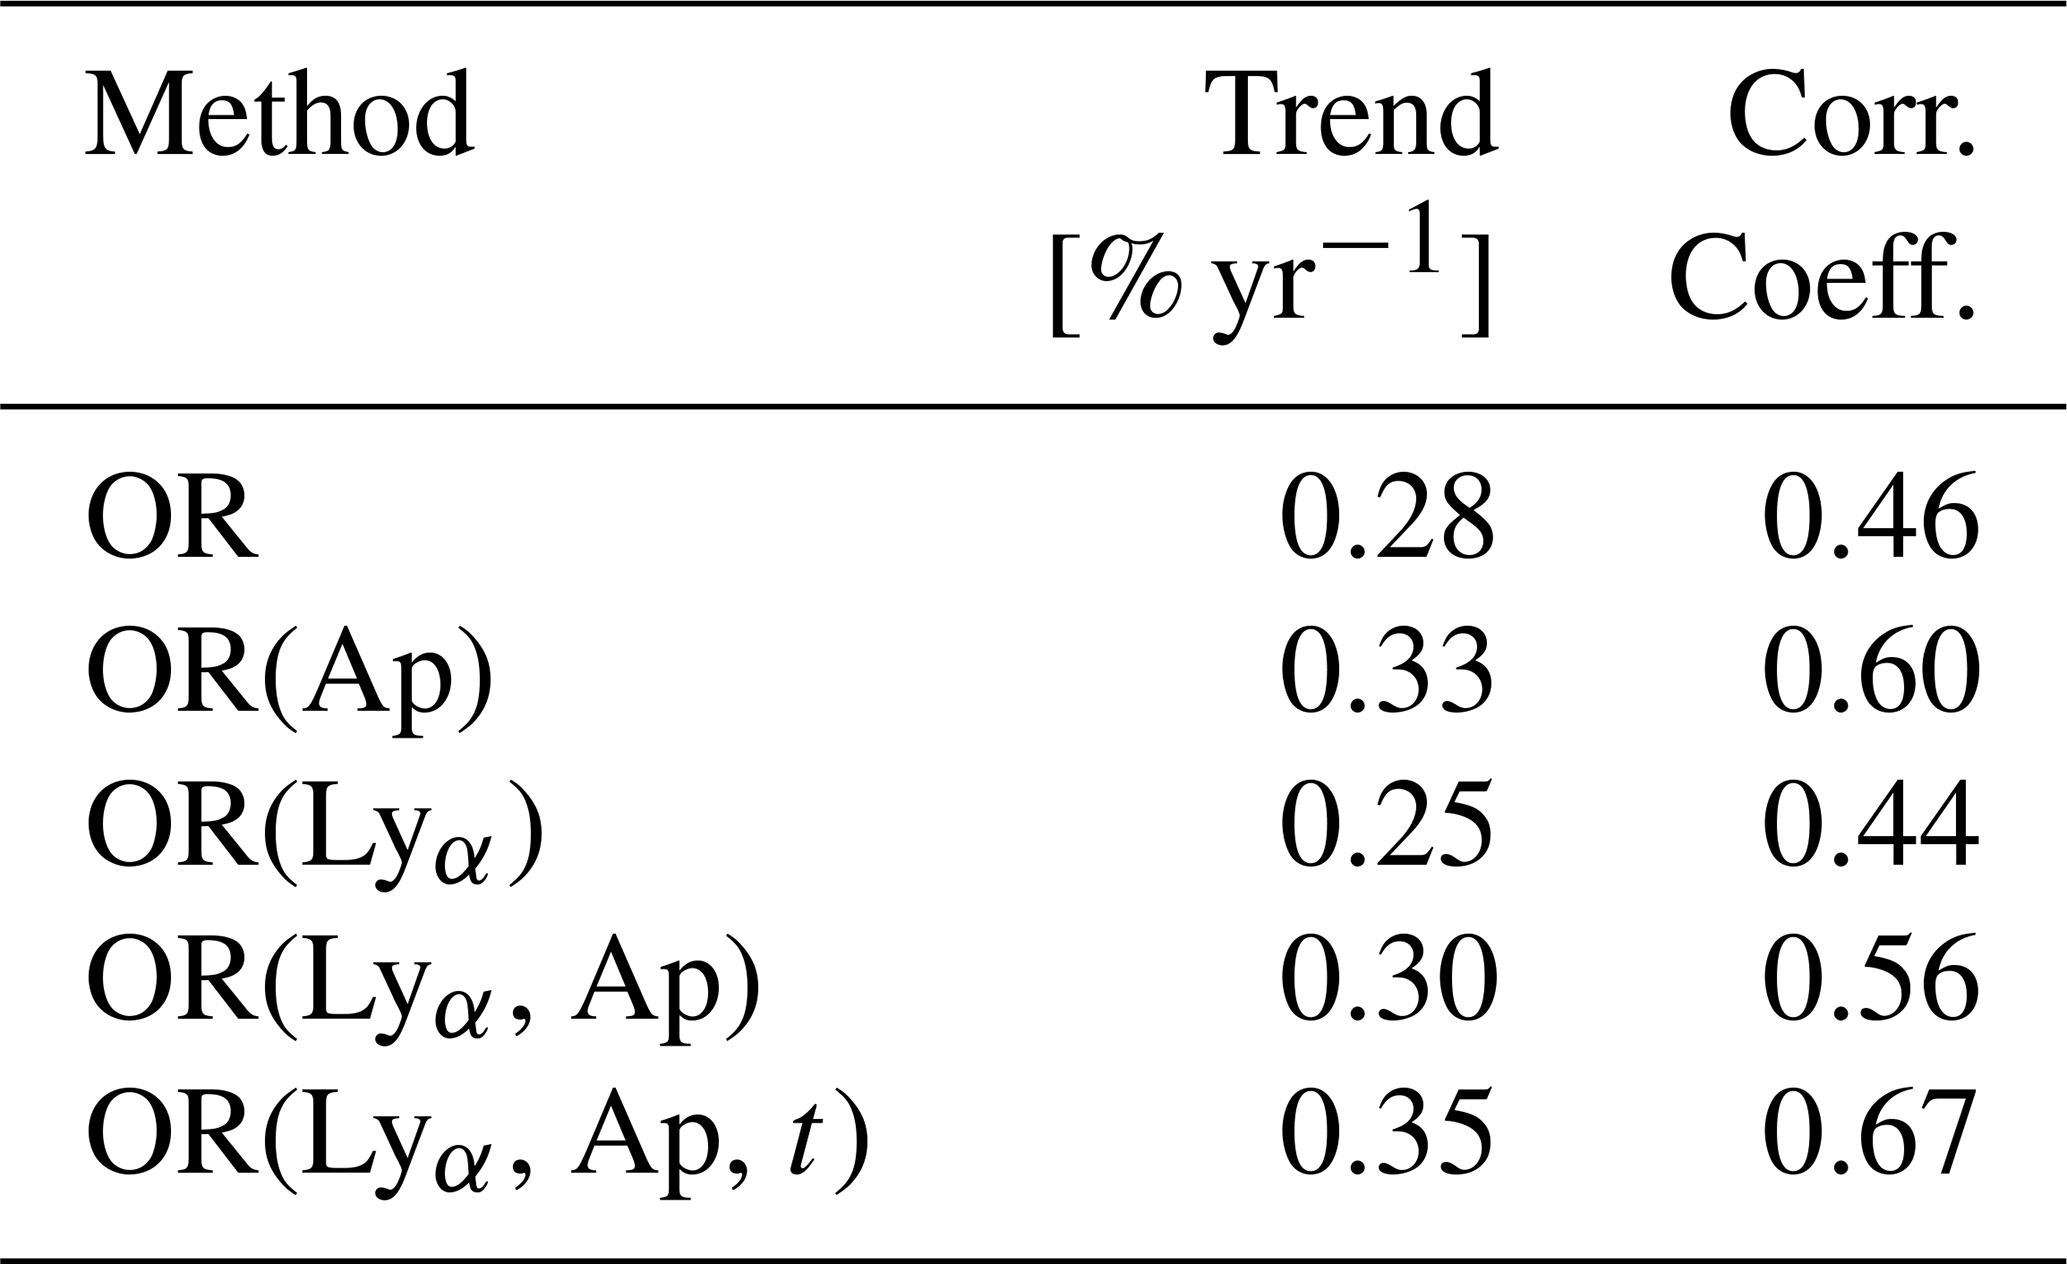
The results from the five applied methods are summarised in Table 4. The first trend (0.28 % yr−1), shown in the middle panel of Fig. 6, was obtained directly from the PMSE occurrence rate OR−15 without accounting for the effects of Ap or Lyα. The second (0.33 % yr−1) and third (0.25 % yr−1) trends were derived after removing only the geomagnetic contribution (OR(Ap)) or only the Lyα contribution (OR(Lyα)), respectively. The fourth trend (0.30 % yr−1), depicted in the bottom panel of Fig. 6, was estimated after eliminating both solar and geomagnetic influences (OR(Lyα, Ap)) using Eqs. (4) and (5). The fifth trend (0.35 % yr−1) resulted from the threefold regression analysis (OR(Lyα, Ap, t)) described in Eq. (6). In summary, all trends reported in Table 4 are positive and cluster around 0.3 % yr−1.
Table 4Trend values of PMSE occurrence rate by using different analysis methods. OR: trend for original OR−15 values; OR(Ap): trend after elimination of Ap influence; OR(Lyα): trend after elimination of Lyα influence, OR(Lyα, Ap): trend after elimination of Lyα and Ap influence; OR(Lyα, Ap, t): trends due to threefold regression.
4.2 Trends in radar reflectivity (1999–2025)
In this section, potential trends of radar reflectivities, η, are discussed. More precisely, the temporal behaviour of yearly mean η-values, ηz, at the maximum of the distribution shown in Fig. 2, namely at 84.0 km, are investigated. As can be seen in Fig. 7, the mean of all yearly ηz-values is (here, and in the following, all η-values are in units of m−1). We will later use the highest and lowest values in the entire time series as an indication of the spread of ηz. The corresponding values are from year 2012, and from year 2020, respectively. There is a very weak negative trend in Fig. 7 with a slope (on the logarithmic values) of [(m−1) yr−1], which is not significant. Standard deviations in each year determined on the logarithmic values are also shown. Typical values are 0.5, i.e., the variation of mean reflectivies within a year is on the order of a factor of 3.
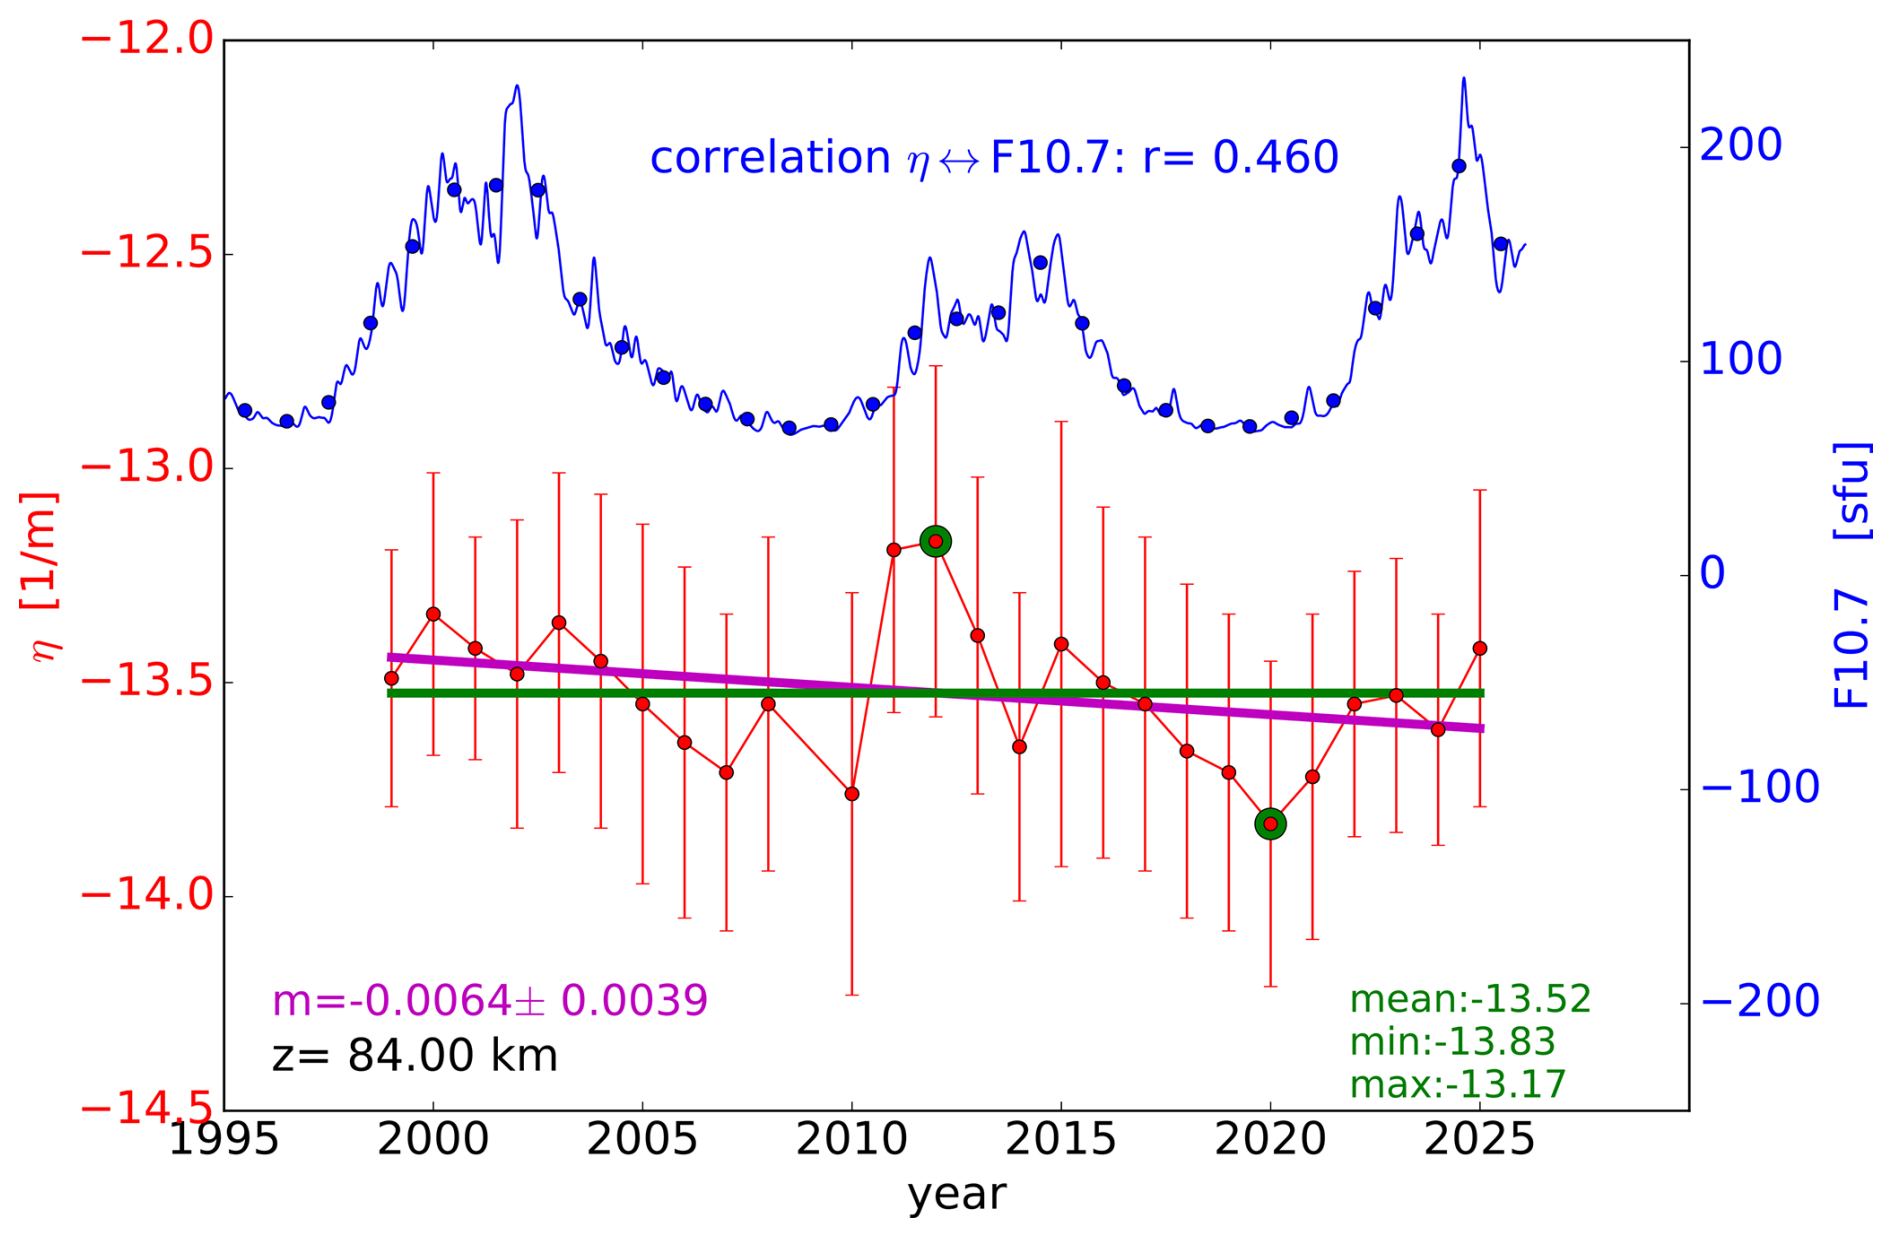
Figure 7Red line: Time dependence of radar reflectivities from MAARSY at a given altitude (83.4 km) close to the maximum of the distribution (see Fig. 2). The green line and the two green dots show the mean and the overall maximum and minimum values, respectively. A straight line fit to the logarithmic values is given by the pink line. The blue line shows the F10.7 cm solar flux (right axis), and the dots represent the yearly mean values of F10.7.
A potential correlation of ηz with solar activity, namely with the solar flux at 10.7 cm (F10.7), was investigated. As can be seen in Fig. 7, there is a relevant positive correlation (correlation coefficient r = 0.46). Since electron densities in the PMSE region are expected to increase with increasing solar activity, and since radar reflectivity depends on electron density, one would ostensibly expect a positive correlation, as observed. It should be noted, however, that the dependence of η on electron densities is rather complicated since it involves further parameters, such as the gradient of electron densities. This topic will be investigated in more detail in the future.
The study was extended to other altitudes close to the height of maximum reflectiviy. It turns out that the results presented above are representative for the entire height range close to the maximum reflectivity.
To investigate the relationship between potential trends of PMSE and background conditions, the crucial parameters impacting η are recapitulated in the following. The main idea is that in the presence of neutral air turbulence and charged ice particles, the spectrum of electron density fluctuations at the radar Bragg scale is enhanced so that significant backscatter is created. There are several models describing this effect. In this paper a model going back to Batchelor (1959) is applied, which has frequently been used in PMSE studies (see, for example, Rapp et al., 2008; Lübken, 2014, where also alternative models are discussed). In the Batchelor model the radar reflectivity η(k) at the radar Bragg wavenumber, k, is given by:
where Me is the reduced potential refractive index gradient (see Rapp et al., 2008).
The parameters in these equations are discussed in more detail in the references given above. The values used here (typical for the PMSE region) are as follows: fα=2; q=2; α=0.83; Ri = 0.81 = Richardson number; Pr = 1 = Prandtl number; g=9.81 [m s−2]; [m] = classical electron radius; [1 s−1] = Brunt-Väisälä frequency; Hn=7000 [m] = neutral density scale height; ν=0.8 [m2 s−1] = kinematic viscosity; ϵ=50 [mW kg−1] = turbulent energy dissipation rate; = Kolmogorov microscale. For the Schmidt number, Sc, the approximation (rice = ice particle radius in nm, see Lübken et al., 1998) is used. Furthermore, the electron density, Ne, and the electron density gradient are needed. In this paper the values [m−3] and [m−4] are used which are compatibel with the empirical reference model FIRI (Friedrich and Torkar, 2001; Friedrich et al., 2018) and fit the observations from MAARSY.
In Fig. 8 spectra of reflectivities for various ice particle radii, i.e., various Schmidt numbers, are shown. It is obvious from this plot that the presence of ice particles is needed to create significant radar echoes, i.e., the spectrum for r=0 nm (Sc=1) gives much too small values for η, whereas even relatively small radii (but larger than approximately 5 nm) can already explain MAARSY observations.
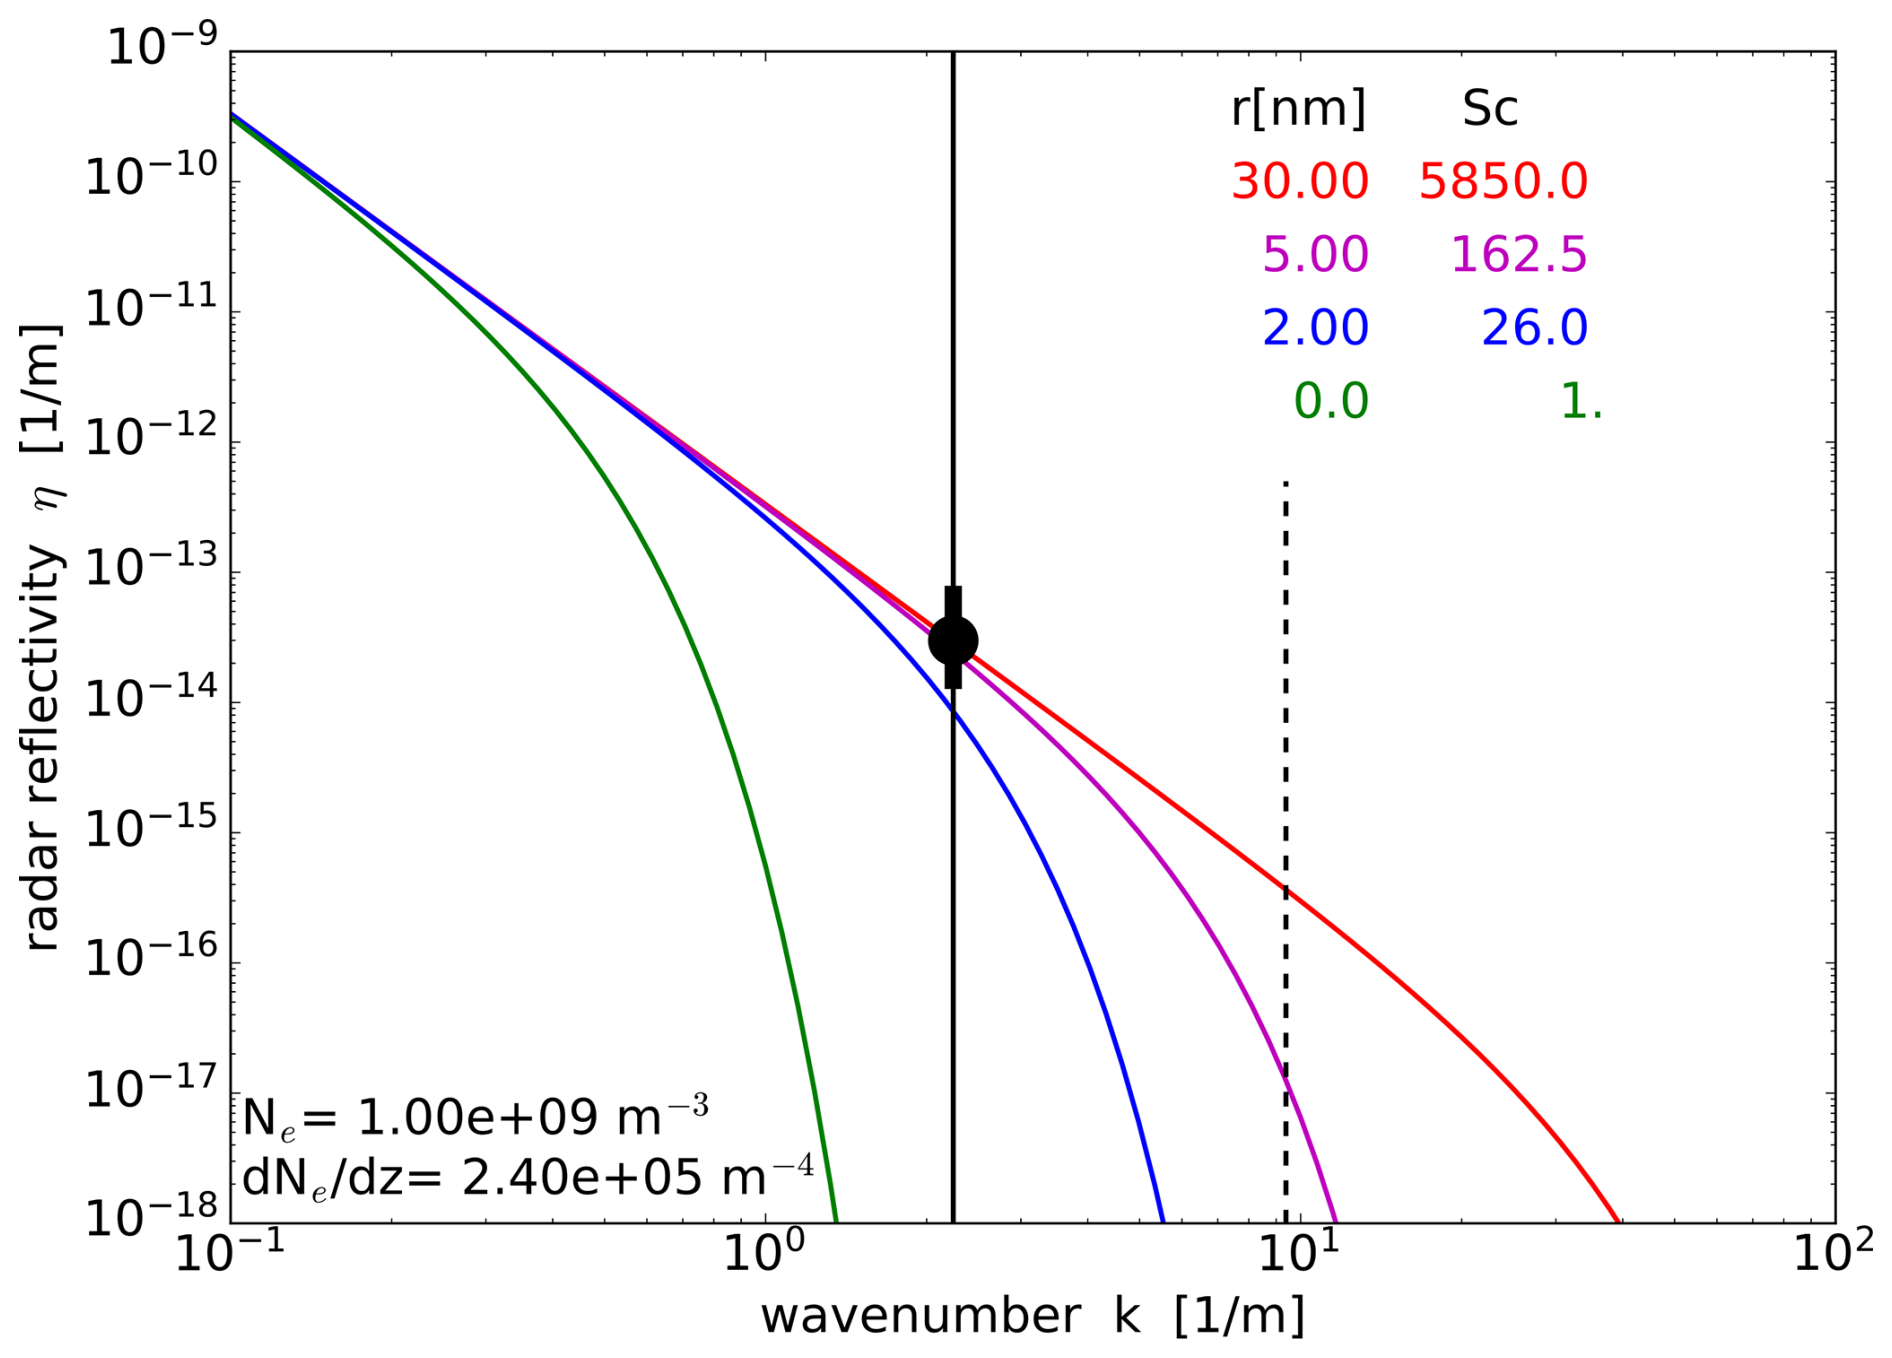
Figure 8Spectra of radar reflectivity according to Eq. (7) for ice particle radii and Schmidt numbers as given in the insert. Other parameters used for the spectra are described in the text. The vertical solid and dashed lines indicate the Bragg wavenumber for MAARSY (kB = 2.24 m−1) and for the EISCAT VHF radar (f = 224 MHz, kB = 9.39 m−1), respectively. The mean reflectivity (black dot) and the range of values observed in the entire time period (, thick vertical line) are also shown.
There is a long-standing discussion on whether or not there is a trend in ice particle radii and/or number densities, and in related phenomena such as noctilucent clouds (Fiedler et al., 2017; Berger and Lübken, 2015; DeLand and Thomas, 2015; Lübken et al., 2021). One might expect that long-term observations of PMSE could contribute to this discussion since they rely on the presence of ice particles. However, PMSE also depend on other parameter, e.g., on turbulence and electron density. This paper concentrates on the sensitivity of radar reflectivity on ice particle radii and electron densities.
Figure 9 shows radar reflectivities as a function of ice particle radii (and Schmidt numbers) for three values of electron density and a given electron density gradient (see insert in that Figure). In all cases the model results are consistent with MAARSY, in particular if the range of values observed in the entire time period (, , see Fig. 7) and the natural variabilty shown in Fig. 7 are taken into account.
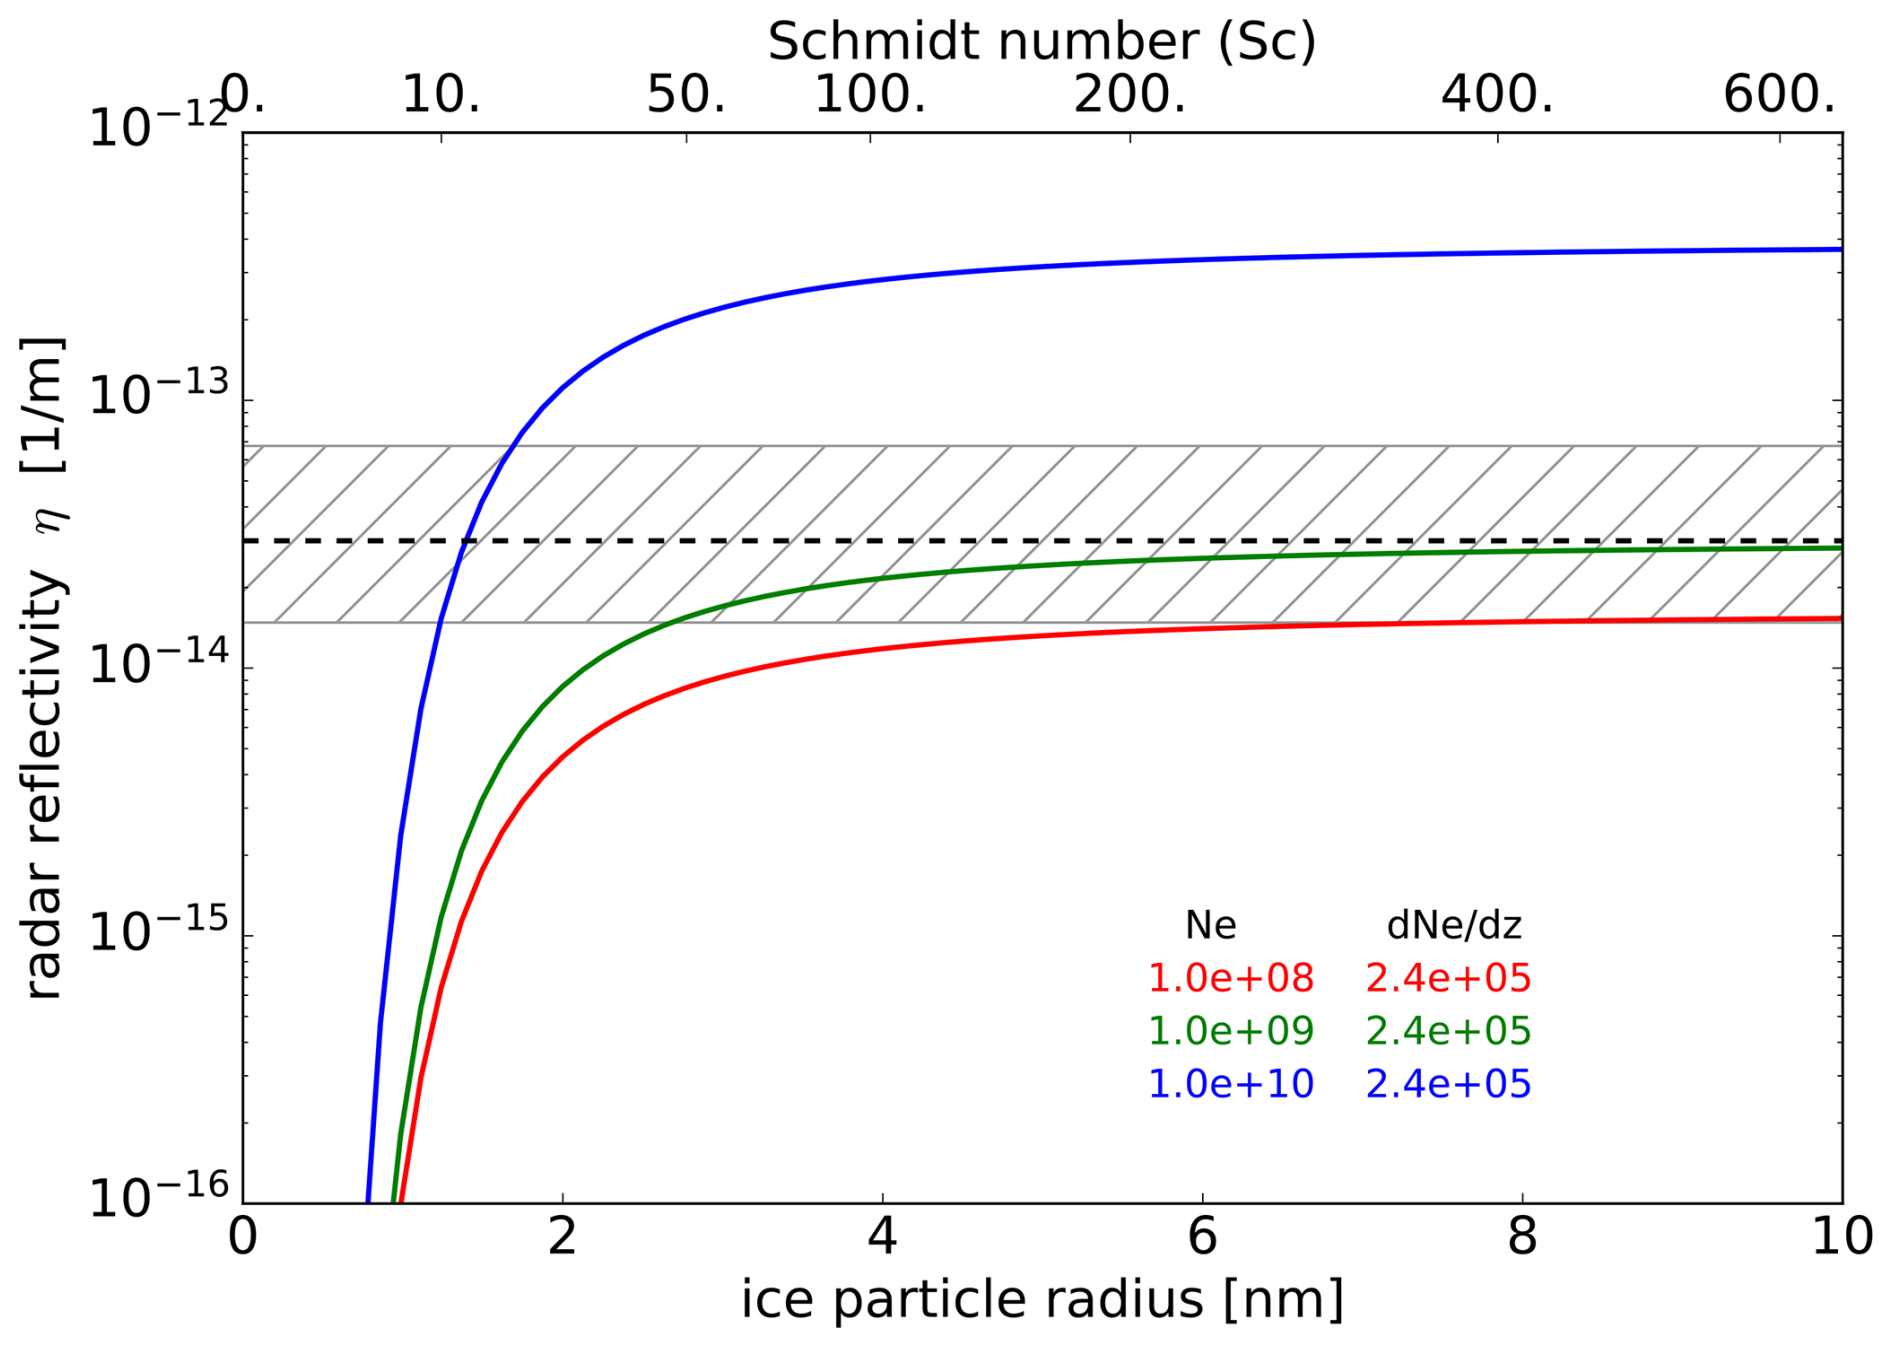
Figure 9Radar reflectivity according to Eq. (7) as a function of ice particle radii (lower axis) and Schmidt numbers (upper axis) for three electron densities, Ne, and a constant electron density gradient (see insert). The dashed line indicates the mean value of η as measured by MAARSY, and the hashed area shows the range between overall maximum () and minimum () values.
As can be seen in Fig. 9, reflectivities are nearly independent of ice particle radii for rice larger than ∼4-5 nm. This has important implications: even small ice particles are sufficient to produce PMSE (as long as they are larger than 4-5 nm), and the intensity of radar reflection is independent of ice particle size in this case. This is consistent with numerous observations that PMSE may be present in the absence of NLC (note that NLC require ice particles with radii larger than ∼15-20 nm). It also means that PMSE are not well suited to study trends of ice particles if these particles exceed a size of 4–5 nm. Fig. 9 also demonstrates that the insensitivity of η to rice is valid for a rather large range of electron densities, namely 1 × 10⁸–1 × 10¹⁰ m−3, at least for our choice of the electron density gradient, . It should be noted, however, that the dependence of η on Ne and is rather complicated which requires a careful investigation and is beyond the scope of this study.
Note that our conclusions are only valid for VHF radars such as MAARSY (53.5 MHz). The radar Bragg scale of higher frequency radars such as the EISCAT VHF radar (224 MHz) is larger compared to MAARSY and the spectra are indeed sensitive to ice particle radii and Schmidt numbers (see dashed line in Fig. 8). In fact, some studies have used the wavelength dependence of the ice particle radii impact on radar reflectivity to deduce microphysical parameters (Rapp et al., 2008; Li et al., 2010).
This paper presents more than 25 years of continuous VHF radar observations of polar mesosphere summer echoes (PMSE) obtained with the ALWIN radar and MAARSY at Andøya, northern Norway, covering the periods 1999–2008 and 2010–2025. The study extends earlier investigations conducted at the same site to include further years (e.g. Bremer et al., 2003, 2006, 2009; Latteck and Bremer, 2013, 2017; Latteck et al., 2021). Regular calibration of both radar systems and the application of radar volume reflectivity as the primary parameter result in a unique long-term data set that allows detailed investigations of PMSE characteristics, including their diurnal, seasonal, and decadal variation.
System-related differences between ALWIN and MAARSY, as well as changes in experimental setups over time, lead to variability in minimum signal detectability. This effect is evident in the different rising slopes of the volume reflectivity distributions shown in Fig. 1. In contrast, the maximum PMSE signal strengths observed by both systems are comparable, reaching values of about 10−9 m−1, as indicated by the high-end tails of the distributions. The 99th-percentile values Q0.99 (Table 2) are similarly close at m−1 for ALWIN and m−1 for MAARSY. Median values Q0.5 differ due to variations in detectability but remain of the same order of magnitude. These results motivated the choice of a common threshold of ηmin (see Eq. 3) which captures the majority of PMSE observations from both systems. The consistency of this approach is supported by the overlap of the June/July mean reflectivity profiles for 1999–2025 as shown in Fig. 2. This threshold enables a largely unbiased estimation of seasonal and diurnal PMSE occurrence rates and facilitates comparison with previous studies.
The seasonal variation in PMSE occurrence for echoes with is summarized in Fig. 3. The results are directly comparable to those of Latteck and Bremer (2017) and represent a straightforward extension. The seasonal occurrence in the upper part of Fig. 3 closely match those shown in Fig. 2 of Latteck and Bremer (2017) and are consistent with earlier findings (e.g. Bremer et al., 2006). Based on the expanded 26-year data set, the average PMSE season begins on 15 May (day 136), lasts 104 d, and ends on 28 August (day 241), with standard deviations of 6.4, 8.3, and 4.5 d, respectively. The earliest PMSE occurrence was observed on 6 May 2018 and the latest on 6 September 2022. Compared to Latteck and Bremer (2017), the mean season now starts 1 d earlier and ends 2 d later. A positive trend of 0.24 d yr−1 is found for the end of the season, while the previously reported negative trend of −0.22 d yr−1 for the start of the season is still valid. The delayed onset in 2002 is attributed to enhanced mesospheric temperatures at polar latitudes (Latteck et al., 2021).
The annual altitude distributions of mean occurrence rates in Fig. 3 show minimal variability from year to year, with a mean peak altitude of 84.7 km and a total range of only 412 m over 26 years which is consistent with earlier analyses (e.g. Latteck et al., 2021). The derived mean peak altitude is in good agreement with findings by Hervig et al. (2011), who reported that the PMSE peak altitude is typically about 2 km higher than the altitude of maximum ice mass density, while closely coinciding with the altitude of peak ice concentration. Moreover, their results suggest a robust relationship between radar reflectivity and ice concentration across all altitudes, alongside an altitude-dependent relationship between reflectivity and electron density, further supporting the interpretation of PMSE occurrence in terms of ice microphysics and ambient plasma conditions.
The diurnal and altitude-dependent PMSE occurrence shown in Fig. 4 reveals enhanced activity between 83 and 87 km from shortly before midnight LT until about 15:00 LT, followed by a pronounced afternoon minimum. The corresponding mean diurnal occurrence curve shows fluctuations around a level of approximately 20 %, with a clear maximum between 11:00 and 15:00 LT (peak at 12:59 LT) and a minimum of about 10 % near 20:39 LT. These results agree well with recent findings by Latteck and Murphy (2024) and confirm earlier descriptions of PMSE diurnal variability (e.g. Klostermeyer, 1999; Hoffmann et al., 1999; Bremer et al., 2001; Latteck and Bremer, 2017). Klostermeyer (1999) concludes that the observed diurnal variations in radar reflectivity are primarily controlled by ionisation. Specifically, the maxima and minima align with those of the total electron production rate. Under quiet solar and geomagnetic conditions, the peak production due to solar radiation at midday and that due to high-energy particle precipitation shortly after midnight are nearly equal, resulting in an apparent semidiurnal component in the reflectivity variation. The relationship between PMSE variability and meridional tidal winds proposed by Hoffmann et al. (1999), whereby temperature modulation by large-scale transport influences PMSE formation, remains a plausible explanation. Hoffmann et al. (1999) compared the diurnal variations of PMSE signal strength (SNR) with those of the meridional wind component at PMSE altitudes and found that both parameters exhibit similar patterns, although their extrema are temporally shifted. Assuming that the meridional wind can transport cold air from high polar latitudes and, conversely, warmer air toward polar regions, and considering that low temperatures are a necessary condition for PMSE formation, they concluded that temperature changes induced by meridional tidal winds advecting cold (warm) air from polar (equatorial) latitudes to the observation site can significantly affect the diurnal variation of PMSE. It is interesting to note that tidal variations of NLC as detected by lidar exhibit a similar minimum of brightness in the late afternoon (see Fig. 1 in Fiedler and Baumgarten, 2018). On the other hand, Bremer et al. (2001) attributed the semi-diurnal variation of PMSE, with maxima around noon and midnight, to the influence of the diurnal variation in geomagnetic activity.
To investigate solar cycle and trend variability, the June/July data sets from ALOMAR-SOUSY (1994–1997; Latteck and Bremer, 2013), ALWIN (1999–2008) and MAARSY (2010–2025) were combined and were analyzed following methods established by Bremer et al. (2009) and frequently applied in later studies.
PMSE occurrence shows positive correlations with both solar Lyα radiation (r=0.32) and the geomagnetic Ap index (r=0.39), indicating a comparable dependence on both parameters. The geomagnetic influence is consistent with earlier work and is attributed to enhanced mesospheric electron densities caused by energetic particle precipitation (Bremer et al., 2009; Latteck and Bremer, 2013, 2017). In contrast, previous studies reported only weak correlations with solar activity, likely due to competing effects. While increased Lyα radiation enhances ionization and electron density, it also promotes higher temperatures and water vapor depletion through photodissociation, which counteract PMSE formation. The present results suggest that geomagnetic forcing and solar activity have a comparable influence on the occurrence of PMSE. After removing solar and geomagnetic effects, the residual PMSE occurrence rates exhibit a positive trend of about 0.3 % yr−1 (Fig. 6) which is close to results reported by Latteck and Bremer (2017) and Latteck et al. (2021) but is slightly smaller than trends derived from shorter data sets (Bremer et al., 2009; Latteck and Bremer, 2013).
The very large PMSE occurrence rates imply that the atmospheric prerequisites for the existence of PMSE must be present nearly all the time in the summer months of June and July. Various parameters are crucial in this context, such as ice particles, low temperatures, water vapor, turbulence, and electron densities. It is important to know that turbulence is present nearly permanently since this allows to extrapolate snapshot measurements by sounding rockets to climatological values. Very little is known about potential decadal trends of any one of these parameters.
As has been noted before, NLC and PMSE are sensitive to different parts in the ice particle population. Still, it is interesting to compare our results to NLC trends published in Fiedler et al. (2017). They found rising occurrence rates but no increase in NLC brightness. It is tempting to explain NCL and PMSE trends in terms of long term variations in temperature. It should be noted, however, that temperature trends from models vary with altitude and are even positive around the mesopause (Berger and Lübken, 2015). Therefore, the impact of temperature trends on ice particle nucleation, growth, sedimentation, sublimation, and radii distribution is difficult to predict. On the other hand, model studies suggest that increasing methane (being oxidized to water vapor in the middle atmosphere) is expected to increase ice particle size (Lübken et al., 2021). However, a further increase of ice particle radii does not have a significant impact on radar reflectivity, as has been shown above.
Fiedler et al. (2017) also identified a significant correlation between NLC parameters and the solar cycle, which is presumably due to the fact that larger temperatures and smaller water vapor abundance at solar maximum lead to smaller particles which reduces backscattering for lidars. On the other hand, the reduction of ice particle radii is presumably not relevant to impact PMSE. It is therefore likely that the observed correlation of radar reflectivity with solar activity is instead caused by a modulation of electron density.
Very little is known about long term trends of other atmospheric parameters relevant for PMSE. This concerns, for example, atmospheric turbulence and electron density. Still, it is interesting to note that radar observations have identified a trend in gravity wave activity (although at lower latitudes), which are presumably the primary source of turbulence (Hoffmann et al., 2011). The sensitivity of radar reflectivity on these parameters will be investigated in the future.
This study is based on more than 25 years of continuous VHF radar observations of PMSE at Andøya (ALWIN: 1999–2008; MAARSY: 2010–2025), using consistently calibrated radar volume reflectivity measurements and a common reflectivity threshold ηmin to enable robust long-term analyses and direct intercomparison with earlier studies. For the analysis of long-term PMSE occurrence, the 26-year record of ALWIN/MAARSY was supplemented with PMSE measurements from the ALOMAR SOUSY radar (also at Andøya) covering the period 1994–1997. The resulting dataset spans a total of 30 years of observations between 1994 and 2025, distributed over a 32-year interval, making it the longest PMSE measurement series of its kind worldwide. Based on these observations the following main results have been found:
-
The differences in minimum signal detectability between ALWIN and MAARSY are evident but well constrained. The maximum PMSE reflectivities and high-quantile statistics are comparable between both systems. The selected threshold captures the majority of relevant PMSE events and allows to combine both data sets.
-
The mean PMSE season lasts 104 d, starting around 15 May and ending near 28 August. There is a significant trend regarding the length of the PMSE season, i.e., the season starts earlier and ends later. The corresponding trends are −0.22 and +0.24 d yr−1, respectively. The anomalously late PMSE onset in 2002 is related to elevated mesospheric temperatures.
-
PMSE occurrence is highest between 83 and 87 km from shortly before midnight to early afternoon. A pronounced maximum occurs between 11:00 and 15:00 LT, followed by a strong decrease in the late afternoon and evening. The observed diurnal pattern agrees well with earlier studies and is presumably influenced by meridional tidal winds and associated temperature variations.
-
PMSE occurrence shows moderate positive correlations with both solar Lyα radiation (r≈0.32) and geomagnetic activity (Ap; r≈0.39). Geomagnetic forcing likely enhances PMSE occurrence through increased mesospheric electron densities. The effect of solar radiation is comparable, but somewhat weaker, presumably due to competing processes, including enhanced ionization, reduced water vapor, and increased temperatures. It should be noted that the maximum radar reflectivity also exhibits a positive correlation with solar activity.
-
After removing solar and geomagnetic contributions, a robust positive PMSE trend of 0.3 % yr−1 remains. This trend is consistent with results from previous studies based on shorter data sets.
-
The length of the PMSE season is increasing on decadal time scales. The most likely explanation is that temperatures get cold enough earlier/later in the season, which is presumably caused by a trend in dynamical forcing by gravity waves. Model studies should clarify if this is the case and if gravity wave generattion and/or filtering are responsible.
-
The altitude of maximum PMSE radar reflectivity is close to ∼ 84 km. The maximum reflectivity at this height, ηz, shows no significant trend. This is explained by the fact that ηz is no longer sensitive to increasing ice particle radii, rice, (i.e., on Schmidt number), once the particles have achieved a critical radius of rice > 4–5 nm. A further increase of rice due to lower temperatures and/or increasing water vapor does not affect ηz. It should be noted that this result is valid for a VHF radar like MAARSY (53.5 MHz) but not necessarily so for higher frequency radars.
An extension of the present analysis to the transitional months of May and August may provide additional insight into the variability of PMSE under less stable thermodynamic conditions compared to the core summer months. Investigating these periods separately, as well as in combination with June and July, could help to further elucidate the sensitivity of PMSE characteristics to changing background conditions. Such an analysis is therefore considered a promising direction for future work. In the current study, however, the focus is deliberately placed on June and July to maintain consistency and comparability with previous long-term trend analyses, which rely on the relatively stable PMSE occurrence frequencies during these months.
A further promising extension of the present work would be to repeat the applied analysis for selected subsets of PMSE occurrences, as well as for different local time intervals. In particular, separating data into periods expected to be dominated by solar Lyman-α radiation and those more strongly influenced by auroral particle precipitation could provide a more detailed understanding of the relative contributions of these ionisation sources. Likewise, restricting the analysis to specific PMSE subsets may help to isolate conditions under which one mechanism prevails over the other. Such targeted investigations have the potential to refine the interpretation of the relationships identified here and are therefore considered a valuable direction for future studies.
The parameters derived from the radar measurements and further data analyses which were used to create the graphs presented in this article, can be found at the following address: https://doi.org/10.22000/ny7zds9wghq3nt4f (Latteck, 2026).
RL had the main responsibility for the radar experiments in Andøya. RL and FJL analysed the data and wrote the article. Both authors read, corrected and agreed with the submitted version of the manuscript.
At least one of the (co-)authors is a guest member of the editorial board of Advances in Radio Science for the special issue “Kleinheubacher Berichte 2025”. The peer-review process was guided by an independent editor, and the authors also have no other competing interests to declare.
Publisher's note: Copernicus Publications remains neutral with regard to jurisdictional claims made in the text, published maps, institutional affiliations, or any other geographical representation in this paper. The authors bear the ultimate responsibility for providing appropriate place names. Views expressed in the text are those of the authors and do not necessarily reflect the views of the publisher.
This article is part of the special issue “Kleinheubacher Berichte 2025”. It is a result of the Kleinheubacher Tagung 2025, Miltenberg, Germany, 23–25 September 2025.
The authors are indebted to the staff of Andøya Space for their permanent support. We thank Jorge L. Chau and Toralf Renkwitz from the Leibniz Institute of Atmospheric Physics for their valuable comments. We dedicate this paper to the memory of our colleague Dr. Jürgen Bremer, who passed away in September 2025. His scientific work and long-term commitment have had a lasting impact on this study and the community.
This paper was edited by Matthias Förster and reviewed by Markus Rapp and Michael T. Rietveld.
Batchelor, G. K.: Small-scale variation of convected quantities like temperature in a turbulent fluid, J. Fluid Mech., 5, 113–133, 1959. a
Berger, U. and Lübken, F.-J.: Trends in mesospheric ice layers in the Northern Hemisphere during 1961–2013, J. Geophys. Res.-Atmos., 120, 11277–11298, https://doi.org/10.1002/2015JD023355, 2015. a, b
Bremer, J., Hansen, T. L., Hoffmann, P., and Latteck, R.: Dependence of polar mesosphere summer echoes on solar and geomagnetic activity, Adv. Space Res., 28, 1071–1076, 2001. a, b
Bremer, J., Hoffmann, P., Latteck, R., and Singer, W.: Seasonal and long-term variations of PMSE from VHF radar observations at Andenes, Norway, J. Geophys. Res.-Atmos., 108, https://doi.org/10.1029/2002JD002369, 2003. a
Bremer, J., Hoffmann, P., Höffner, J., Latteck, R., Singer, W., Zecha, M., and Zeller, O.: Long-term changes of mesospheric summer echoes at polar and middle latitudes, J. Atmos. Solar Terr. Phys., 68, 1940–1951, https://doi.org/10.1016/j.jastp.2006.02.012, 2006. a, b
Bremer, J., Hoffmann, P., Latteck, R., Singer, W., and Zecha, M.: Long-term changes of (polar) mesosphere summer echoes, J. Atmos. Sol.-Terr. Phys., 71, 1571–1576, https://doi.org/10.1016/j.jastp.2009.03.010, 2009. a, b, c, d, e, f, g, h
Chilson, P. B., Kirkwood, S., and Nilsson, A.: The Esrange MST radar: A brief introduction and procedure for range validation using balloons, Radio Science, 34, 427–436, https://doi.org/10.1029/1998RS900023, 1999. a
Cho, J. Y. N. and Röttger, J.: An updated review of polar mesosphere summer echoes: Observation, theory, and their relationship to noctilucent clouds and subvisible aerosols, J. Geophys. Res., 102, 2001–2020, 1997. a
Czechowsky, P., Schmidt, G., and Rüster, R.: The mobile SOUSY Doppler radar: Techical design and first results, Science, 19, 441–450, 1984. a
DeLand, M. T. and Thomas, G. E.: Update PMC trends derived from SBUV data, J. Geophys. Res., 120, 2140–2166, https://doi.org/10.1002/2014JD022253, 2015. a
Fiedler, J. and Baumgarten, G.: Solar and lunar tides in noctilucent clouds as determined by ground-based lidar, Atmos. Chem. Phys., 18, 16051–16061, https://doi.org/10.5194/acp-18-16051-2018, 2018. a
Fiedler, J., Baumgarten, G., Berger, U., and Lübken, F.-J.: Long-term variations of noctilucent clouds at ALOMAR, J. Atmos. Solar Terr. Phys., 162, 79–89, https://doi.org/10.1016/j.jastp.2016.08.006, 2017. a, b, c
Friedrich, M. and Torkar, K. M.: FIRI: A semiempirical model of the lower ionosphere, J. Geophys. Res.-Space, 106, 21409–21418, https://doi.org/10.1029/2001JA900070, 2001. a
Friedrich, M., Pock, C., and Torkar, K.: FIRI-2018, an Updated Empirical Model of the Lower Ionosphere, J. Geophys. Res.-Space, 123, 6737–6751, https://doi.org/10.1029/2018JA025437, 2018. a
Hervig, M. E., Rapp, M., Latteck, R., and Gordley, L. L.: Observations of mesospheric ice particles from the ALWIN radar and SOFIE, J. Atmos. Sol.-Terr. Phys., 73, 2176–2183, https://doi.org/10.1016/j.jastp.2010.08.002, 2011. a
Hocking, W. K.: Measurements of turbulent energy dissipation rates in the middle atmosphere by radar techniques: A review, Radio Science, 20, 1403–1422, 1985. a
Hocking, W. K. and Röttger, J.: Studies of polar mesosphere summer echoes over EISCAT using calibrated signal strengths and statistical parameters, Radio Science, 32, 1425–1444, 1997. a
Hocking, W. K., Kelley, M., Rogers, R., Brown, W. O. J., Moorcroft, D., and St. Maurice, J.-P.: Resolute Bay VHF radar: A multipurpose tool for studies of tropospheric motions, middle atmosphere dynamics, meteor physics, and ionospheric physics, Radio Sci., 36, 1829–1857, https://doi.org/10.1029/2000RS001005, 2001. a
Hoffmann, P., Singer, W., and Bremer, J.: Mean seasonal and diurnal variations of PMSE and winds from 4 years of radar observations at ALOMAR, Geophys. Res. Lett., 26, 1525–1528, https://doi.org/10.1029/1999GL900279, 1999. a, b, c
Hoffmann, P., Rapp, M., Singer, W., and Keuer, D.: Trends of mesospheric gravity waves at northern middle latitudes during summer, J. Geophys. Res.-Atmos., 116, https://doi.org/10.1029/2011JD015717, 2011. a
Kirkwood, S., Wolf, I., Nilsson, H., Dalin, P., Mikhaylova, D., and Belova, E.: Polar mesosphere summer echoes at Wasa, Antarctica (73° S): First observations and comparison with 68° N, Geophys. Res. Lett., 34, https://doi.org/10.1029/2007GL030516, l15803, 2007. a
Klostermeyer, J.: On the diurnal variation of polar mesosphere summer echoes, Geophys. Res. Lett., 26, 3301–3304, https://doi.org/10.1029/1999GL003629, 1999. a, b
Latteck, R.: LatteckARS2026, Leibniz Institute of Atmospheric Physics at the University of Rostock [data set], https://doi.org/10.22000/ny7zds9wghq3nt4f, 2026. a
Latteck, R. and Bremer, J.: Long-term changes of polar mesosphere summer echoes at 69° N, J. Geophys. Res.-Atmos., 118, 10441–10448, https://doi.org/10.1002/jgrd.50787, 2013. a, b, c, d, e, f, g, h
Latteck, R. and Bremer, J.: Long-term variations of polar mesospheric summer echoes observed at Andøya (69° N), J. Atmos. Sol.-Terr. Phys., 163, 31–37, https://doi.org/10.1016/j.jastp.2017.07.005, 2017. a, b, c, d, e, f, g, h, i, j, k, l, m, n, o
Latteck, R. and Murphy, D. J.: Climatological comparison of polar mesosphere summer echoes over the Arctic and Antarctica at 69°, Ann. Geophys., 42, 55–68, https://doi.org/10.5194/angeo-42-55-2024, 2024. a
Latteck, R., Singer, W., and Bardey, H.: The ALWIN MST radar – Technical design and performances, in: Proceedings of the 14th ESA Symposium on European Rocket and Balloon Programmes and Related Research, Potsdam, Germany, edited by: Kaldeich-Schürmann, B., ESA Publications Dvision, ESTEC, Noordwijk, the Netherlands, vol. ESA-SP 437, 179–184, ISBN 92-9092-748-8, 1999. a, b, c
Latteck, R., Singer, W., Morris, R. J., Hocking, W. K., Murphy, D. J., Holdsworth, D. A., and Swarnalingam, N.: Similarities and differences in polar mesosphere summer echoes observed in the Arctic and Antarctica, Ann. Geophys., 26, 2795–2806, https://doi.org/10.5194/angeo-26-2795-2008, 2008. a
Latteck, R., Singer, W., Rapp, M., and Renkwitz, T.: MAARSY – the new MST radar on Andøya/Norway, Adv. Radio Sci., 8, 219–224, https://doi.org/10.5194/ars-8-219-2010, 2010. a, b
Latteck, R., Singer, W., Rapp, M., Vandepeer, B., Renkwitz, T., Zecha, M., and Stober, G.: MAARSY – The new MST radar on Andøya: System description and first results, Radio Science, 47, RS1006, https://doi.org/10.1029/2011RS004775, 2012. a, b, c
Latteck, R., Renkwitz, T., and Chau, J. L.: Two decades of long-term observations of polar mesospheric echoes at 69° N, J. Atmos. Sol.-Terr. Phys., 216, 105576, https://doi.org/10.1016/j.jastp.2021.105576, 2021. a, b, c, d, e, f
Li, Q., Rapp, M., Röttger, J., Latteck, R., Zecha, M., Strelnikova, I., Baumgarten, G., Hervig, M., Hall, C., and Tsutsumi, M.: Microphysical parameters of mesospheric ice clouds derived from calibrated observations of polar mesosphere summer echoes at Bragg wavelengths of 2.8 m and 30 cm, J. Geophys. Res.-Atmos., 115, https://doi.org/10.1029/2009JD012271, 2010. a
Lübken, F.-J.: Turbulent scattering for radars: a summary, J. Atmos. Sol.-Terr. Phys., 107, 1–7, https://doi.org/10.1016/j.jastp.2013.10.015, 2014. a
Lübken, F.-J., Rapp, M., Blix, T., and Thrane, E.: Microphysical and turbulent measurements of the Schmidt number in the vicinity of polar mesosphere summer echoes, Geophys. Res. Lett., 25, 893–896, 1998. a
Lübken, F.-J., Baumgarten, G., and Berger, U.: Long term trends of mesopheric ice layers: A model study, J. Atmos. Sol.-Terr. Phys., 214, 105378, https://doi.org/10.1016/j.jastp.2020.105378, 2021. a, b
Probert-Jones, J. R.: The Radar Equation in Meteorology, Q. J. R. Meteorol. Soc., 88, 485–495, 1962. a
Rapp, M. and Lübken, F.-J.: Polar mesosphere summer echoes (PMSE): Review of observations and current understanding, Atmos. Chem. Phys., 4, 2601–2633, https://doi.org/10.5194/acp-4-2601-2004, 2004. a
Rapp, M., Strelnikova, I., Latteck, R., Hoffmann, P., Hoppe, U.-P., Häggström, I., and Rietveld, M.: Polar Mesosphere Summer Echoes (PMSE) studied at Bragg wavelengths of 2.8 m, 67 cm, and 16 cm, J. Atmos. Sol.-Terr. Phys., 70, 947–961, https://doi.org/10.1016/j.jastp.2007.11.005, 2008. a, b, c
Sato, K., Kohma, M., Tsutsumi, M., and Sato, T.: Frequency spectra and vertical profiles of wind fluctuations in the summer Antarctic mesosphere revealed by MST radar observations, J. Geophys. Res.-Atmos., 2016JD025834, https://doi.org/10.1002/2016JD025834, 2017. a
Singer, W., Keuer, D., Hoffmann, P., Czechowsky, P., and Schmidt, G.: The ALOMAR SOUSY radar: Technical design and further developments, in: Proceedings of the 12th ESA Symposium on European Rocket and Balloon Programmes and Related Research, Lillehammer, Norway (ESA SP–370), 409–415, ISBN 92-9092-163-3, 1995. a, b
Skolnik, M.: Radar handbook, Electronics electrical engineering, McGraw-Hill, New York, NY, 2nd edn., ISBN 0-07-057913-X, 1990. a
Smirnova, M., Belova, E., Kirkwood, S., and Mitchell, N.: Polar mesosphere summer echoes with ESRAD, Kiruna, Sweden: Variations and trends over 1997–2008, J. Atmos. Sol.-Terr. Phys., 72, 435–447, https://doi.org/10.1016/j.jastp.2009.12.014, 2010. a
Smirnova, M., Belova, E., and Kirkwood, S.: Polar mesosphere summer echo strength in relation to solar variability and geomagnetic activity during 1997–2009, Ann. Geophys., 29, 563–572, https://doi.org/10.5194/angeo-29-563-2011, 2011. a
Swarnalingam, N., Hocking, W. K., and Argall, P. S.: Radar efficiency and the calculation of decade-long PMSE backscatter cross-section for the Resolute Bay VHF radar, Ann. Geophys., 27, 1643–1656, https://doi.org/10.5194/angeo-27-1643-2009, 2009. a
von Zahn, U. and Bremer, J.: Simultaneous and common-volume observations of noctilucent clouds and polar mesosphere summer echoes, Geophys. Res. Lett., 26, 1521–1524, https://doi.org/10.1029/1999GL900206, 1999. a
- Abstract
- Introduction
- Observation of polar mesospheric summer echoes at Andøya from 1999 until 2025
- Characteristics of PMSE measured by ALWIN and MAARSY on Andøya between 1999 and 2025
- Long term changes in PMSE observations over Andøya
- Discussion
- Summary, conclusion and outlook
- Data availability
- Author contributions
- Competing interests
- Disclaimer
- Special issue statement
- Acknowledgements
- Review statement
- References