 | 19 Sep 2019
D region observations by VHF and HF radars during a rocket campaign at Andøya dedicated to investigations of PMWE
Toralf Renkwitz
Boris Strelnikov
In April 2018 the PMWE1 sounding rocket campaign was conducted at the Andøya Space Center involving coordinated measurements with rockets and ground instruments to measure parameters relevant for testing of the existing theories of polar mesospheric winter echo (PMWE) formation. The Middle Atmosphere Alomar Radar System (MAARSY) was operated to detect PMWE with multiple beam directions to detect favorable launch conditions. A dedicated experiment configuration with five different beam positions was used to point the radar beam along the planned trajectory of the payload. This special radar experiment allowed to obtain basic information about the spatial structure of the PMWE and its dynamical behavior around the flight of the two rockets. PMWE with signal strengths between 10−17 and 10−15 m−1 have been observed by MAARSY during the whole campaign period, starting with a moderate occurrence at the beginning which decreased towards the end of the campaign. Furthermore real common-volume observations by rocket instruments and radar soundings have been carried out at PMWE altitudes on up-leg and down-leg of the rocket flights. The Saura MF radar was operated during both flights probing the mesosphere with a multiple beam scan experiment to derive horizontal winds and electron density profiles. The obtained PMWE characteristics as signal strength and spectral width of the received radar signals as well as estimated horizontal winds and electron densities are presented with particular emphasis to the launch times of the sounding rockets.
- Article
(22817 KB) - Full-text XML
- BibTeX
- EndNote


VHF radar echoes from the mesopause region obtained at polar and middle latitudes during summer time have been used to investigate the behaviour of the mesosphere for more than 30 years. These so-called Polar Mesosphere Summer Echoes (PMSE) are caused by inhomogeneities in the electron density of a size comparable to the radar Bragg scale caused by neutral air turbulence in combination with the effect of negatively charged aerosol or ice particles, whereat the latter can exist only in a cold summer mesopause region. A detailed review about the early observations of PMSE can be found in Cho and Röttger (1997). A comprehensive overview of the understanding of this phenomenon has been published by Rapp and Lübken (2004).
VHF radar echoes have also been observed outside the summer months in the mesosphere but from about 55 to 85 km altitude at both northern and southern latitudes (e.g., Zeller et al., 2006; Kirkwood et al., 2006a; Morris et al., 2011; Latteck and Strelnikova, 2015; Nishiyama et al., 2015). The first observations of these echoes were reported by Czechowsky et al. (1979) and Ecklund and Balsley (1981) for middle and polar latitudes, respectively. Since these echoes primarily occur during the winter months and to emphasize the similarities with PMSE they were later named Polar Mesosphere Winter Echoes (Kirkwood et al., 2002). An example of a PMWE observed by the Middle Atmosphere Alomar Radar System (MAARSY) in November 2017 is shown in Fig. 1 as height-time-intensity plot of the detected radar volume reflectivity.
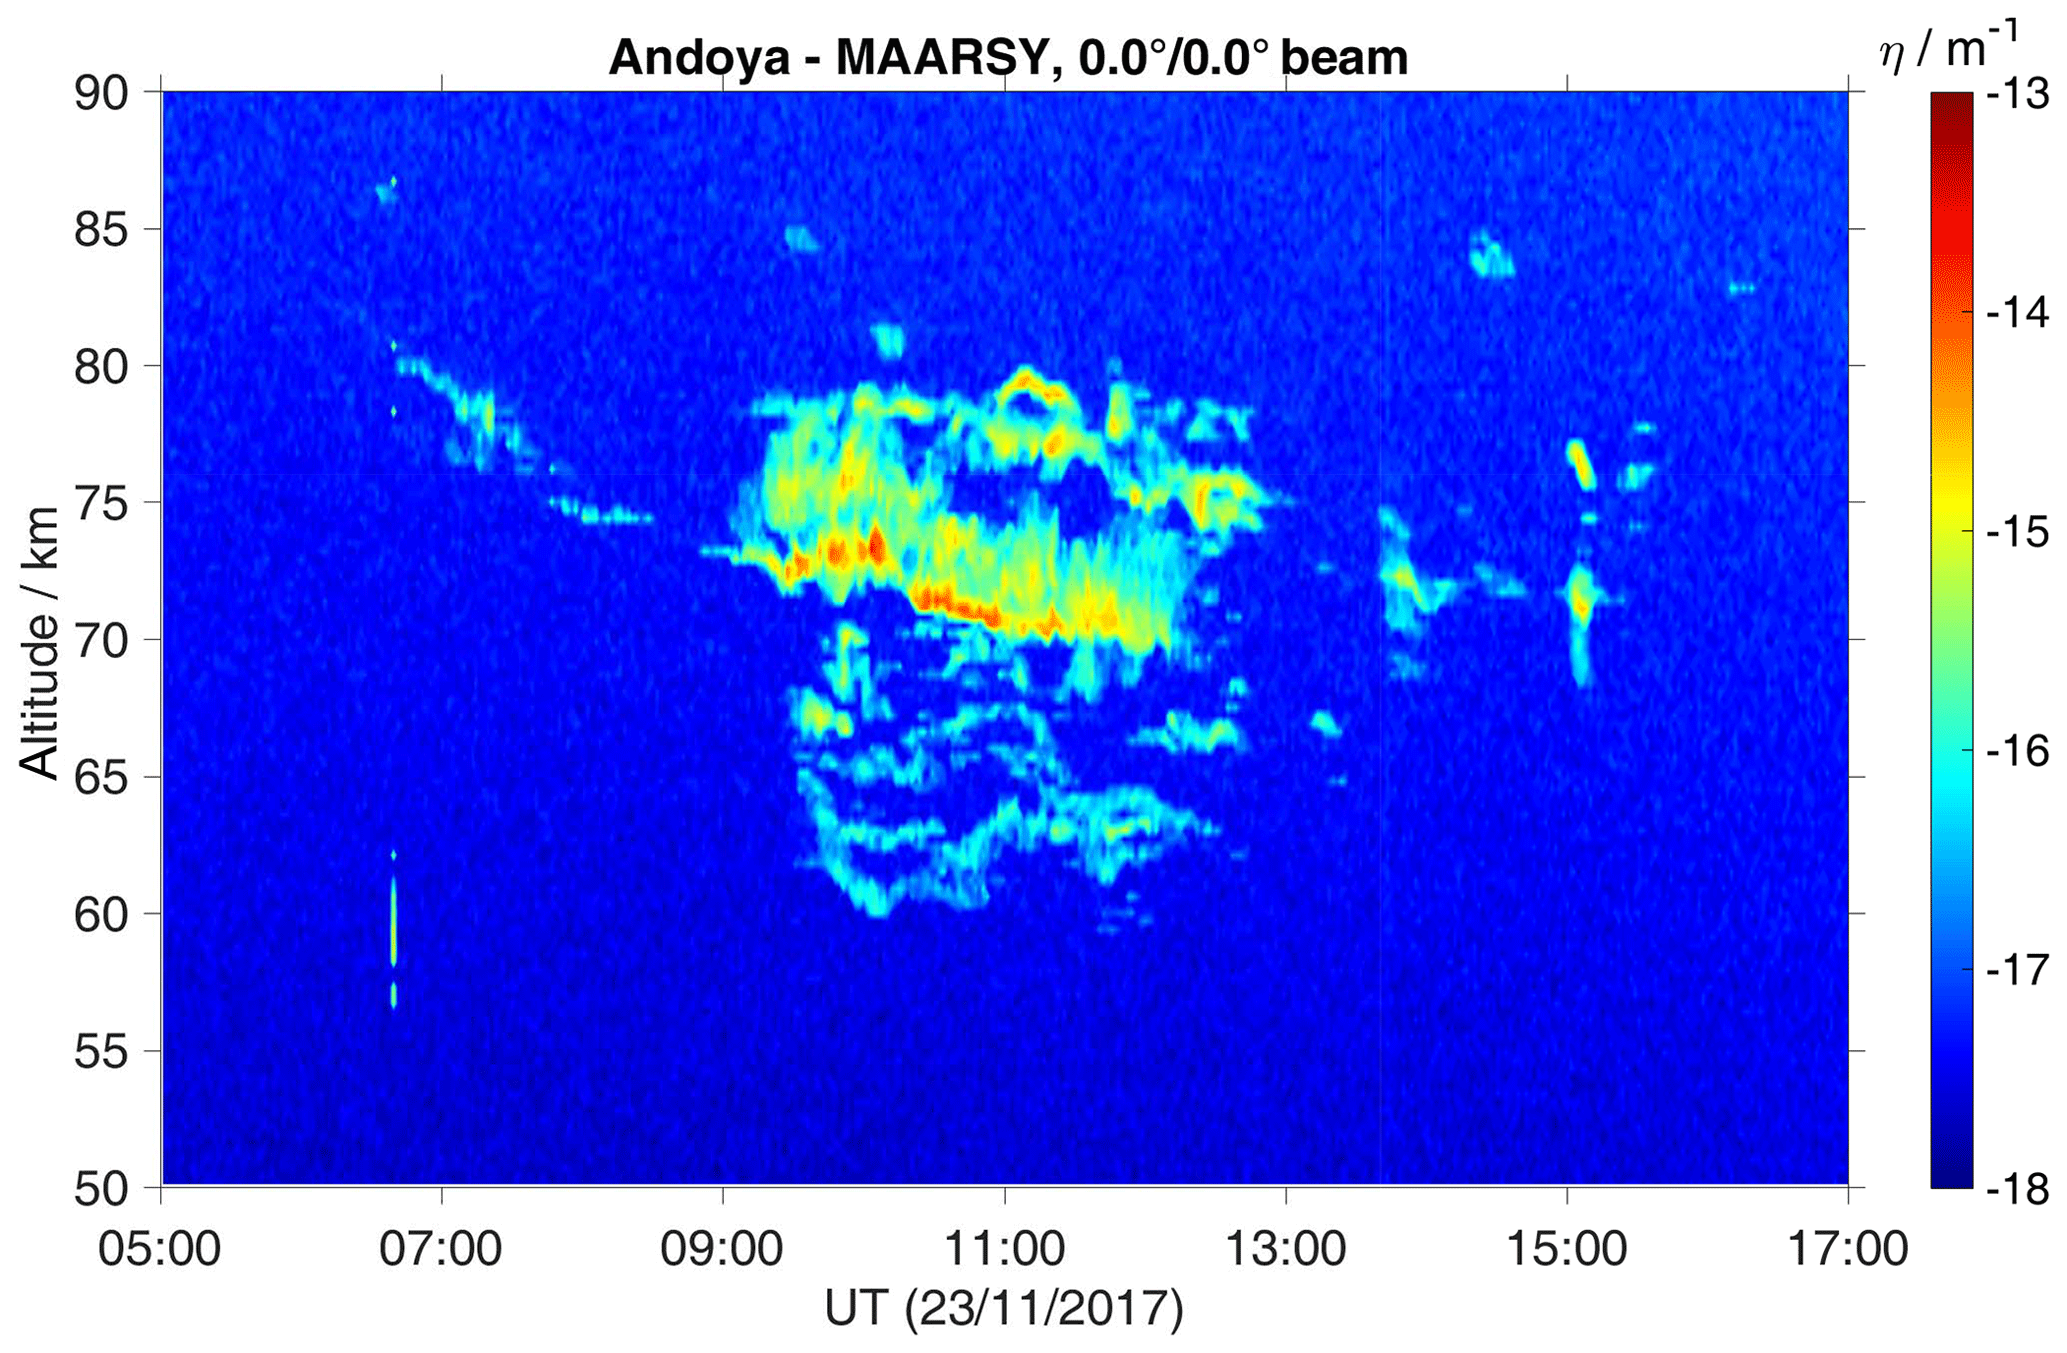
Figure 1Volume reflectivity of Polar Mesosphere Winter Echoes observed by MAARSY at Andøya on 23 November 2017.
Even though PMWE have been studied for more than a decade using radars on various frequencies (e.g. Kirkwood et al., 2002, 2006b; Belova et al., 2005) as well as using sounding rockets (e.g. Lübken et al., 2006; Brattli et al., 2006) the underlying physical mechanism for the creation of these echoes is still debated. Combined in-situ rocket and radar measurements at 50 MHz provided evidence that at least some of these echoes could be attributed to Bragg scattering from fluctuations solely caused by neutral air turbulence (Lübken et al., 2006). However, PMWE observations obtained at 224 MHz by Belova et al. (2005) showed up to two orders of magnitude stronger echoes, which could not be explained by turbulence alone. Kirkwood et al. (2006b) proposed a non-turbulent mechanism involving highly damped ion acoustic waves generated by partial reflection of infrasonic waves. The currently most acceptable explanation of a PMWE formation mechanism supported by measurements with lidar and radar (Kirkwood et al., 2002; Belova et al., 2005; Kero et al., 2008; La Hoz and Havnes, 2008) suggests neutral air turbulence in combination with small charged aerosol particles (probably of meteoric origin) playing a similar role as in the case of PMSE (e.g. Rapp and Lübken, 2004).
MAARSY is continuously running throughout the year observing the both PMSE and PMWE which are used to study dynamics in the mesosphere/lower thermosphere (MLT) region (e.g., Rapp et al., 2011; Strelnikov et al., 2017) and to support sounding rocket campaigns (e.g., Havnes et al., 2018; Strelnikov et al., 2019). In April 2018 a sounding rocket mission specially dedicated to investigation of PMWE took place at the Norwegian Andøya Space Center (ASC). This paper shows observations by MAARSY and the Saura MF radar conducted during this rocket campaign. The paper focuses on technical aspects of radar measurements and does not aim at detailed study of winter echoes themselves. A detailed description of the PMWE sounding rocket mission, its measurement results and in depth analysis of winter echoes will be published in forthcoming papers. The paper is structured as follows: A review on the seasonal and diurnal variation of PMWE occurrence based on observations obtained by MAARSY during seven winter periods from 2011/2012 until 2017/2018 is given in Sect. 2. Section 3 gives a brief overview about the goals of the rocket campaign, describes the radar experiments and data analyses and shows obtained PMWE characteristics on the basis of signal strength of the received radar signals as well as estimated horizontal winds and electron densities measured by the Saura MF radar with particular emphasis on the launch times of the sounding rockets. Section 4 is focused on turbulence estimation based on improved spectral width analysis of the Saura MF radar data obtained during the campaign. A summary of the observations is given at the end.
Continuous observations of PMWE have been conducted at Andøya from September 2004 until April 2008 using the ALWIN radar (Latteck et al., 1999) and since September 2010 using MAARSY. The improved sensitivity of MAARSY of about 17 dB compared to ALWIN leads to a minimum detection limit for PMWE volume reflectivity of about m−1 allowing detections of smaller values of PMWE at altitudes between 50 and 85 km compared to ALWIN. Figure 2 shows mean seasonal distributions of radar volume reflectivity of PMWE (blue bars) and PMSE (red bars) observed on Andøya using MAARSY. The maximum detected volume reflectivity of PMWE of about 10−13 m−1 is about four orders of magnitude smaller compared to the maximum detected volume reflectivity of PMSE. A detailed comparison of both radar systems related to PMWE observations including initial results of long term observations of these echoes based on two years of observations at Andøya has been published by Latteck and Strelnikova (2015).
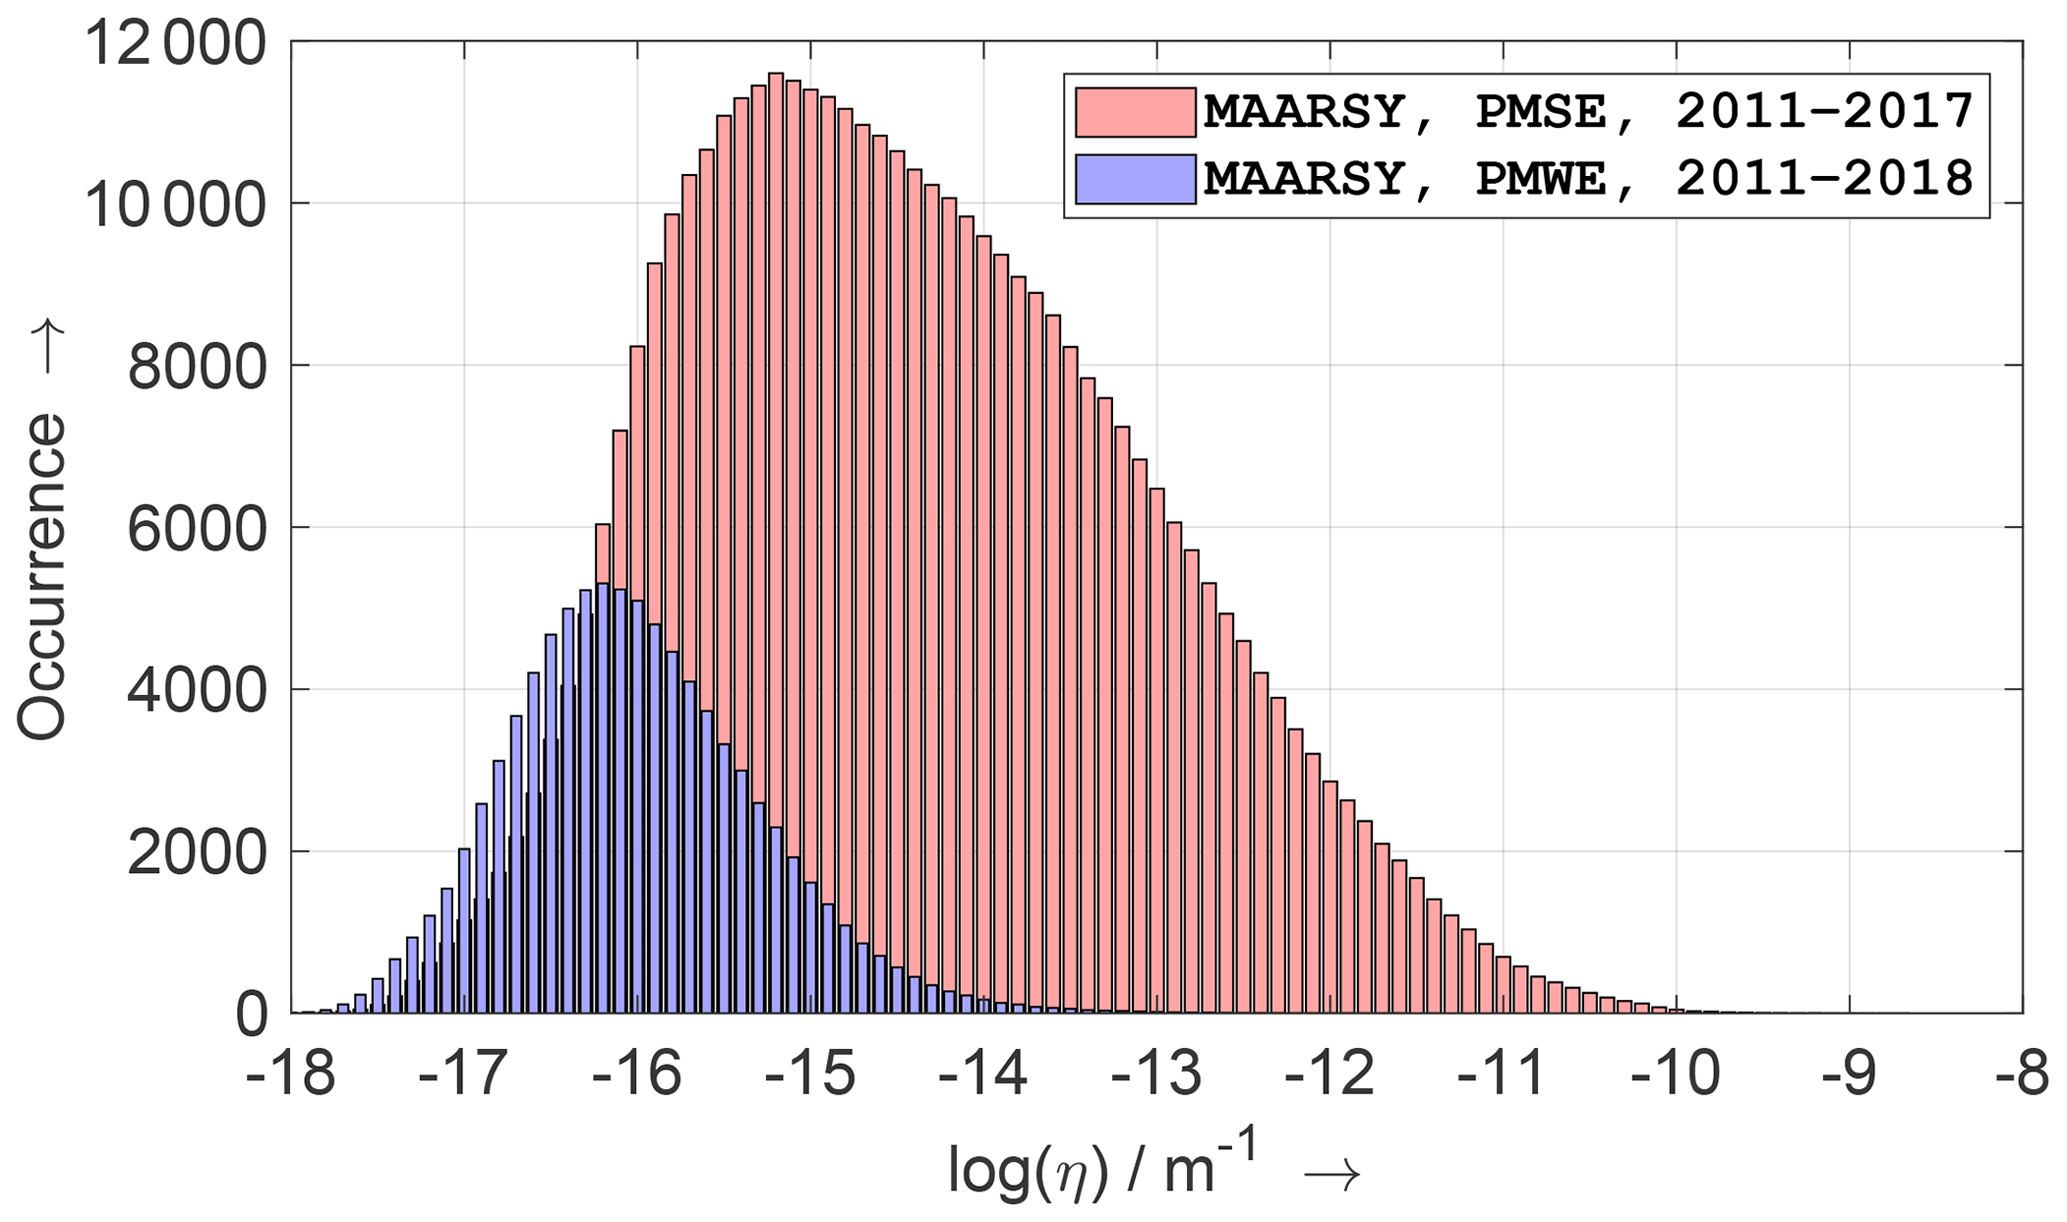
Figure 2Distributions of PMWE (blue) and PMSE (red) volume reflectivity obtained by MAARSY during the winter and summer periods between 2011–2018.
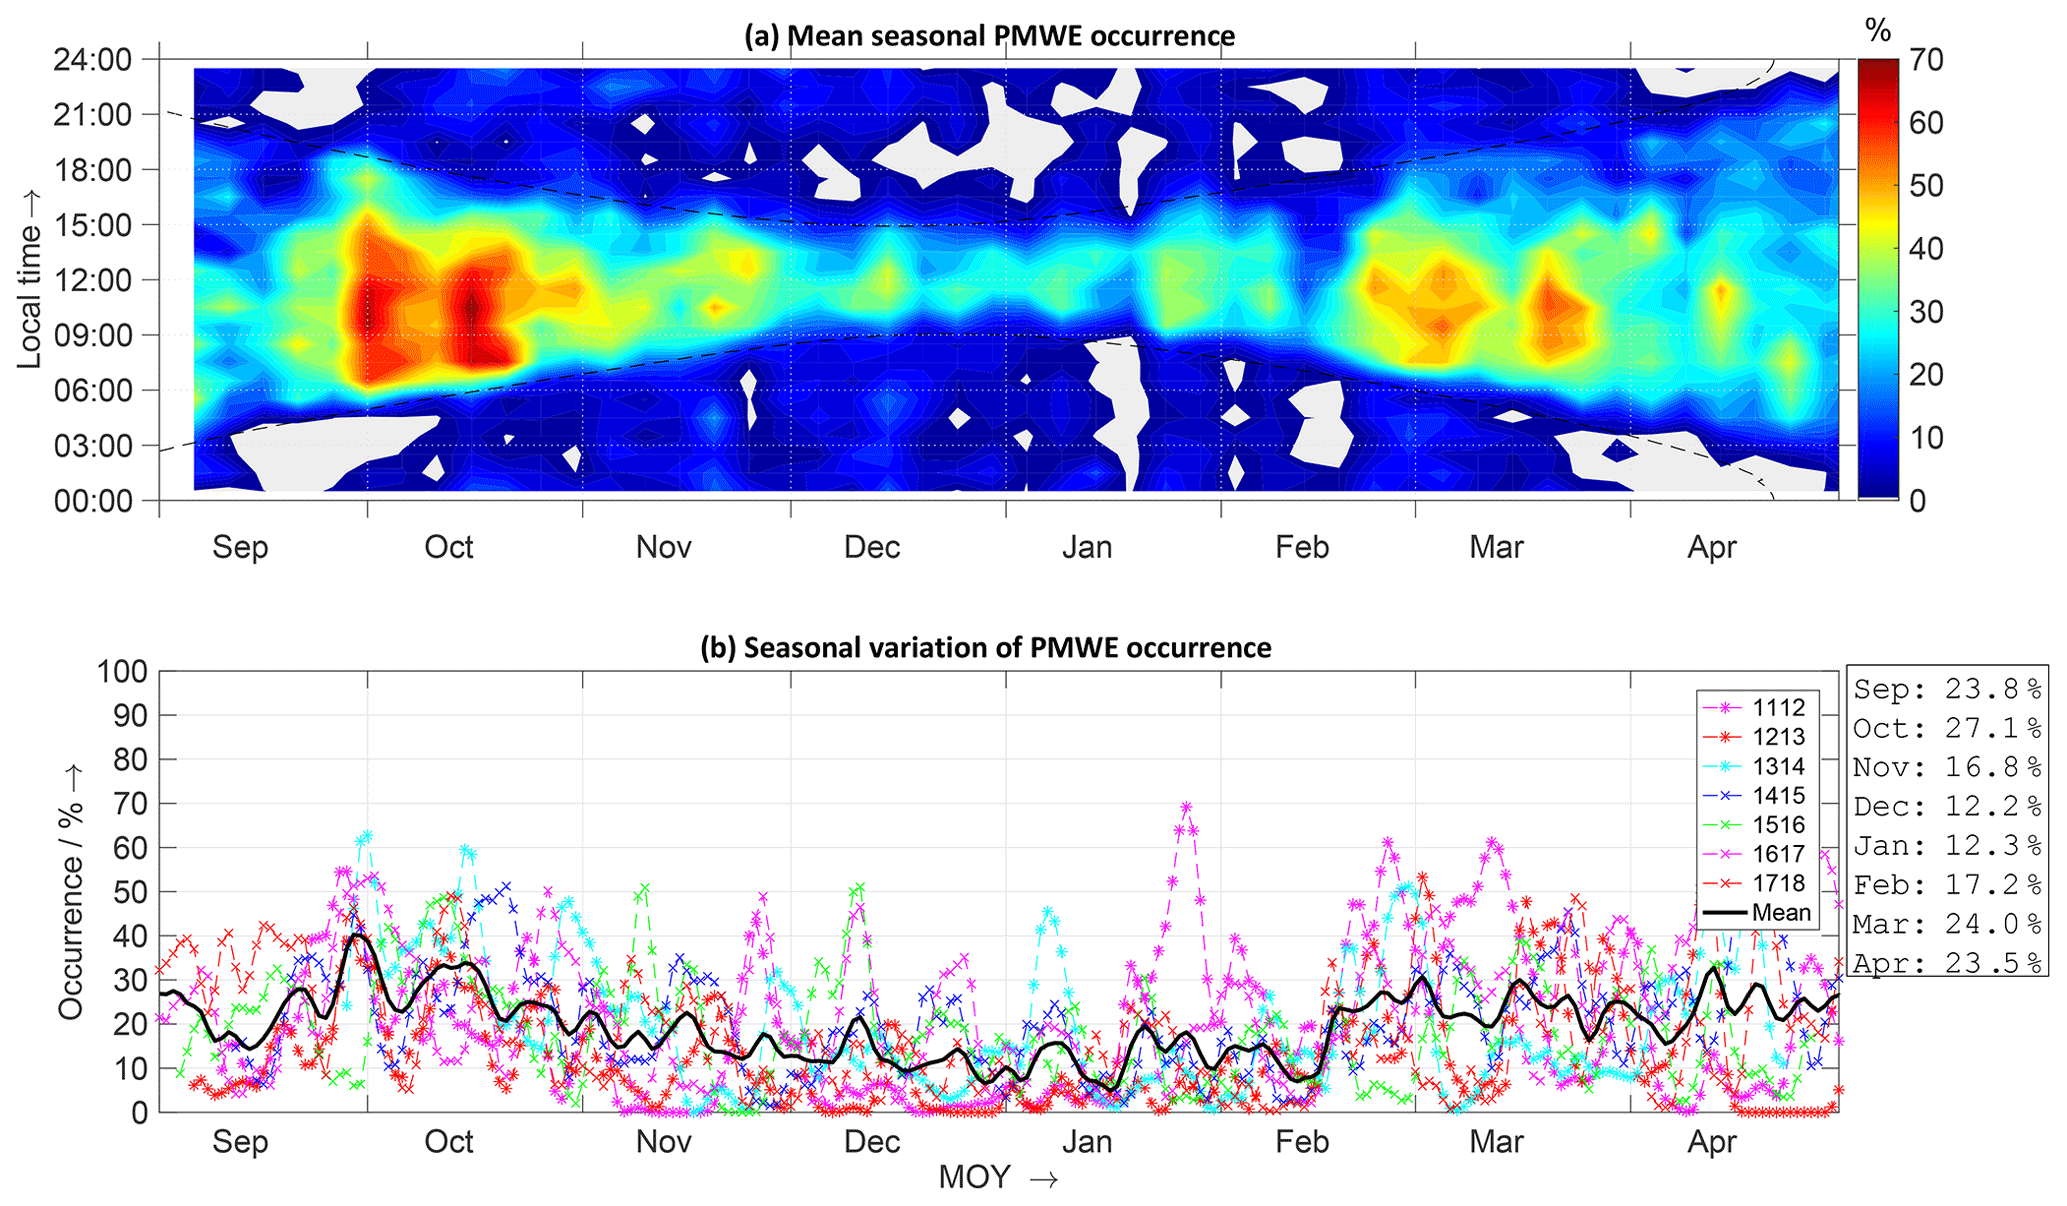
Figure 3PMWE occurrence rate dependent on season and local time (a) and seasonal variation of PMWE occurrence frequencies (b). The black dashed lines in (a) mark the solar zenith angle χ=98∘ separating daytime from nighttime conditions. The solid black line in the bottom panel depicts a running mean of the averaged occurrence frequencies of all seven seasons.
Since MAARSY's mesospheric observations show echoes below altitudes of 80 km also during the whole summer period (Latteck and Strelnikova, 2015) the name “winter echoes” or PMWE may only be considered as traditional and it does not reflect the real seasonal dependence of these low altitude echoes. In this sense it is hard to define a PMWE season like it is done for PMSE. However the months September to April is the period where these echoes occur most dominant. The mean seasonal occurrence rate is about 20.2 % with maxima in October and March/April as shown in Fig. 3. The top panel of Fig. 3 shows the mean diurnal occurrence over the winter season (September to April), whereas the bottom panel of this figure depicts the seasonal variation of the occurrence frequencies of all seven periods of observations overlaid by a smoothed mean value (solid black line). The individual occurrence rates of PMWE are based on 5 min averages of radar volume reflectivity m−1. More details about the analysis method is given in Latteck and Strelnikova (2015).
The diurnal occurrence of the season follows closely the solar zenith angle dependence (dashed lines in the top panel of Fig. 3) with a minimum around winter solstice, indicating a strong dependence on electron density. The maximum of the diurnal variation of PMWE occurrence around 11:15 LT as shown in Fig. 4 confirms the results by Latteck and Strelnikova (2015) using MAARSY and earlier observations based on ALWIN data (e.g. Zeller et al., 2006). PMWE observed by MAARSY occur mostly in an altitude range between 55–85 km with a maximum value of the altitude distribution at 67.8 km during daytime and 77.1 km during night time. The day/night differences can be explained by the reduction in electron density and by the increasing electron diffusivity below ∼75 km at night (Kirkwood, 2007) and by ionization effects from high energetic proton and electron precipitation connected with geomagnetic disturbances, and enhancements of solar X-ray fluxes (Zeller et al., 2006).

Figure 4Mean diurnal variation of PMWE occurrence frequencies derived from volume reflectivities m−1 obtained with MAARSY during seven winter periods of observations (2011/2012–2017/2018) at Andøya.
3.1 Overview
The PMWE research project initiated by the Leibniz Institute of Atmospheric Physics (IAP) involving collaboration between several international and national partners comprised two field campaigns at ASC in northern Norway (69∘ N, 16∘ E). The PMWE mission, which involves coordinated measurements with rockets and ground-based instruments, aims at precise measurements of physical quantities that are believed to be crucial for explaining the formation mechanism of PMWE. This includes turbulence, all constituents of ionospheric dusty plasma, i.e. electrons, ions, and meteor smoke particles (MSP), as well as the background state of MLT described by winds and temperatures.
The first of these two campaigns called PMWE1 took place between 10–18 April 2018. Taking into account the PMWE statistics as described in Sect. 2, the launch window was scheduled from 08:00 to 15:00 LT. The campaign involved the launching of two instrumented payloads named FIONA and DUSTIN on 13 and 18 April, respectively. MAARSY was operated to detect polar mesospheric winter echoes with multiple beam directions to detect favorable launch conditions. The Saura MF radar was operated throughout the entire campaign period probing the mesosphere with a multiple beam scan experiment to derive horizontal winds and electron density fields.
3.2 MAARSY: experiment configuration and observations
The Middle Atmosphere Alomar Radar System is a monostatic radar located on Andøya close to the Andøya Space Center. The radar is designed for atmospheric studies from the troposphere to the lower thermosphere, especially for the investigation of horizontal structures of mesospheric echoes. Therefore the radar beam can be steered from pulse-to-pulse to any horizontal direction with off-zenith angles down to 36∘. On reception there are 16 complex channels available. One of these channels receives from all 433 antenna elements, while the other 15 can be selected to receive from different portions of the antenna. A detailed description of the system is given by Latteck et al. (2012b).
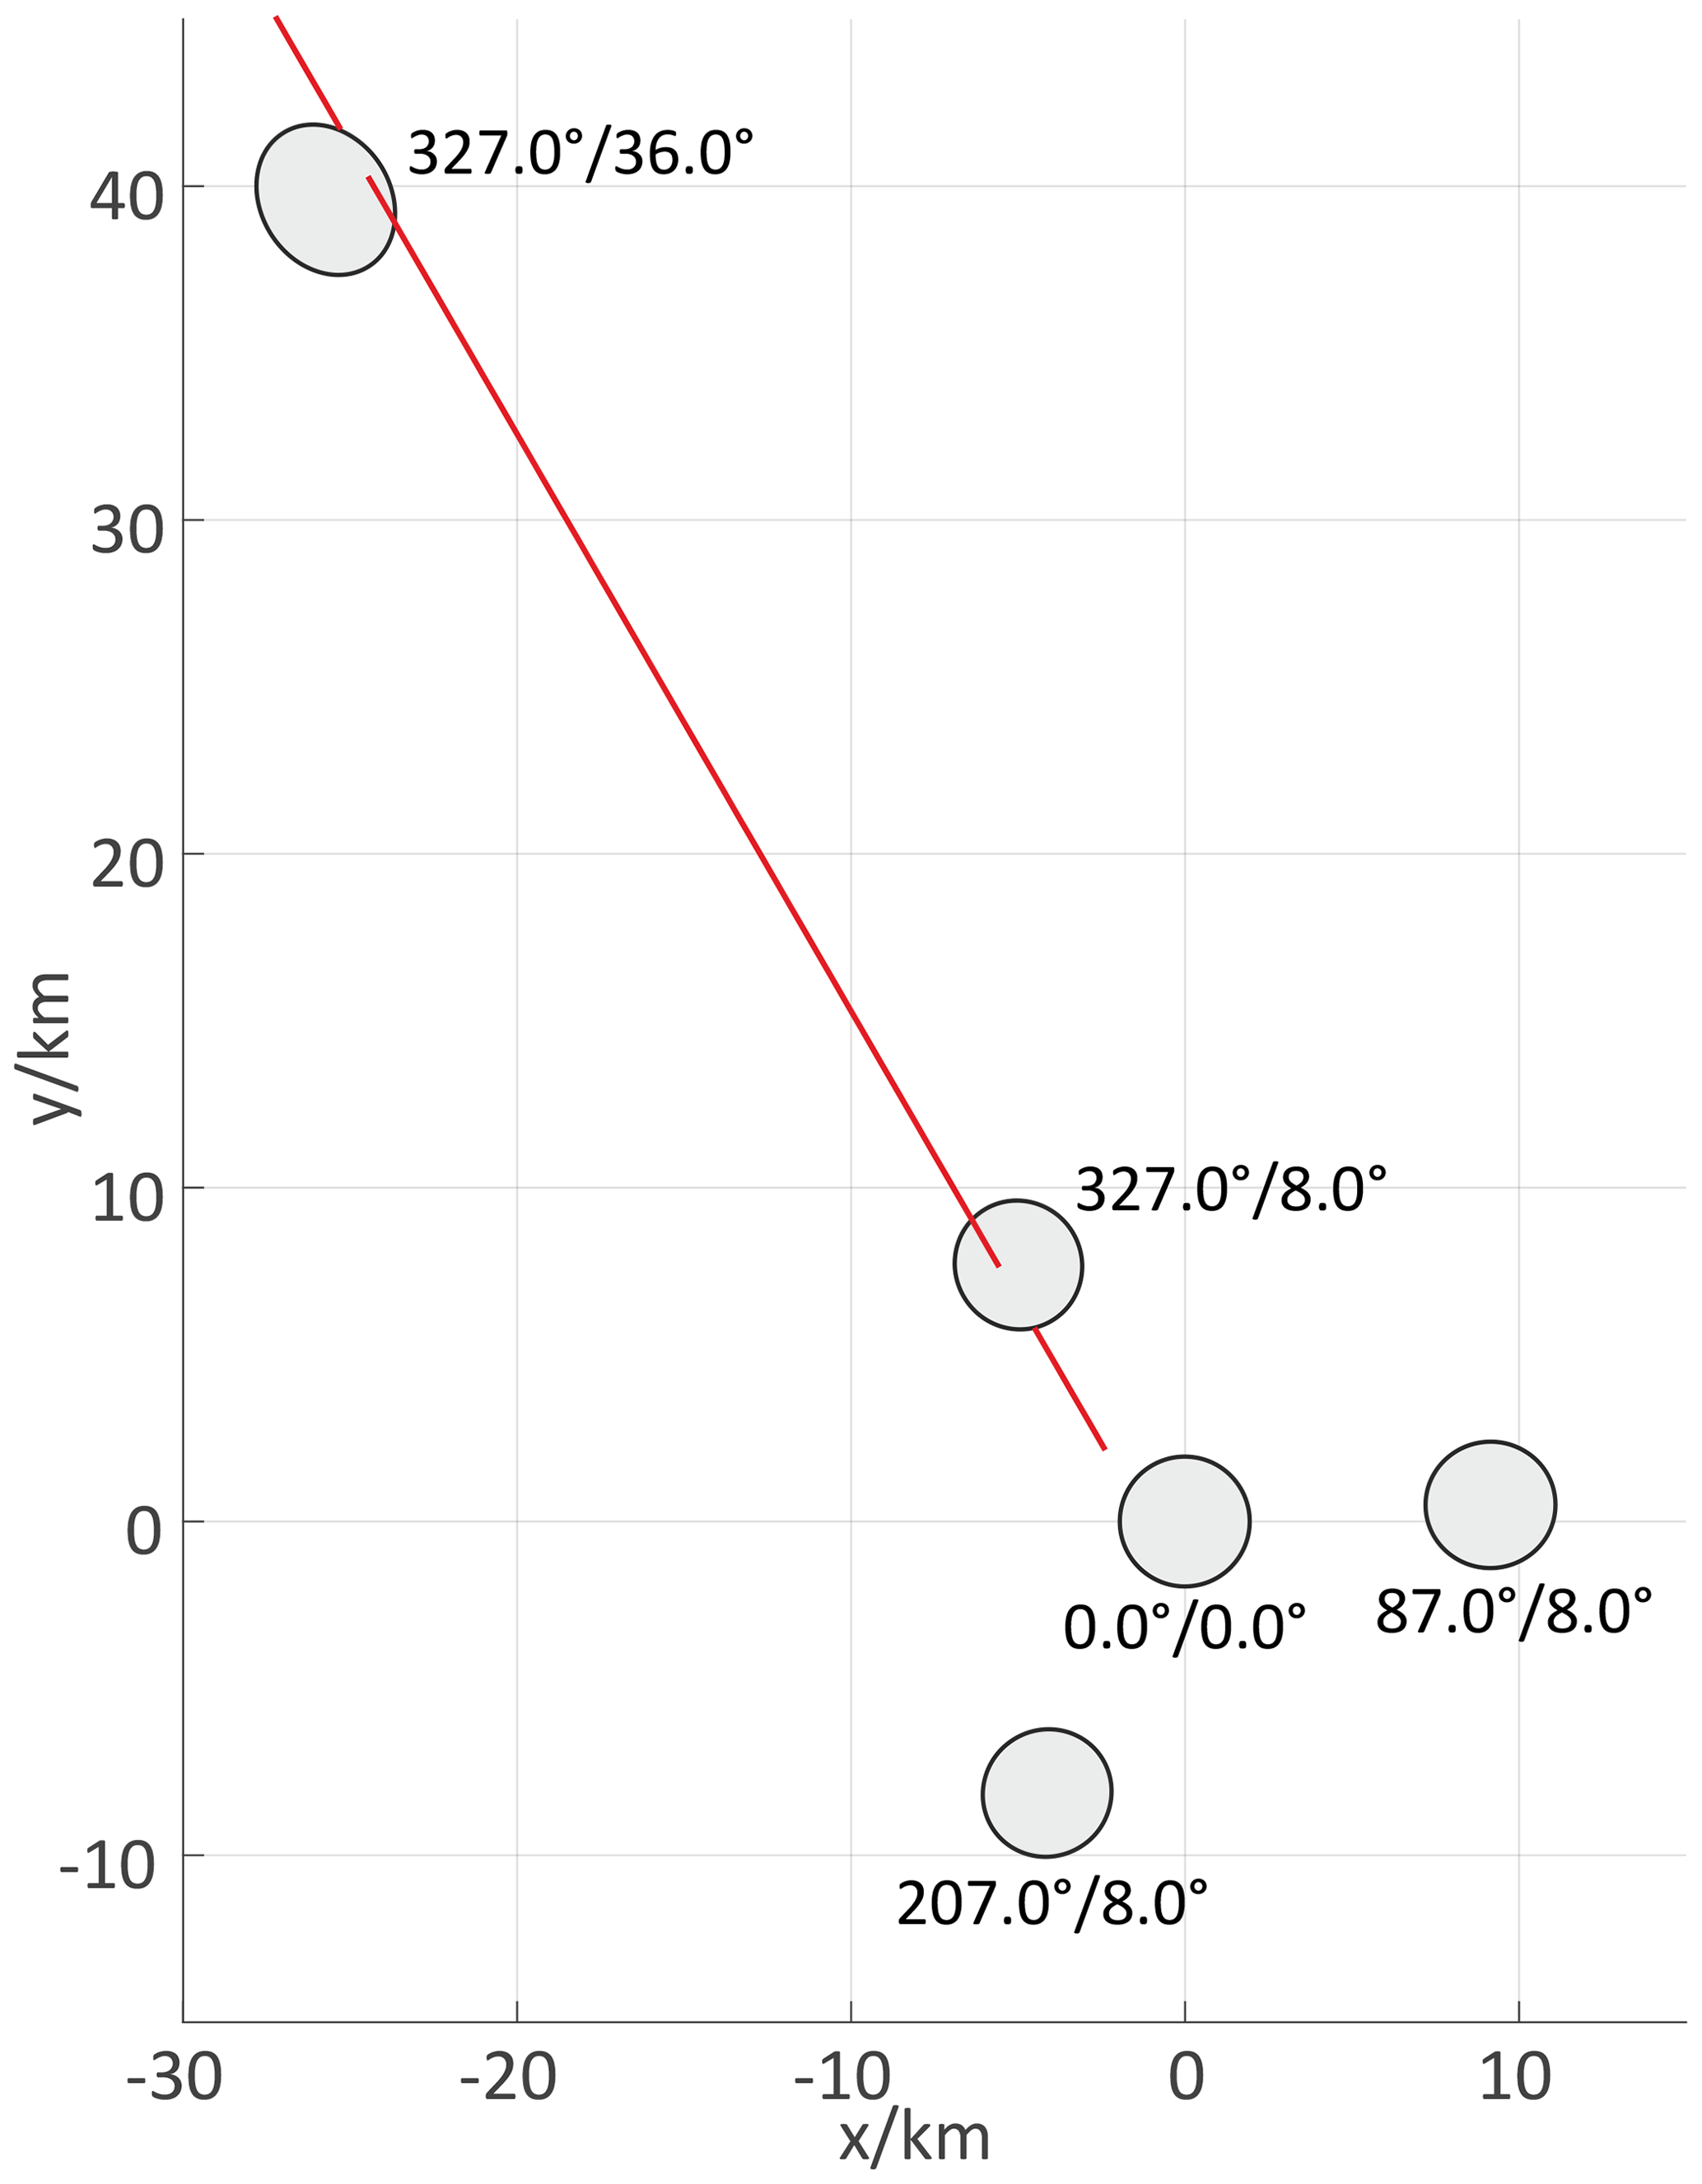
Figure 5Simplified 3 dB antenna pattern at 65 km altitude for the MAARSY beam configuration as used during the PMSE1 campaign. The red line depicts the horizontal projection of the planned rocket trajectory.
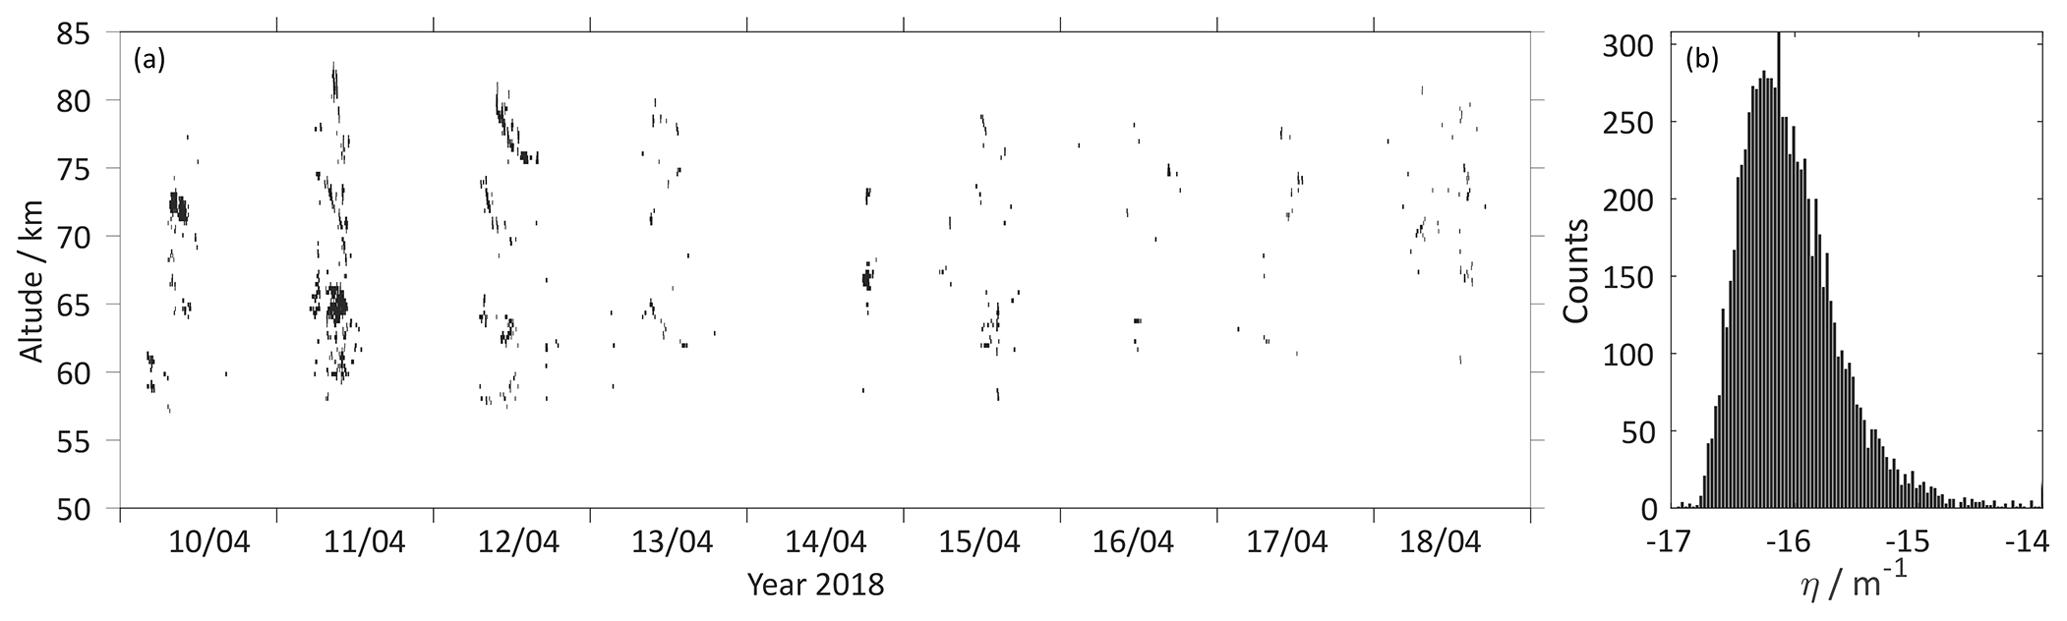
Figure 6Height-time plot of PMWE occurrence based on observations using the vertical beam of MAARSY during the period 10–18 April 2018. Panel (b) shows the distribution of the corresponding PMWE volume reflectivity during the observation period.
MAARSY was used to detect mesospheric echoes which, if present, allow to derive geophysical parameters, such as winds and turbulence energy dissipation rates (e.g. Rapp et al., 2011; Stober et al., 2012; Latteck et al., 2012a). For the campaign period MAARSY was operated in a five beam mode including a vertical beam, two beam positions at 8 and 36∘ off-zenith pointing towards the predicted rocket trajectory and two horizontally distributed beam positions across from this direction at 8∘ off-zenith. Figure 5 shows the beam configuration as illuminated areas at 65 km. The beams pointing towards the predicted rocket trajectory allowed real common volume measurements of radar parameter and rocket data during upleg and downleg, whereas the beams pointing to 8∘ off-zenith and vertical could be used for horizontal wind estimation. The beam positions were changed at every second radar pulse since a 16 bit complementary code was used. Data were acquired with a pulse repetition frequency of 1.25 kHz and 2 coherent integrations resulting in Nyquist frequency of 31.25 Hz corresponding to 87.6 m s−1. The range from 50.1–114.0 km was covered with a sampling resolution of 300 m.
The campaign period started with a moderate occurrence of PMWE on 10, 11 and 12 April which decreased towards the end of the campaign as indicated by the black patches in the left panel of Fig. 6. The signal strength of the observed echoes as shown by the distribution of PMWE volume reflectivity η during the observation period (right panel of Fig. 6) varied between 10−17 and 10−15 m−1 with only a few values m−1. The reduced minimum detection by about 9 dB compared to the minimum detection as shown in Fig. 2 is caused by the differences in the number of additional coherent integrations in the data analysis which had to be reduced by a factor of 8 compared to a single beam experiment in order to guarantee a Nyquist frequency of about 15 Hz (42 m s−1).
3.3 Saura MF radar: experiment configuration, data analysis and observations
The Saura MF radar operated at a frequency of 3.17 MHz and is located approximately 20 km south of the Andøya Space Center. The radar is designed and used to measure winds and electron densities at polar latitudes within the D region from approximately 60 to 95 km altitude (Singer et al., 2008). Due to the low frequency and thus sufficient amount of electron number density allowing partial reflections the Saura MF radar can conduct observations throughout the year. During periods of enhanced ionization in the D region the covered altitude range can be extended down to 50 km.
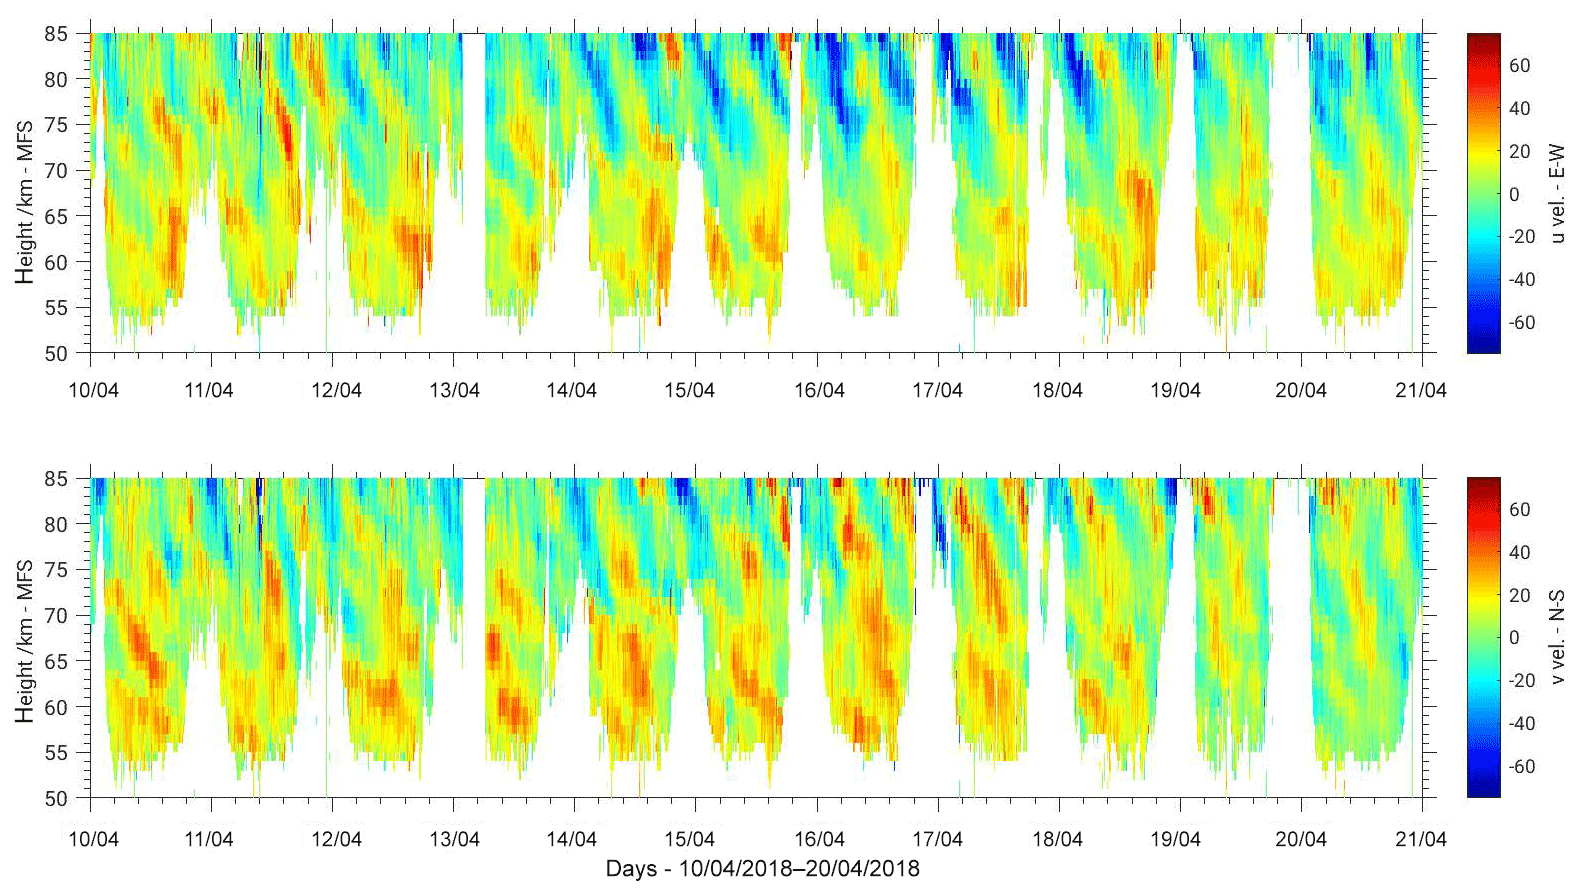
Figure 7Horizontal wind measured by the Saura MF radar during the PMWE1 rocket campaign in April 2018.
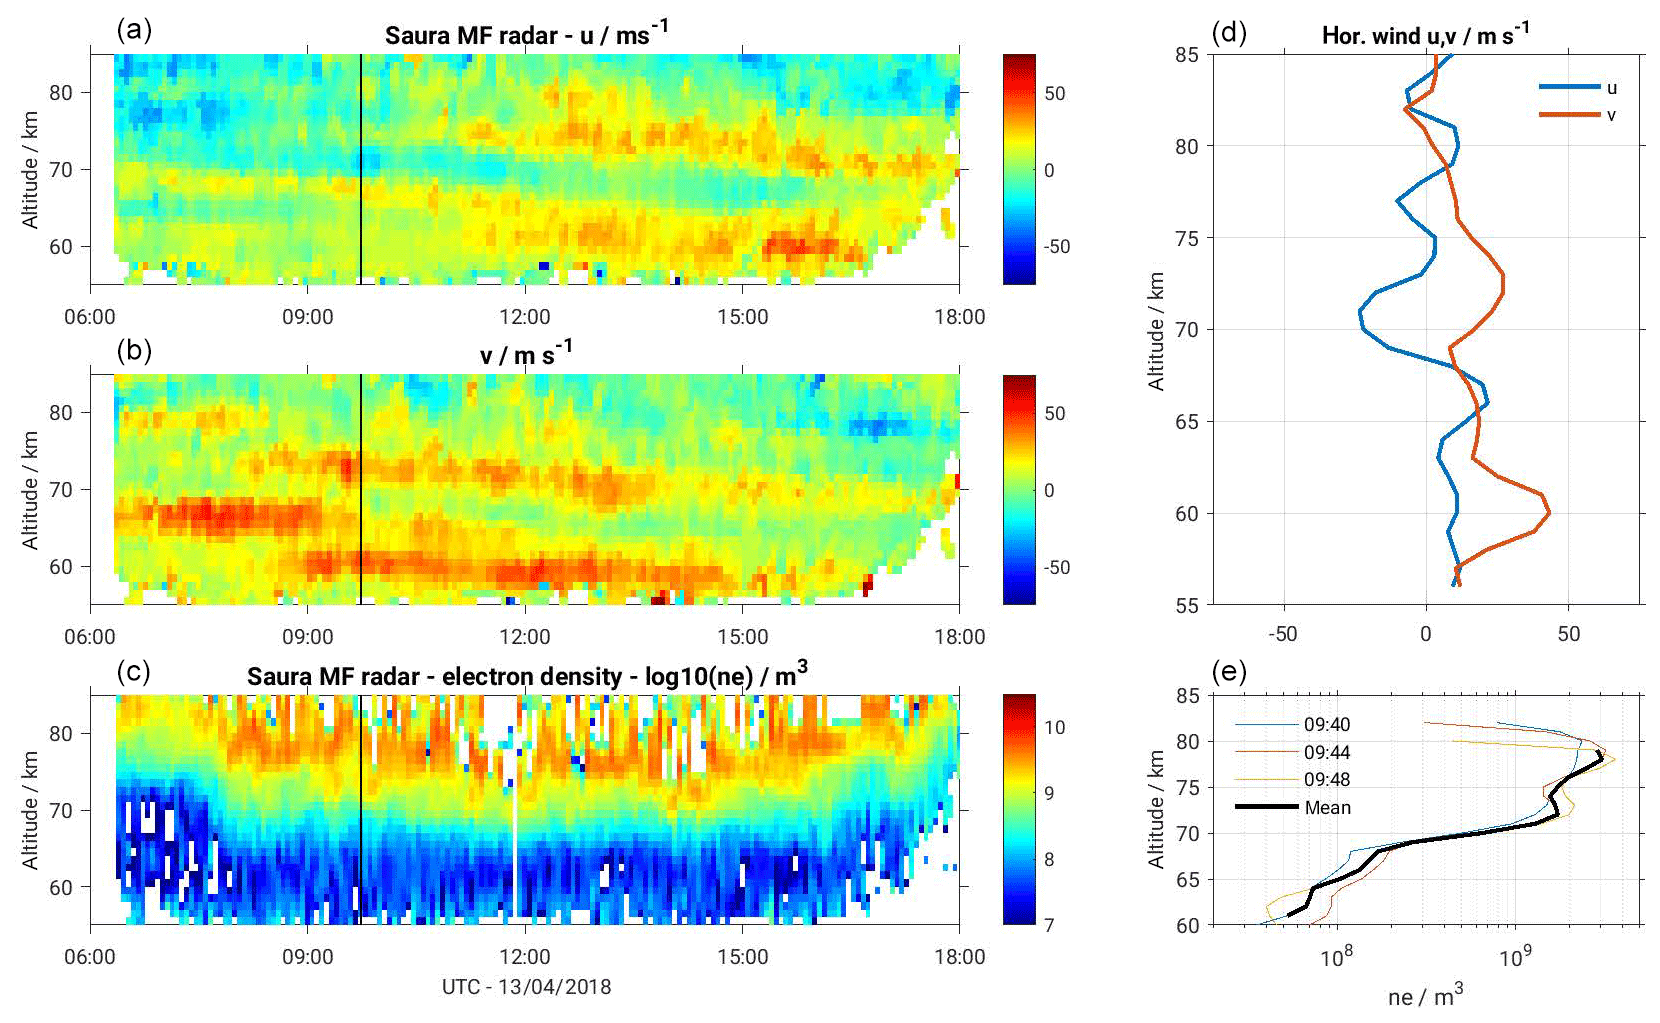
Figure 8(a, b, c) Observed wind structure (u,v) for 13 April 2018, as well as estimated electron densities. The black lines mark the time of the launch at 09:44 UT. (d, e) Individual profiles for both, wind and electron density.
For the PMWE1 campaign the Saura MF radar was set into a dedicated operating mode to continuously monitor the middle atmosphere for parameters like the wind structure and electron number density. For this purpose the radar was nearly exclusively operated in a five-beam scanning experiment throughout the entire month, measuring in vertical and four oblique beam directions. For all soundings both magneto-ionic components, ordinary (O) and extraordinary (X) modes were probed and analyzed using a 1 km range resolution on transmission and reception. The experiment runtime was set to 220 s, using 100 and 30 Hz pulse repetition frequency for day and night time, respectively. To increase the average output power and gain some immunity against interferences a 4 bit complementary code was used, which requires two coherent integrations. After all, for each experiment run during daytime 1100 data points per beam pointing direction and polarization were collected, resulting in a Nyquist frequency of 2.5 Hz.
The 4 min raw data were analyzed for echo power and Doppler shift applying the Doppler-Beam-Swinging method (DBS, Woodman and Guillen, 1974) to derive the horizontal and vertical wind field. The minimum temporal wind resolution corresponds to the experiment length, however, more reliable and typically used are 12 min. The DBS wind results for the period from 10 to 20 April are shown in Fig. 7. A detailed view for both rocket launches is shown in Figs. 8 and 11 in Sect. 3.4 and 3.5, respectively. Throughout the shown period tidal structures are clearly visible covering the entire range from 85 km down to partially 50 km altitude. Interestingly, the amplitudes of the tides are intensified above 75 km between 14 and 18 April for both horizontal wind components. Vertical winds have also been estimated, but do not show any interesting structure, besides a typical variation between ±1 m s−1.

Figure 9Height time intensity plots of signal-to-noise ratio obtained from MAARSY multi-beam observations on 13 April 2018 around the launch time of the the first rocket.
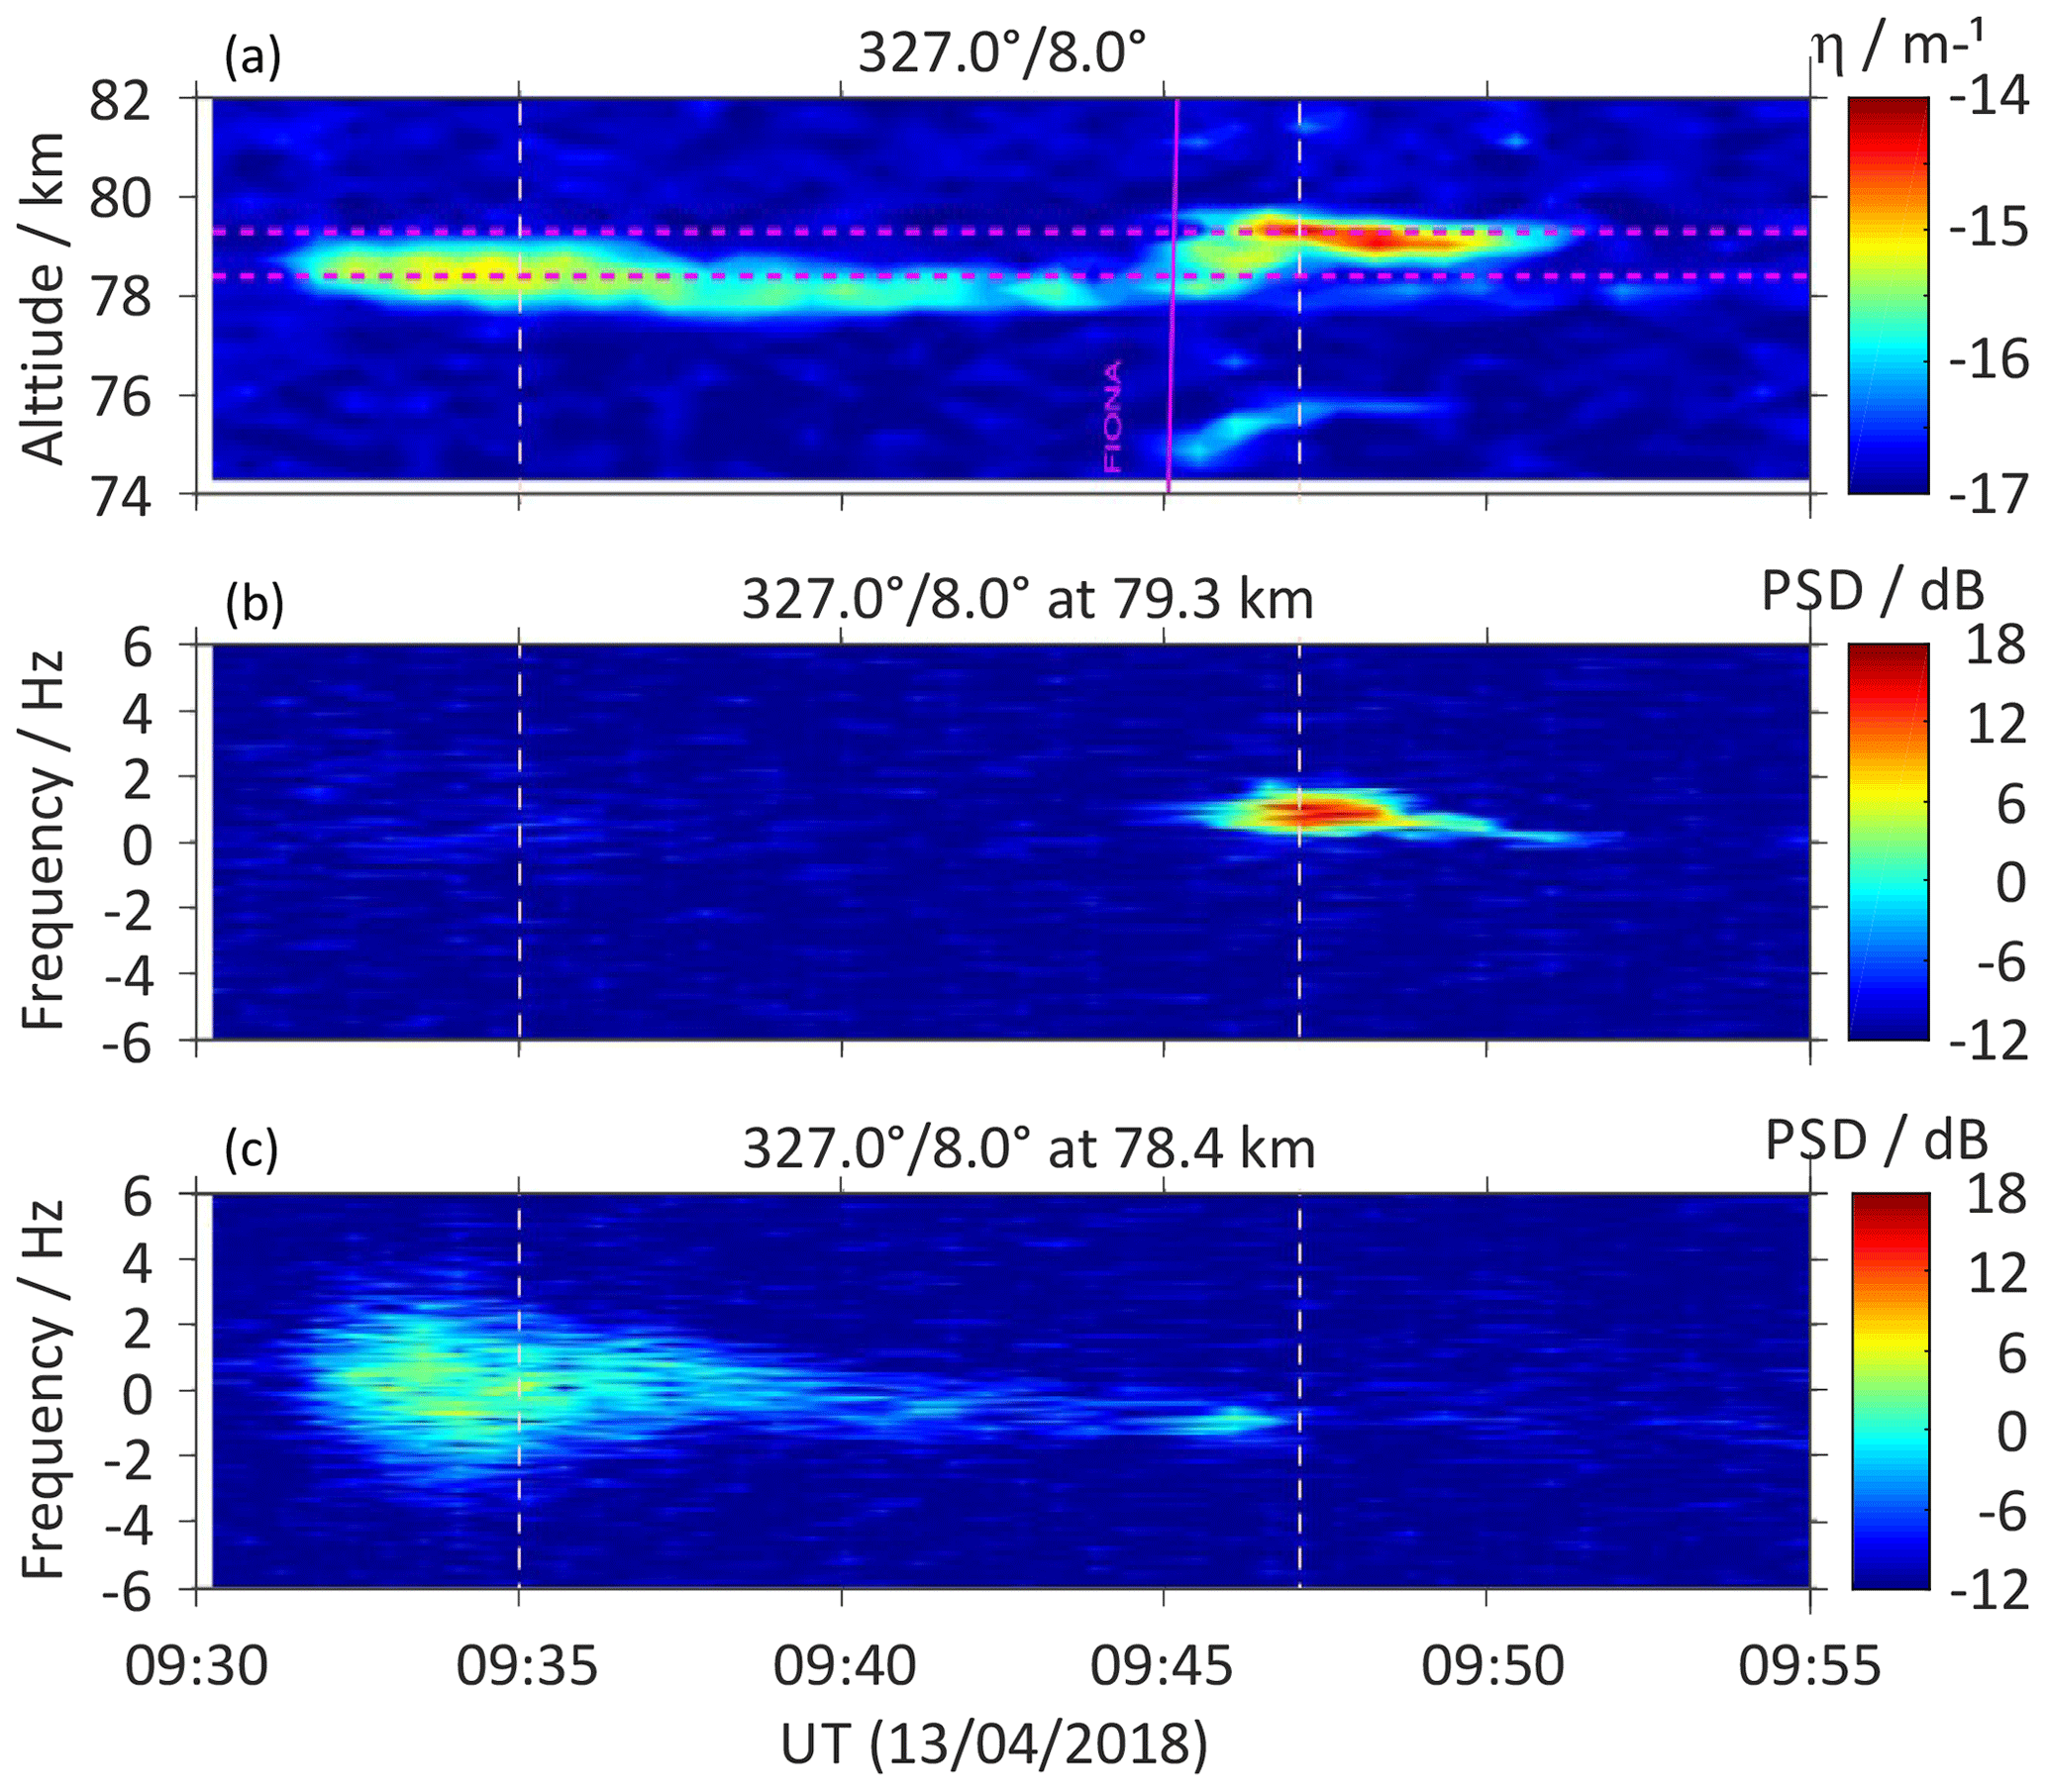
Figure 10Height time intensity plot of radar volume reflectivty (a) obtained by the 327∘/8∘ MAARSY beam pointing along the rocket trajectory during upleg on 13 April 2018 around the launch time of the the first rocket. Panels (b) and (c) show spectograms for selected altitudes.
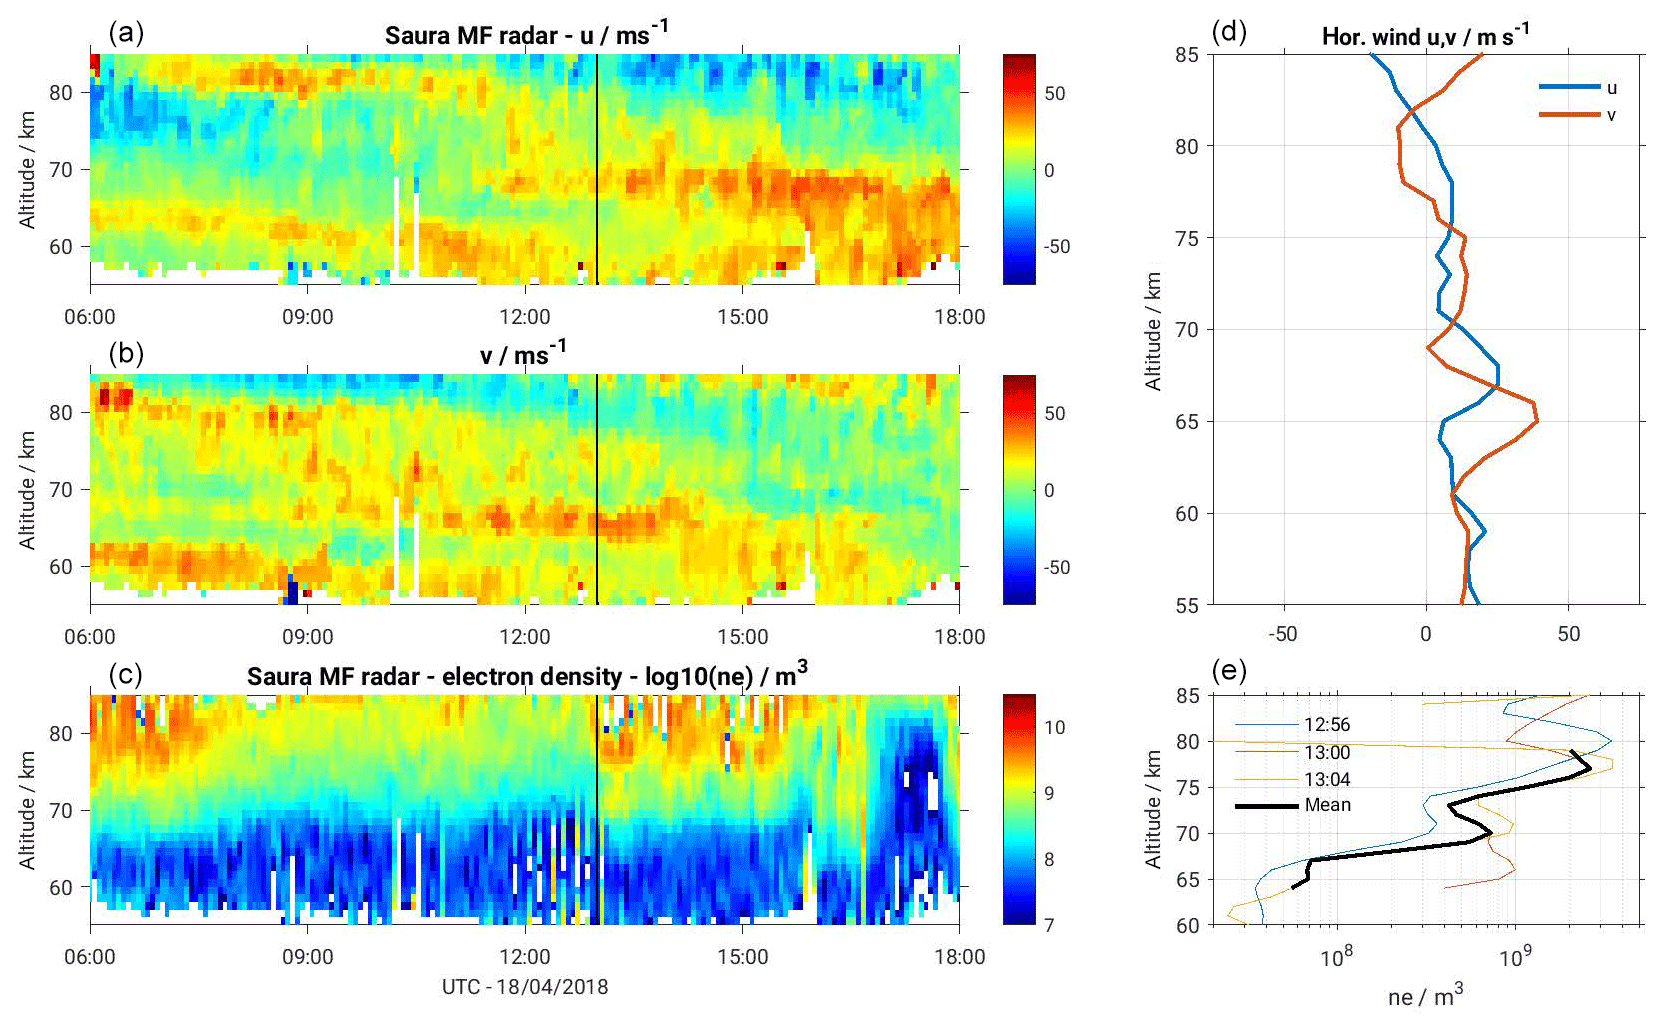
Figure 11Results of the wind and electron density measurements, similar to Fig. 8 for the day of the second launch on 18 April 2018, 13:00 UT.
Additionally, the Imaging Doppler Interferometry method (IDI, see e.g. Adams et al., 1986; Roper and Brosnahan, 1997) was applied allowing for multiple rather than just one dominant scattering structure in the case of DBS to derive the wind field with 4 min resolution. Averaging (integration) techniques for the raw data samples as well as smoothing of both wind methods data sets were applied to suppress inconsistent data. For the altitudes of 60 to 80 km the wind results of both methods are widely consistent.
Renkwitz et al. (2018) demonstrated the beneficial combination of both methods to maximize the coverage and to derive more reliable estimates especially for the upper altitudes. As for the PMWE1 campaign altitudes below 80 km are investigated, the combination of both methods did not exhibit any improvement and we therefore remain with DBS including the statistically corrected scattering position. For rather quiet geomagnetic conditions DBS generally outperforms IDI at the lowermost altitudes as it makes use of 28 instead of only 4 antennas on reception and thus allowing for better signal-to-noise ratio. The only exceptions of this reasoning are very intense precipitation events causing drastically enhanced electron densities. This, however, is not the case in the examples shown and for the whole period of the PMWE1 campaign in general.
Interferometric analysis of the scattering structures, like the dominant scattering position, were possible as in total eight antennas are connected to individual receivers. This capability was used to verify the beam pointing directions as well as to derive the effective scattering positions to improve the reliability of the wind estimations (see Renkwitz et al., 2018).
Besides wind measurements the Saura MF radar was also used to estimate the electron number density and with this the ionization state of the middle atmosphere. For this, differential phase and differential amplitude experiments (DPE, DAE) are utilized analyzing the relation of the ordinary to the extraordinary modes (O-X) for a given time and altitude range (see e.g. Singer et al., 2005).
Even though the entire antenna array is used for these measurements on transmission and reception the contribution of the radiation pattern side lobes can not be ignored. This is especially true for situations when highly efficient scatters are off the nominal beam pointing direction (vertical), but are still within the field of view of the radar and near the side lobe positions. Such situations occur rather frequently and oblique scatter will be superimposed with the vertical echo. Even if regional atmospheric homogeneity is considered, the oblique echoes for the same altitude have a different range and will therefore be smeared into higher vertical altitudes. To overcome this, interferometric methods were used to estimate the scattering position of the individual echoes. Smoothing of the raw data done on the basis of measured correlation times for every altitude was applied in order to get reliable position estimates. The smoothing times are typically in the order of a few seconds for the upper heights, while smoothing by up to a minute might be necessary for the lowermost altitudes. Data were only accepted for zenith angles less than 7.5∘, which corresponds to the beam width of the antenna array. As sometimes the observed volume is not sufficiently filled with scatterers the time series is typically split into four parts, which are individually analyzed and the non-reliable parts in terms of e.g. phase progression are excluded for the final processing. Finally, equivalent to the wind measurements, a resolution of 4 min is achieved at best.
3.4 Radar observations during Salvo 1 (FIONA)
The Saura wind measurements for 13 April 2018 show clear tidal structures for both horizontal wind components (see Fig. 8). Around 07:00 UT the altitudinal coverage starts to extend to lower altitudes, below 60 km, due to the increasing solar zenith angle. At about 08:00 UT first consistent echoes from below 55 km are seen allowing wind and electron density measurements. From that time on a significant increase of electron density is seen above 70 km altitude throughout almost 15:00 UT as can be seen in the lower panels of Fig. 8.
The PMWE activity started around 08:00 UT at an altitude of about 76 km as detected by MAARSY in the vertical beam. Very weak signatures of PMWE were also detected in the 207∘/8∘ beam around that time. The further PMSE detections by MAARSY are shown in Fig. 9 by height time intensity plots of SNR obtained with all five beams during the period 09:00–11:00 UT. A very thin layer started to develop in 65 km altitude around 08:15 UT and lasted at that altitude above and south of the MAARSY location until 10:00 UT. A second thin layer at 71 km altitude was detected in the vertical and in all three 8∘ oblique directions between 09:10 and 09:25 UT indicating a horizontal expansion of about 15 km diameter of this structure. At the end of that period a third layer at about 79 km altitude was detected in the 327∘/36∘ beam pointing along the direction of the planned rocket trajectory. This layer was detected in the 327∘/8∘ beam, the vertical beam and the southward and eastward pointing 8∘ beams with a respective delay of a few minutes. The sounding rocket launched at 09:44 UT hit the decaying part of the PMWE structure at 79 km altitude as shown by the echo of the rocket payload detected by MAARSY's 327∘/8∘ beam. The payload was also detected during downleg by the 327∘/36∘ beam as shown in the third panel of Fig. 9.
Electron densities of more than 109 el m−3 were observed by the Saura MF radar above 70 km around the launch at 09:44 UT, reaching the detectable limit at almost 80 km altitude. Wind profiles derived from the MF radar are depicted in the upper right panel of Fig. 8 for a period of 8 min around the launch time. For the PMWE observed at roughly 79 km slightly positive horizontal wind components were measured above Saura, indicating a weak wind towards North-East.
Interestingly, a strong enhancement of radar signal return was detected by MAARSY's beam (327∘/8∘) pointing along the rocket trajectory during upleg immediately after the payload had crossed the PMWE layer at 78.1 km. This new structure lasted for about 5 min at an altitude of about 79 km as shown in the top panel of Fig. 10. The bottom and middle panels of Fig. 10 show spectrograms of the received MAARSY signal obtained at selected altitudes of 78.4 and 79.3 km corresponding to the echo structure before and after the rocket launch, respectively. The echo detected at 79 km is characterized by a very narrow spectral extent (σf∼ 0.3 Hz) and a much stronger intensity of about m−1 compared to the echo observed before the payload's passage at e.g. 09:35 UT (σf∼1.5 Hz), m−1) at that altitude region.
3.5 Radar observations during Salvo 2 (DUSTIN)
The day of the second launch, 18 April 2018, was characterized by rather unstable geomagnetic conditions. Results of wind and electron density measurements obtained from the Saura MF radar for this day are summarized in Fig. 11. The horizontal winds again show consistent structures related to tides for the entire altitudinal coverage. However, the electron densities show a large variability throughout the day. Enhanced ionization was already seen for the morning hours, but weakening from 08:00 UT.
MAARSY did detected some weak PMWE structures between 67 and 70 km in the early morning hours between 06:00 and 08:00 and around 09:30 UT but no echoes before and during the launch of the second sounding rocket which was scheduled for 13:00 UT. Right at the launch time the electron densities meassured by the Saura MF radar (bottom left panel of Fig. 11) increased to 109 el m−3 above 70 km growing towards 13:15 UT.
As with the first rocket launch on 13 April 2018, this time a radar echo could be observed in MAARSY's 327∘/8∘ oblique beam between 77 and 79 km after the payload had passed this altitude range. The echo was structured in two layers, one around 77.8 km lasting for about 12 min and a second one at about 79.0 km lasting for about 2 min only (top panel of Fig. 12). Like the echoes that were observed after the first rocket flight, these two are characterized by a very narrow spectral extend (σf∼0.3 Hz) and a strong intensity ( m−1) as shown in the spectrograms of Fig. 12.
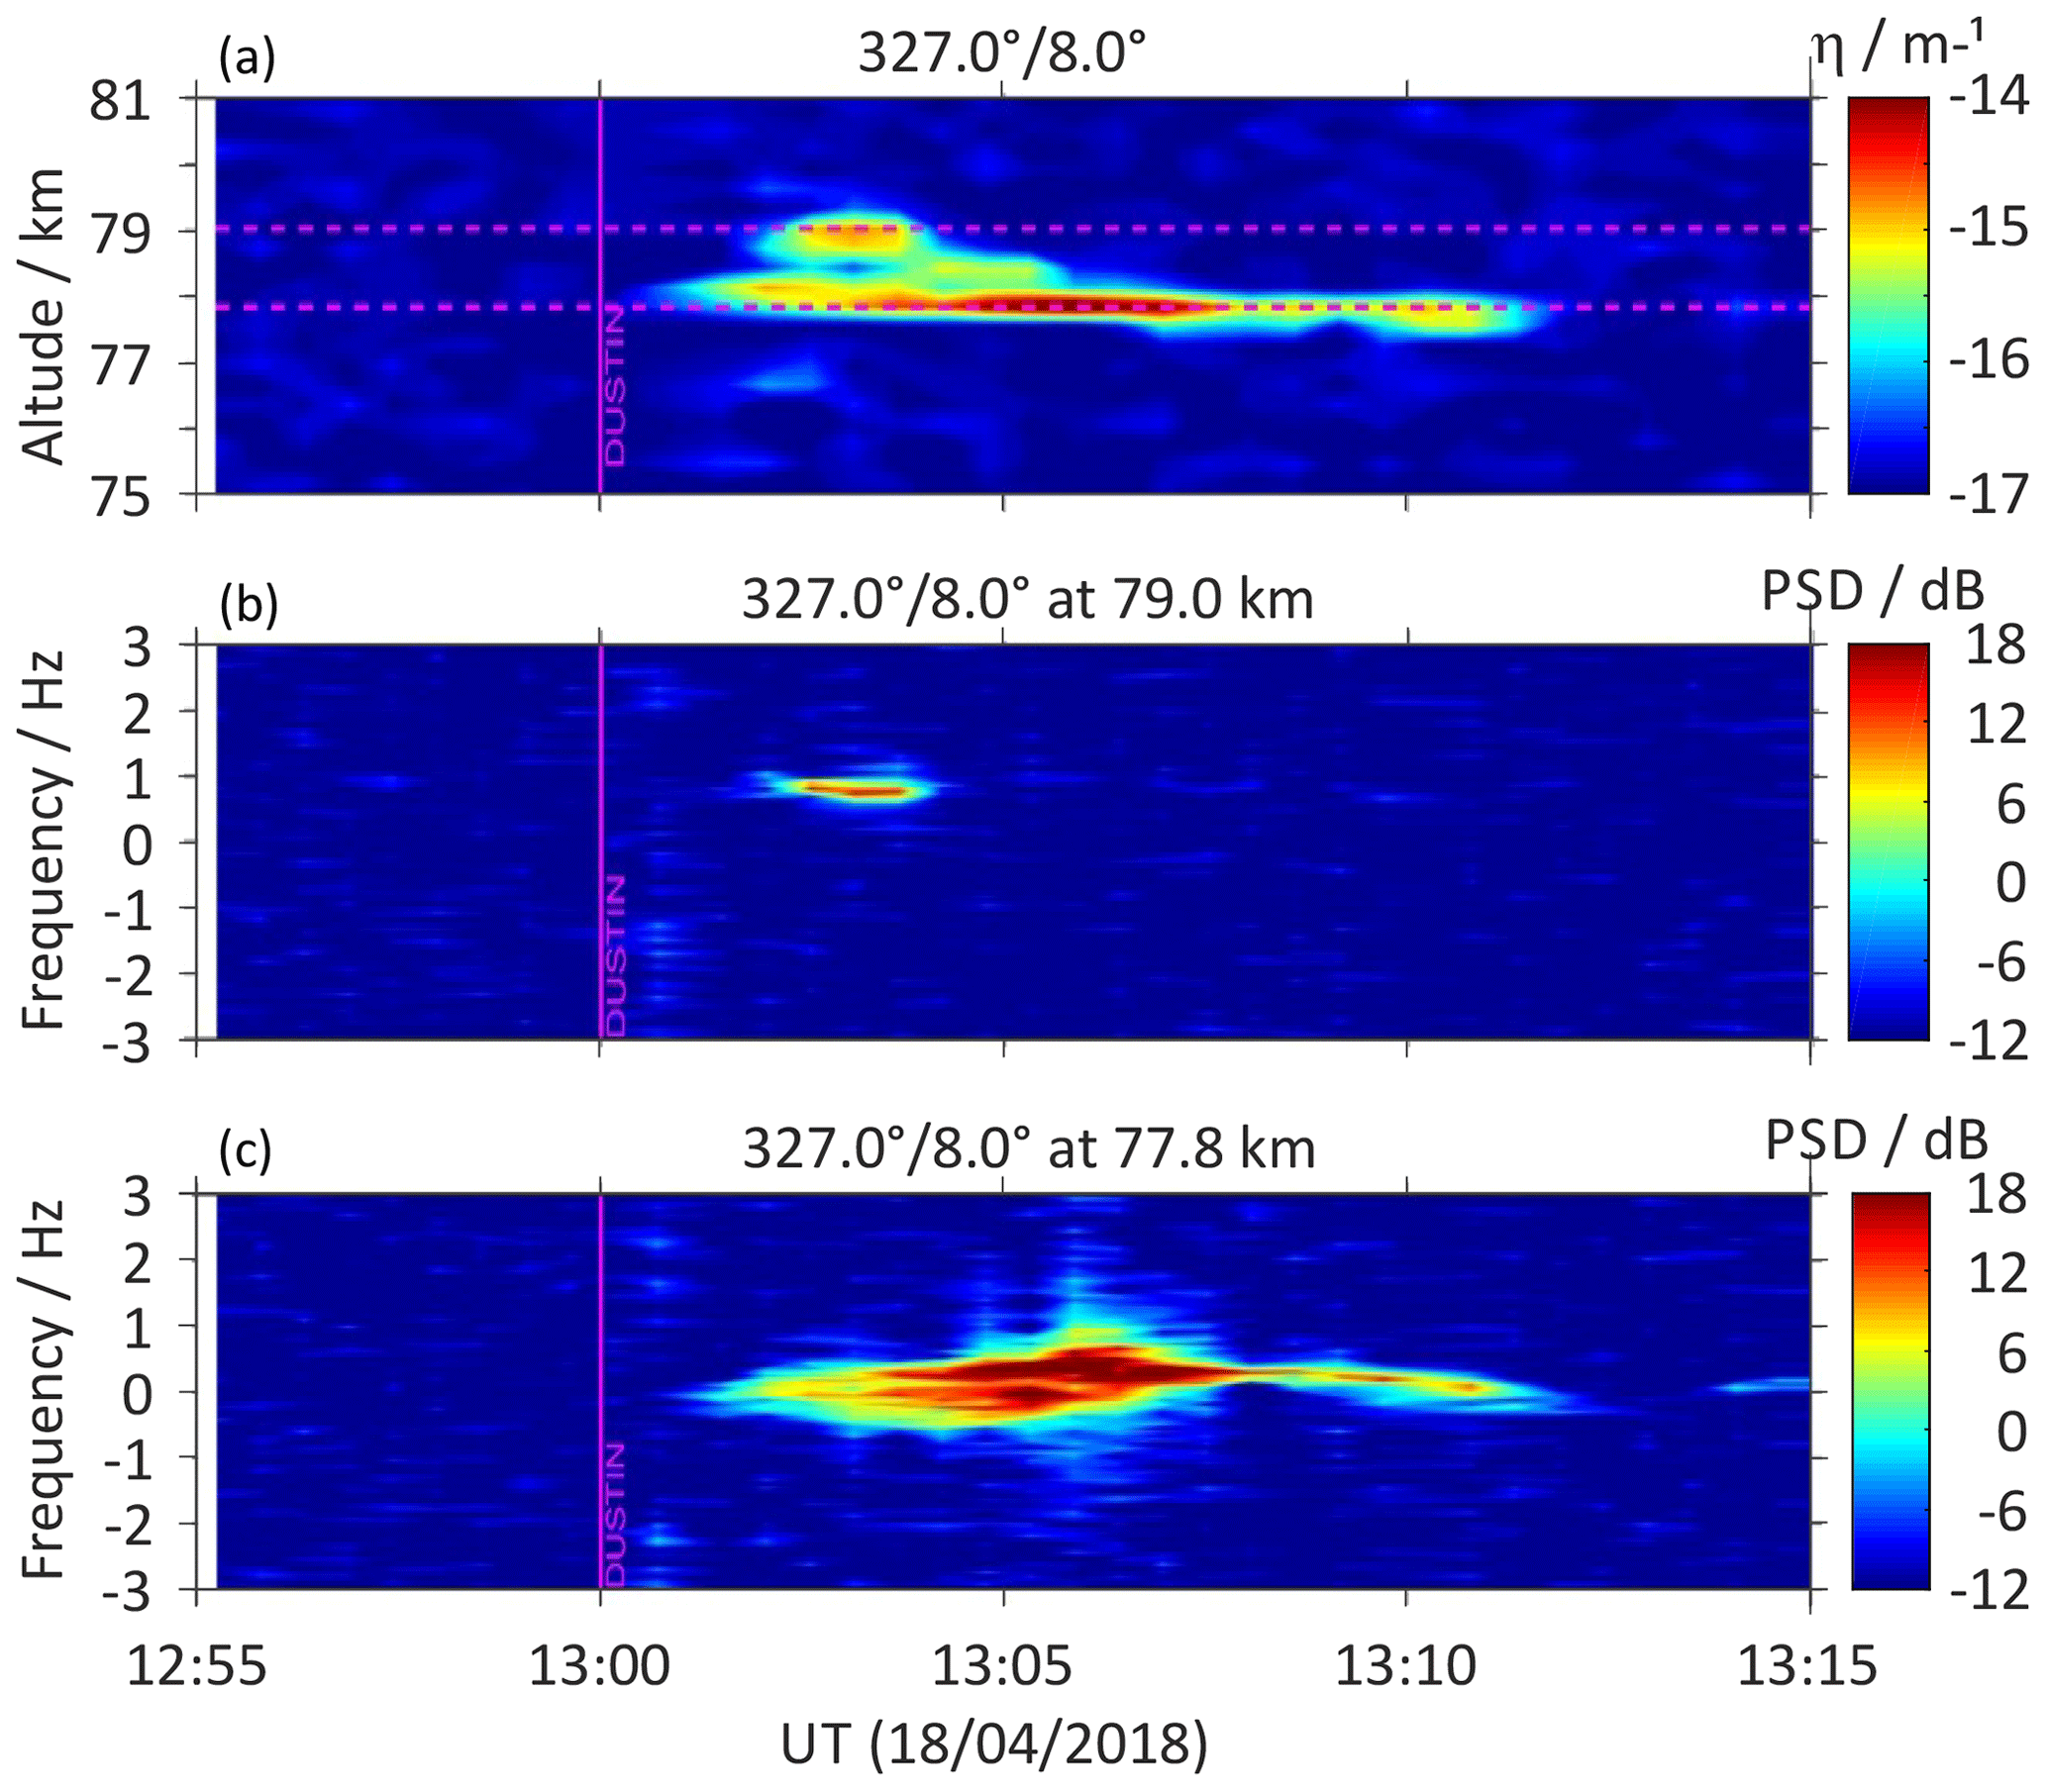
Figure 12Height time intensity plot of radar volume reflectivty (a) obtained by the 327∘/8∘ MAARSY beam pointing along the rocket trajectory during upleg on 18 April 2018 around the launch time of the the second rocket. Panels (b) and (c) show spectograms for selected altitudes.
A weak and thin PMWE layer comparable to the morning observations was detected in all 8∘ and the vertical beam of MAARSY at 67 km about 15 min after the rocket launch. For this height a horizontal wind towards northeast to east as well as steeply rising electron densities by one order of magnitude within 3 km altitude was measured by the Saura radar. The ionization continued to be enhanced but rather unstable until almost 16:00 UT. Nevertheless several other weak PMWE layers were observed by MAARSY between 72 and 75 km later during this period as shown in Fig. 13.
4.1 Spectral width analysis of radar data
As observations with the Saura MF radar permit a rather continuous monitoring of the ionized middle atmosphere, turbulence estimation from the spectral widths of the received signal are also of great interest besides wind and electron density measurements.
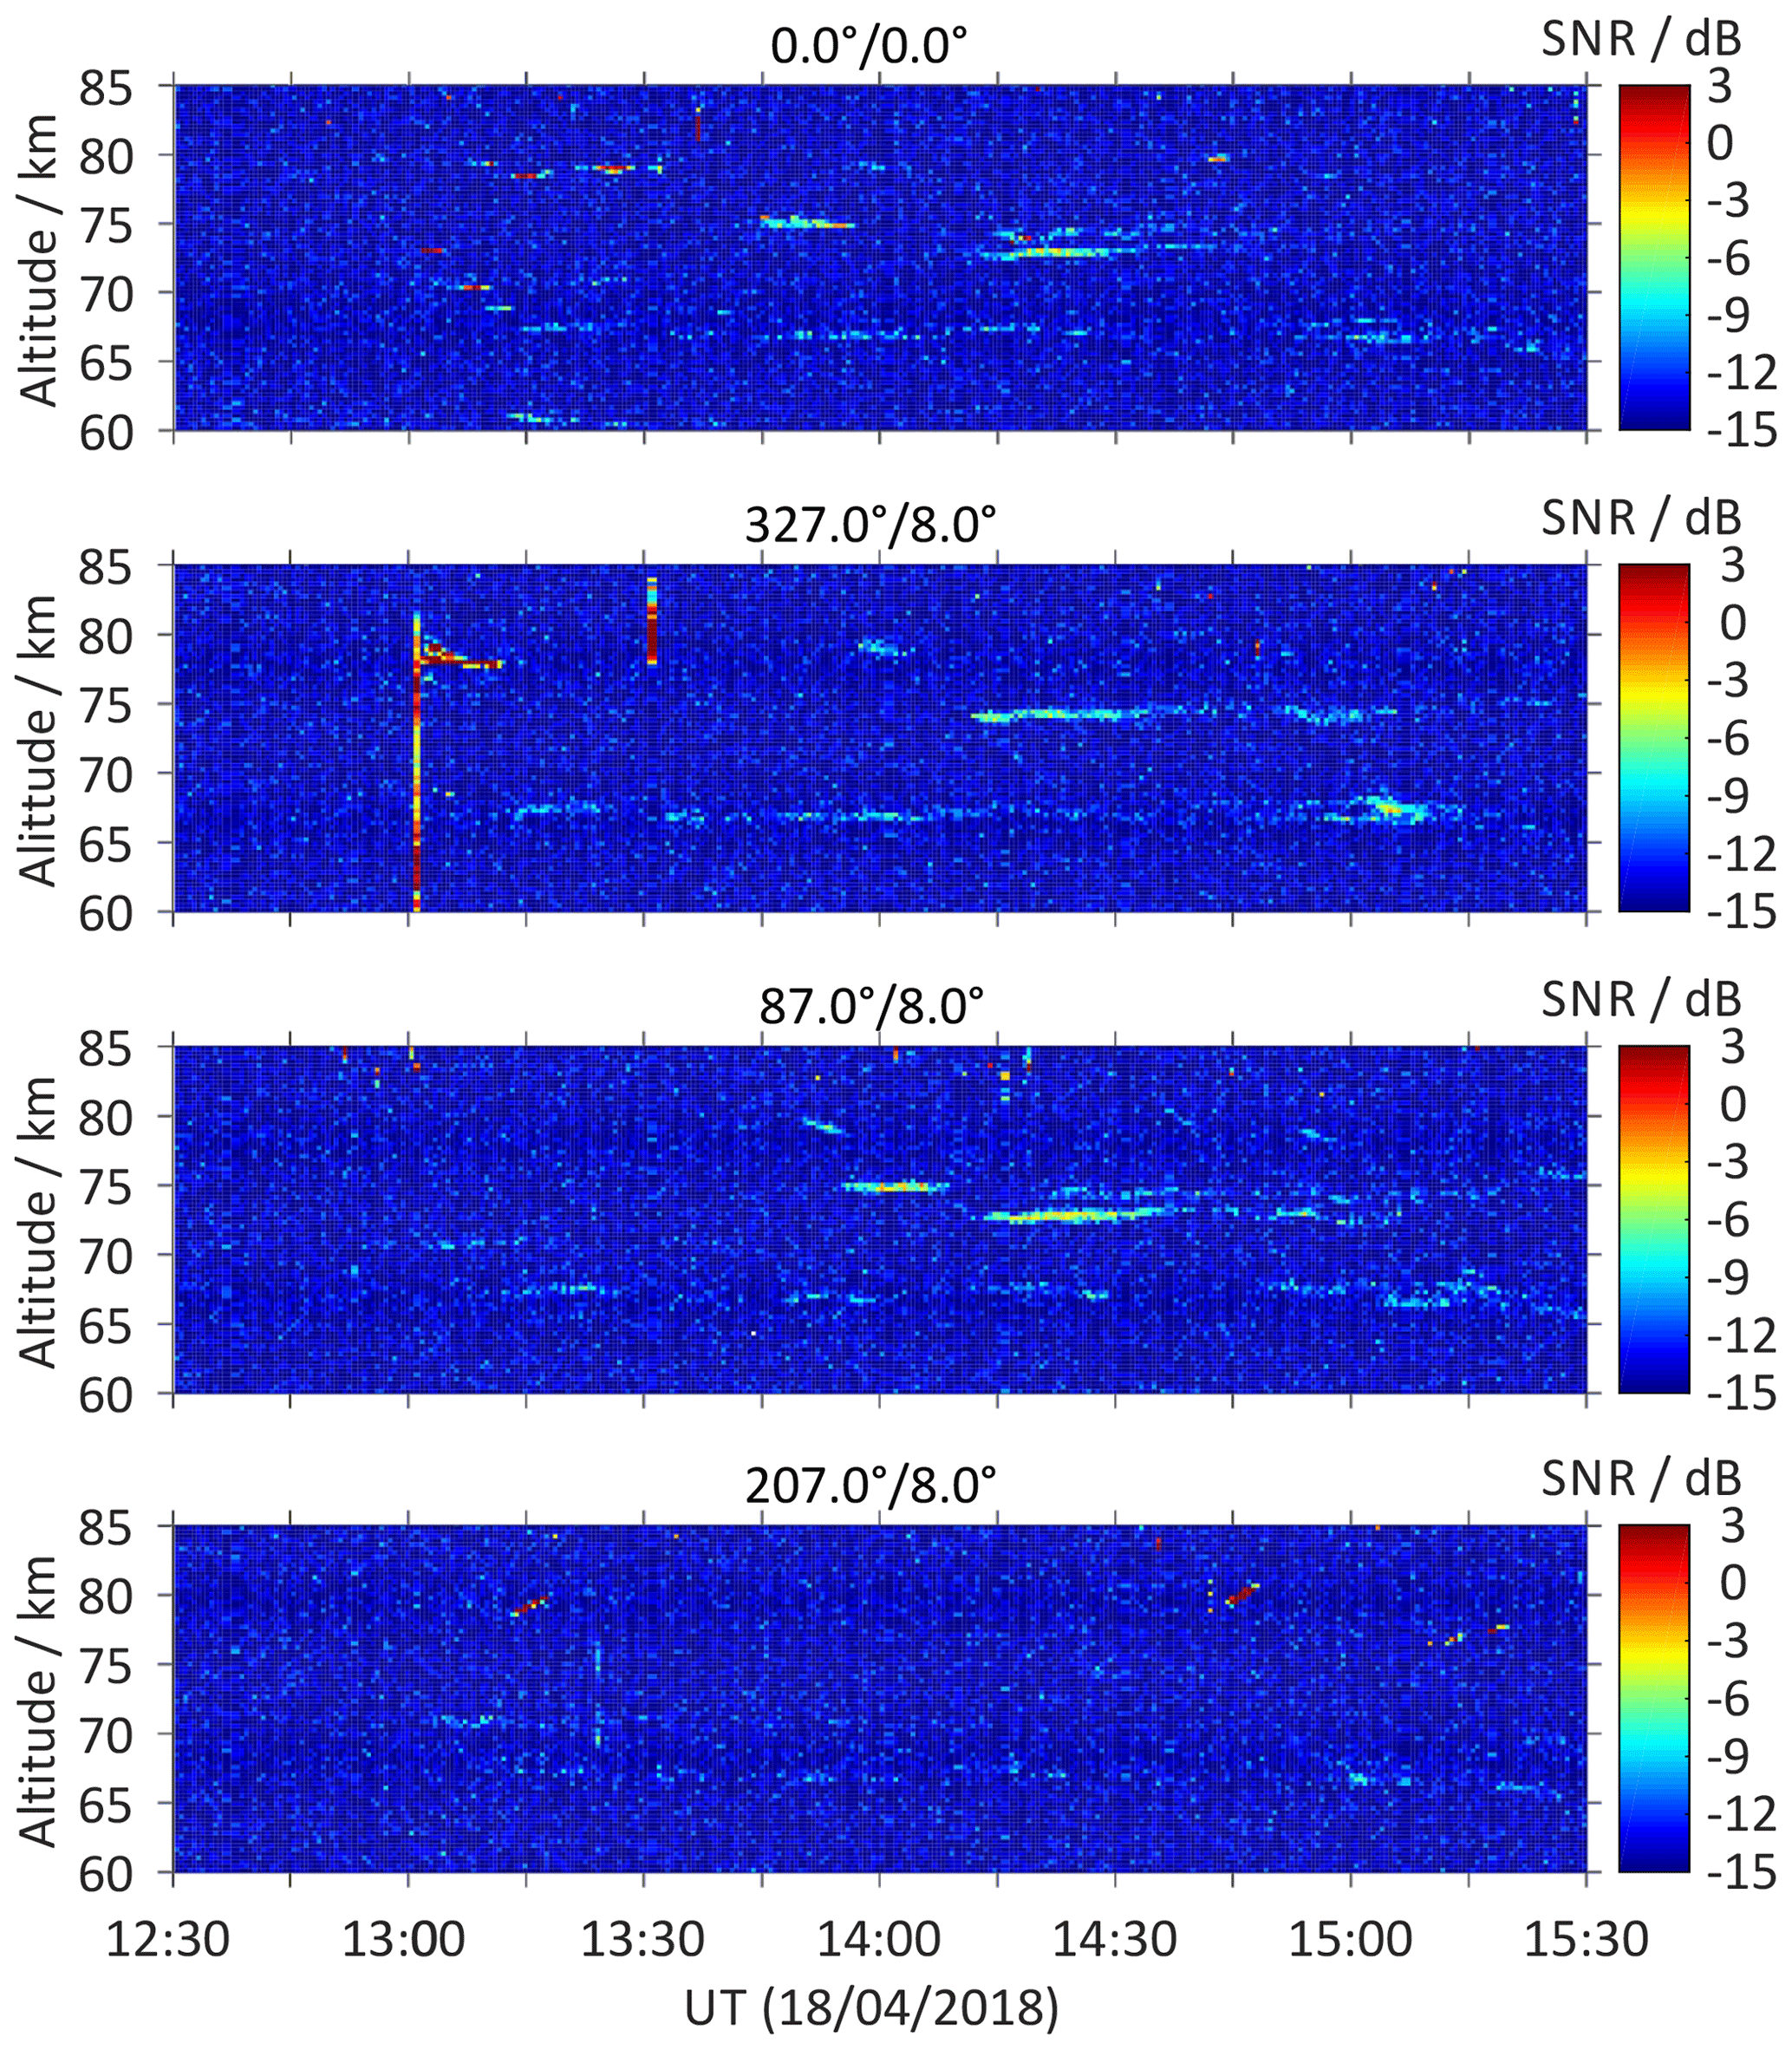
Figure 13Height time intensity plots of SNR obtained from MAARSY multi-beam observations on 18 April 2018 around the launch time of the the second sounding rocket.
The spectral widths of atmospheric radar echoes are often used to interpret turbulent structures (see e.g. Hocking, 1986; Roper and Brosnahan, 1997). The model is based on the assumption that the observed signal of a turbulent cell has an increased spectral width since for one instance of time a few portions of this turbulent cell move towards or away from the radar or have a rather tangential movement. The latter situation will form the center part of the spectrum, equivalent to the originally transmitted signal, while the earlier examples will add positively and negatively Doppler shifted spectral components. The resulting spectrum is the superposition of these three situations and all the states in between.
Similar to the reasoning for electron density measurements, the spectral widths of the detected echoes for one selected range are certainly a superposition of multiple scatterers. Besides the parts originating from the desired measuring volume (beam pointing direction) additional scatter collected via the radiation pattern side lobes is frequently detected. Renkwitz et al. (2018) have shown, that a certain angular spread of ±2∘ around the nominal positions is generally occurring, which corresponds to the radiation pattern beam shape and width. Any additional scatter, especially picked up via the side lobes will enlarge the spectral width of the received signal as for the same horizontal wind velocity e.g. larger radial components are seen due to larger zenith angles. These spectral components might be mistakenly attributed to turbulence and need to be excluded within the analysis.
Equivalent to the angular cleaning method as used for the electron density estimations in the time domain, an angular cleaning method has been used in the frequency domain. Interferometric methods are applied to the individual baseline cross-spectral phases, instead of using cross-correlation phases in the time domain. This approach is similar to the IDI wind estimation technique, where a scattering position is estimated for individual spectral bins (radial velocity). Spectral portions for which a scattering position of more than 10∘ is derived from the vertical are simply excluded. Additionally, the spectra for radial velocities that would exceed any meaningful horizontal velocity of 150 m s−1 are cleaned. For these parts of the spectrum either the scattering position could not be estimated properly, likely due to phase ambiguity, or they are caused by interference or artifacts. The remaining spectra are then analyzed by fitting a Gaussian shape and estimating best fits' properties mean and variance.
4.2 Results from spectral width analysis of Saura MF radar data
Assuming that turbulence estimates can be derived from HF radar data, the raw data from the Saura MF radar observations for the days of both rocket flights were analyzed for spectral width using radar data from the vertical sounding only. As an example, the cross-spectra for 13 April 2018 09:44 UT are shown in Fig. 14. The SNR-cleaned spectrum (left panel) shows an arc shape with a bottom height of 71 km at 0 Hz Doppler frequency extending to 90 km range at ±0.4 Hz. This arc shape is presumably caused by a particle precipitation event reaching a penetration altitude of roughly 70 km. After applying angular and velocity cleaning this arc shape is mostly suppressed in the cleaned spectra as shown in the right panel of Fig. 14 which can be used for the spectral width analysis.
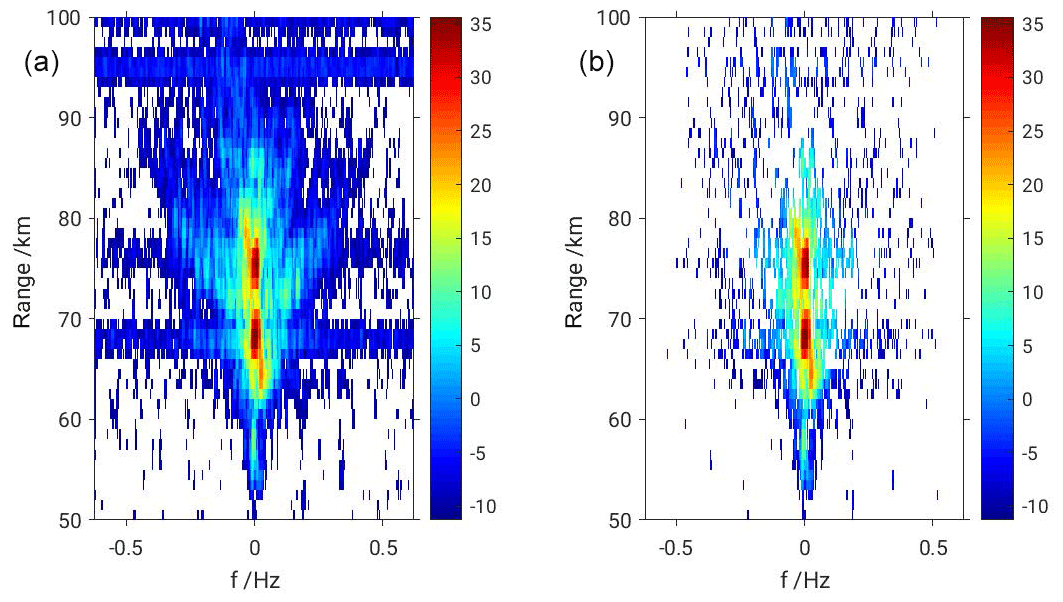
Figure 14Cross-spectra of the Saura radar raw data for 13 April 2018 at 09:44 UT with only SNR selection (a) and applied angular and wind cleaning methods (b). A clear u-shaped arc with a bottom height of about 71 km can be seen in (a), which is likely caused by particle precipitation, but suppressed in the cleaned spectra.
Particle precipitation will generally occur in a larger area than just the nominal radar volume and will consist of a group of certain energy level, which will define the penetration depth (see e.g. Renkwitz and Latteck, 2017). Assuming a nearly homogeneous wind field, the ionized layer will be drifted by the wind field. Based on these assumptions and with increasing zenith angle towards the individual scatterers the radial wind component as well as range will also increase, forming a u-shaped spectrum as depicted in Fig. 15. This scheme highlights the severely increased radar volume for such situations of enhanced ionization due to particle precipitation, comparing the red to the grey cone above the radar. Besides the increased electron density gradients at the bottom of these layers, the normally rather aspect sensitive scatterers for geomagnetic quiet conditions seem to be modified to a more isotropic scattering allowing their observation. The described phenomenon is also related to the so called isolated lower mesospheric echoes (ILME) as reported by Hall et al. (2006). The annual occurrence distribution of such lower altitude ionization layers have been investigated for the Saura MF radar by Renkwitz and Latteck (2017) for almost one solar cycle.
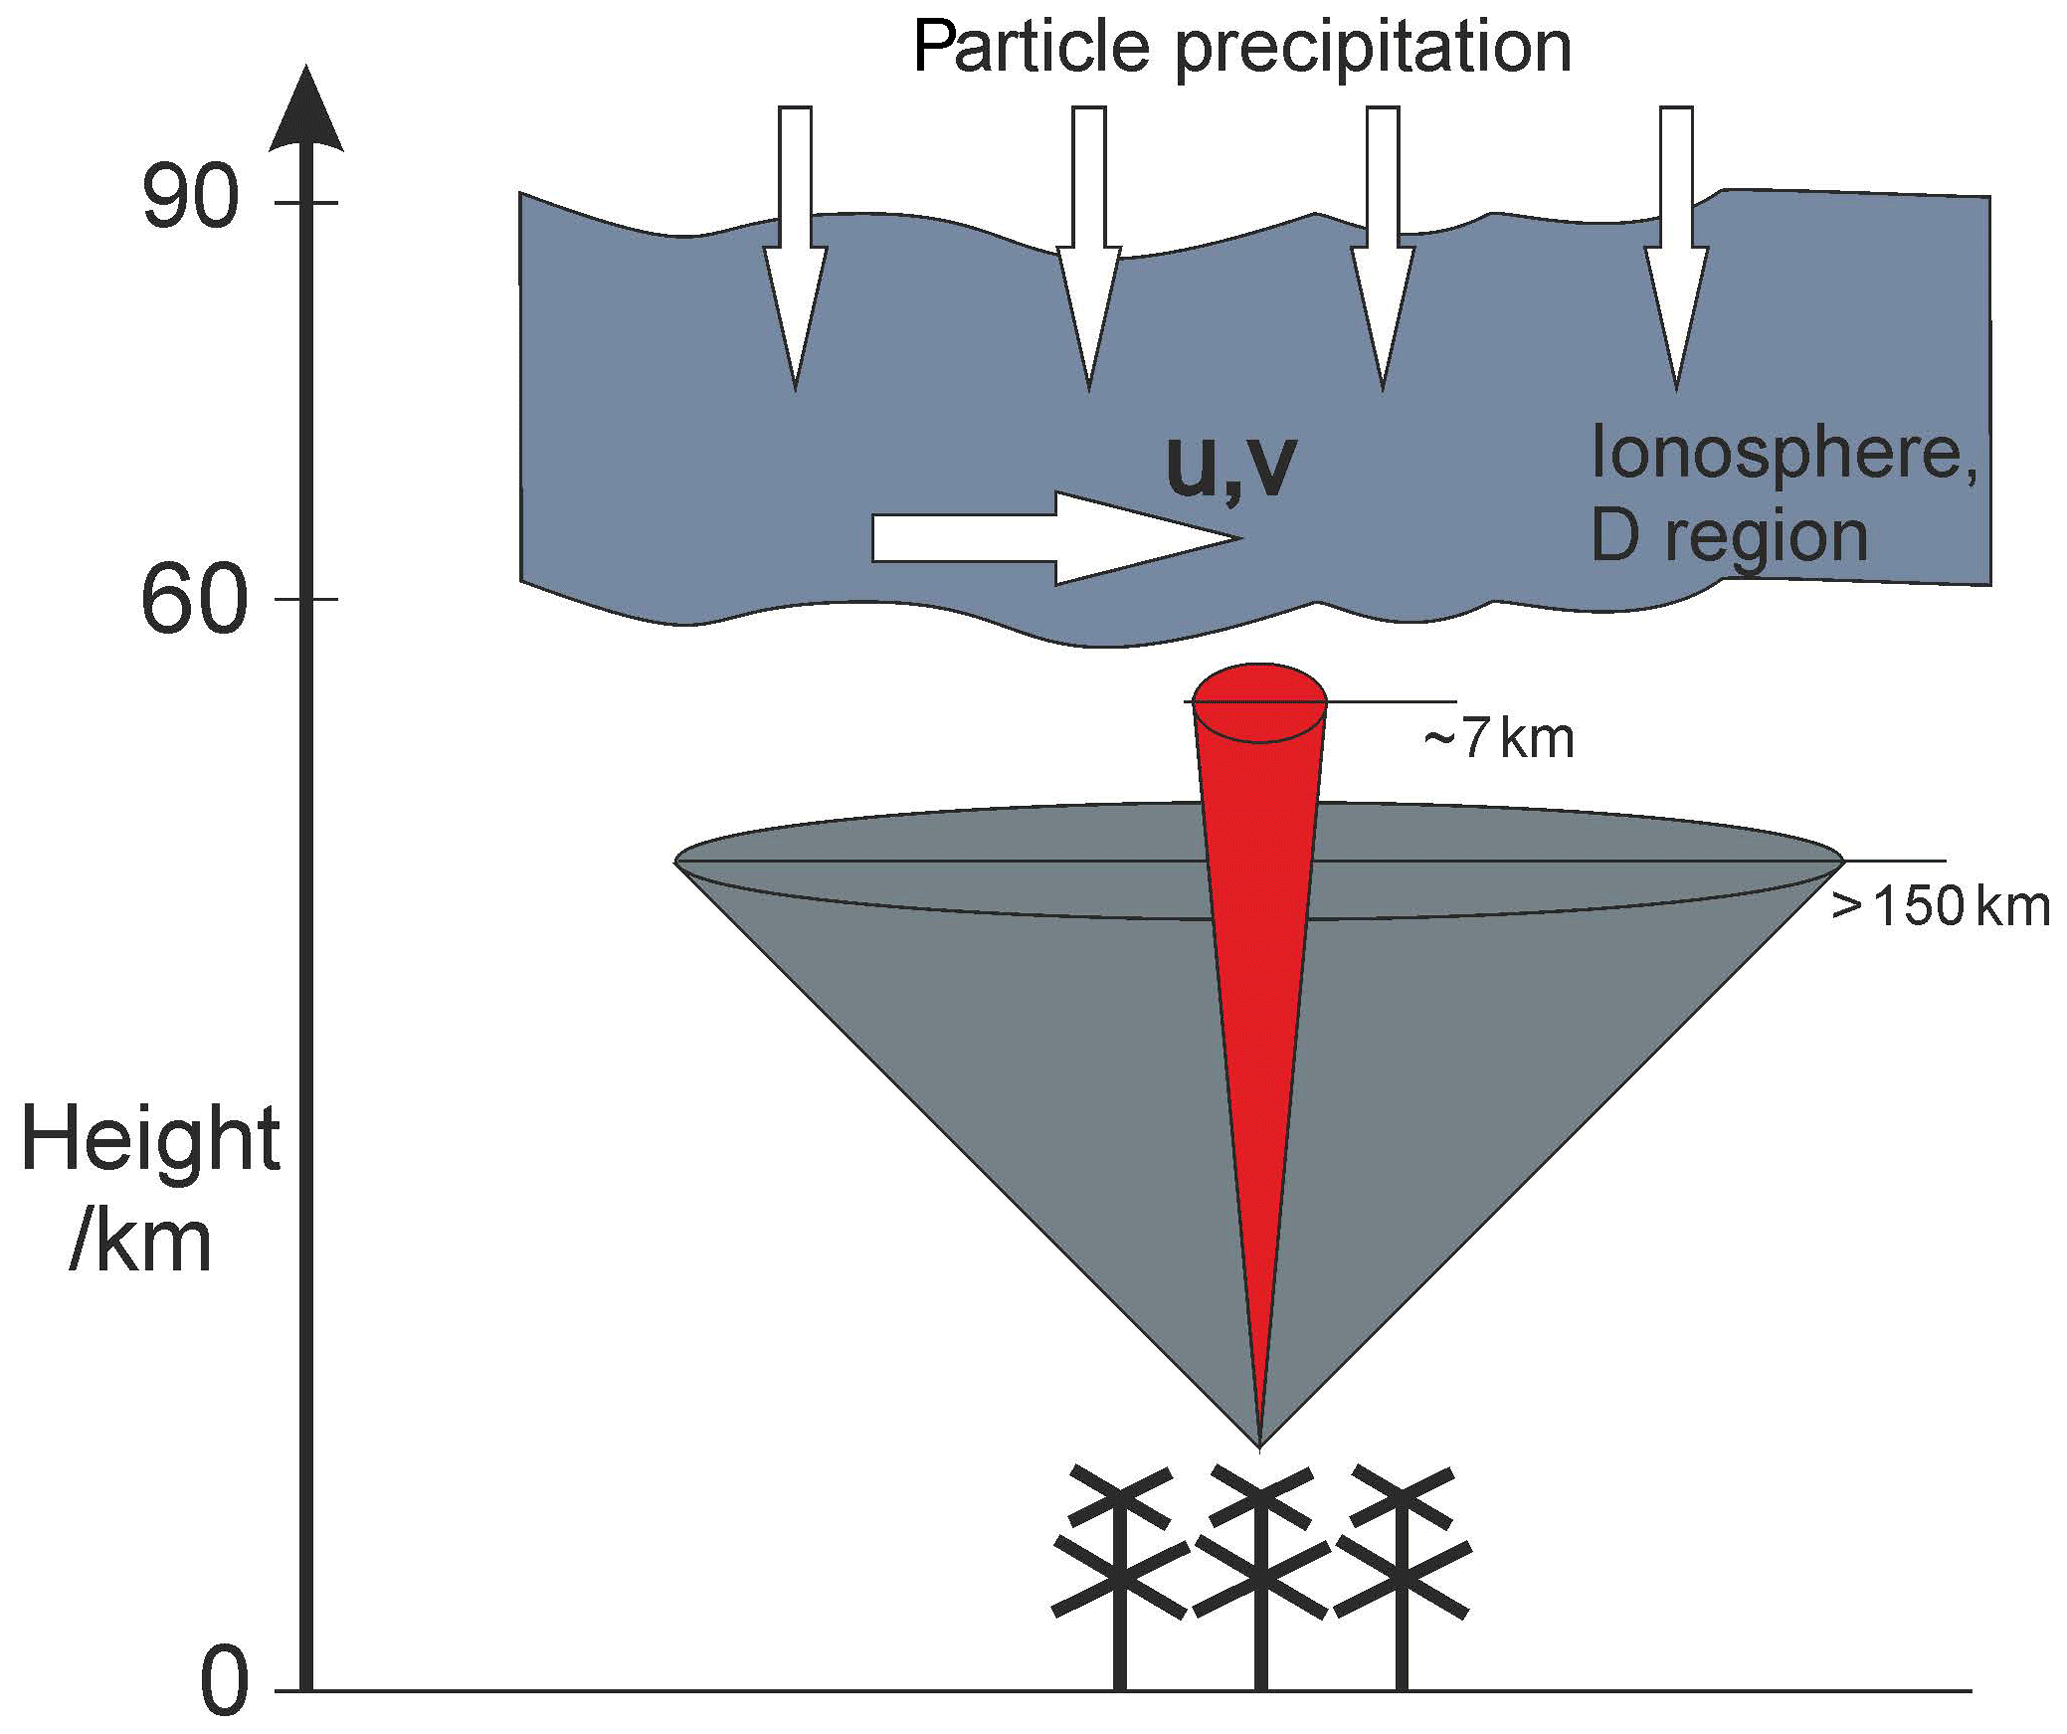
Figure 15Schematic of particle precipitation events as seen by the Saura radar. The narrow red cone above the radar depicts the nominal scattering volume under quiet geomagnetic conditions, while the wide grey cone corresponds to the volume that is covered during particle precipitation events.
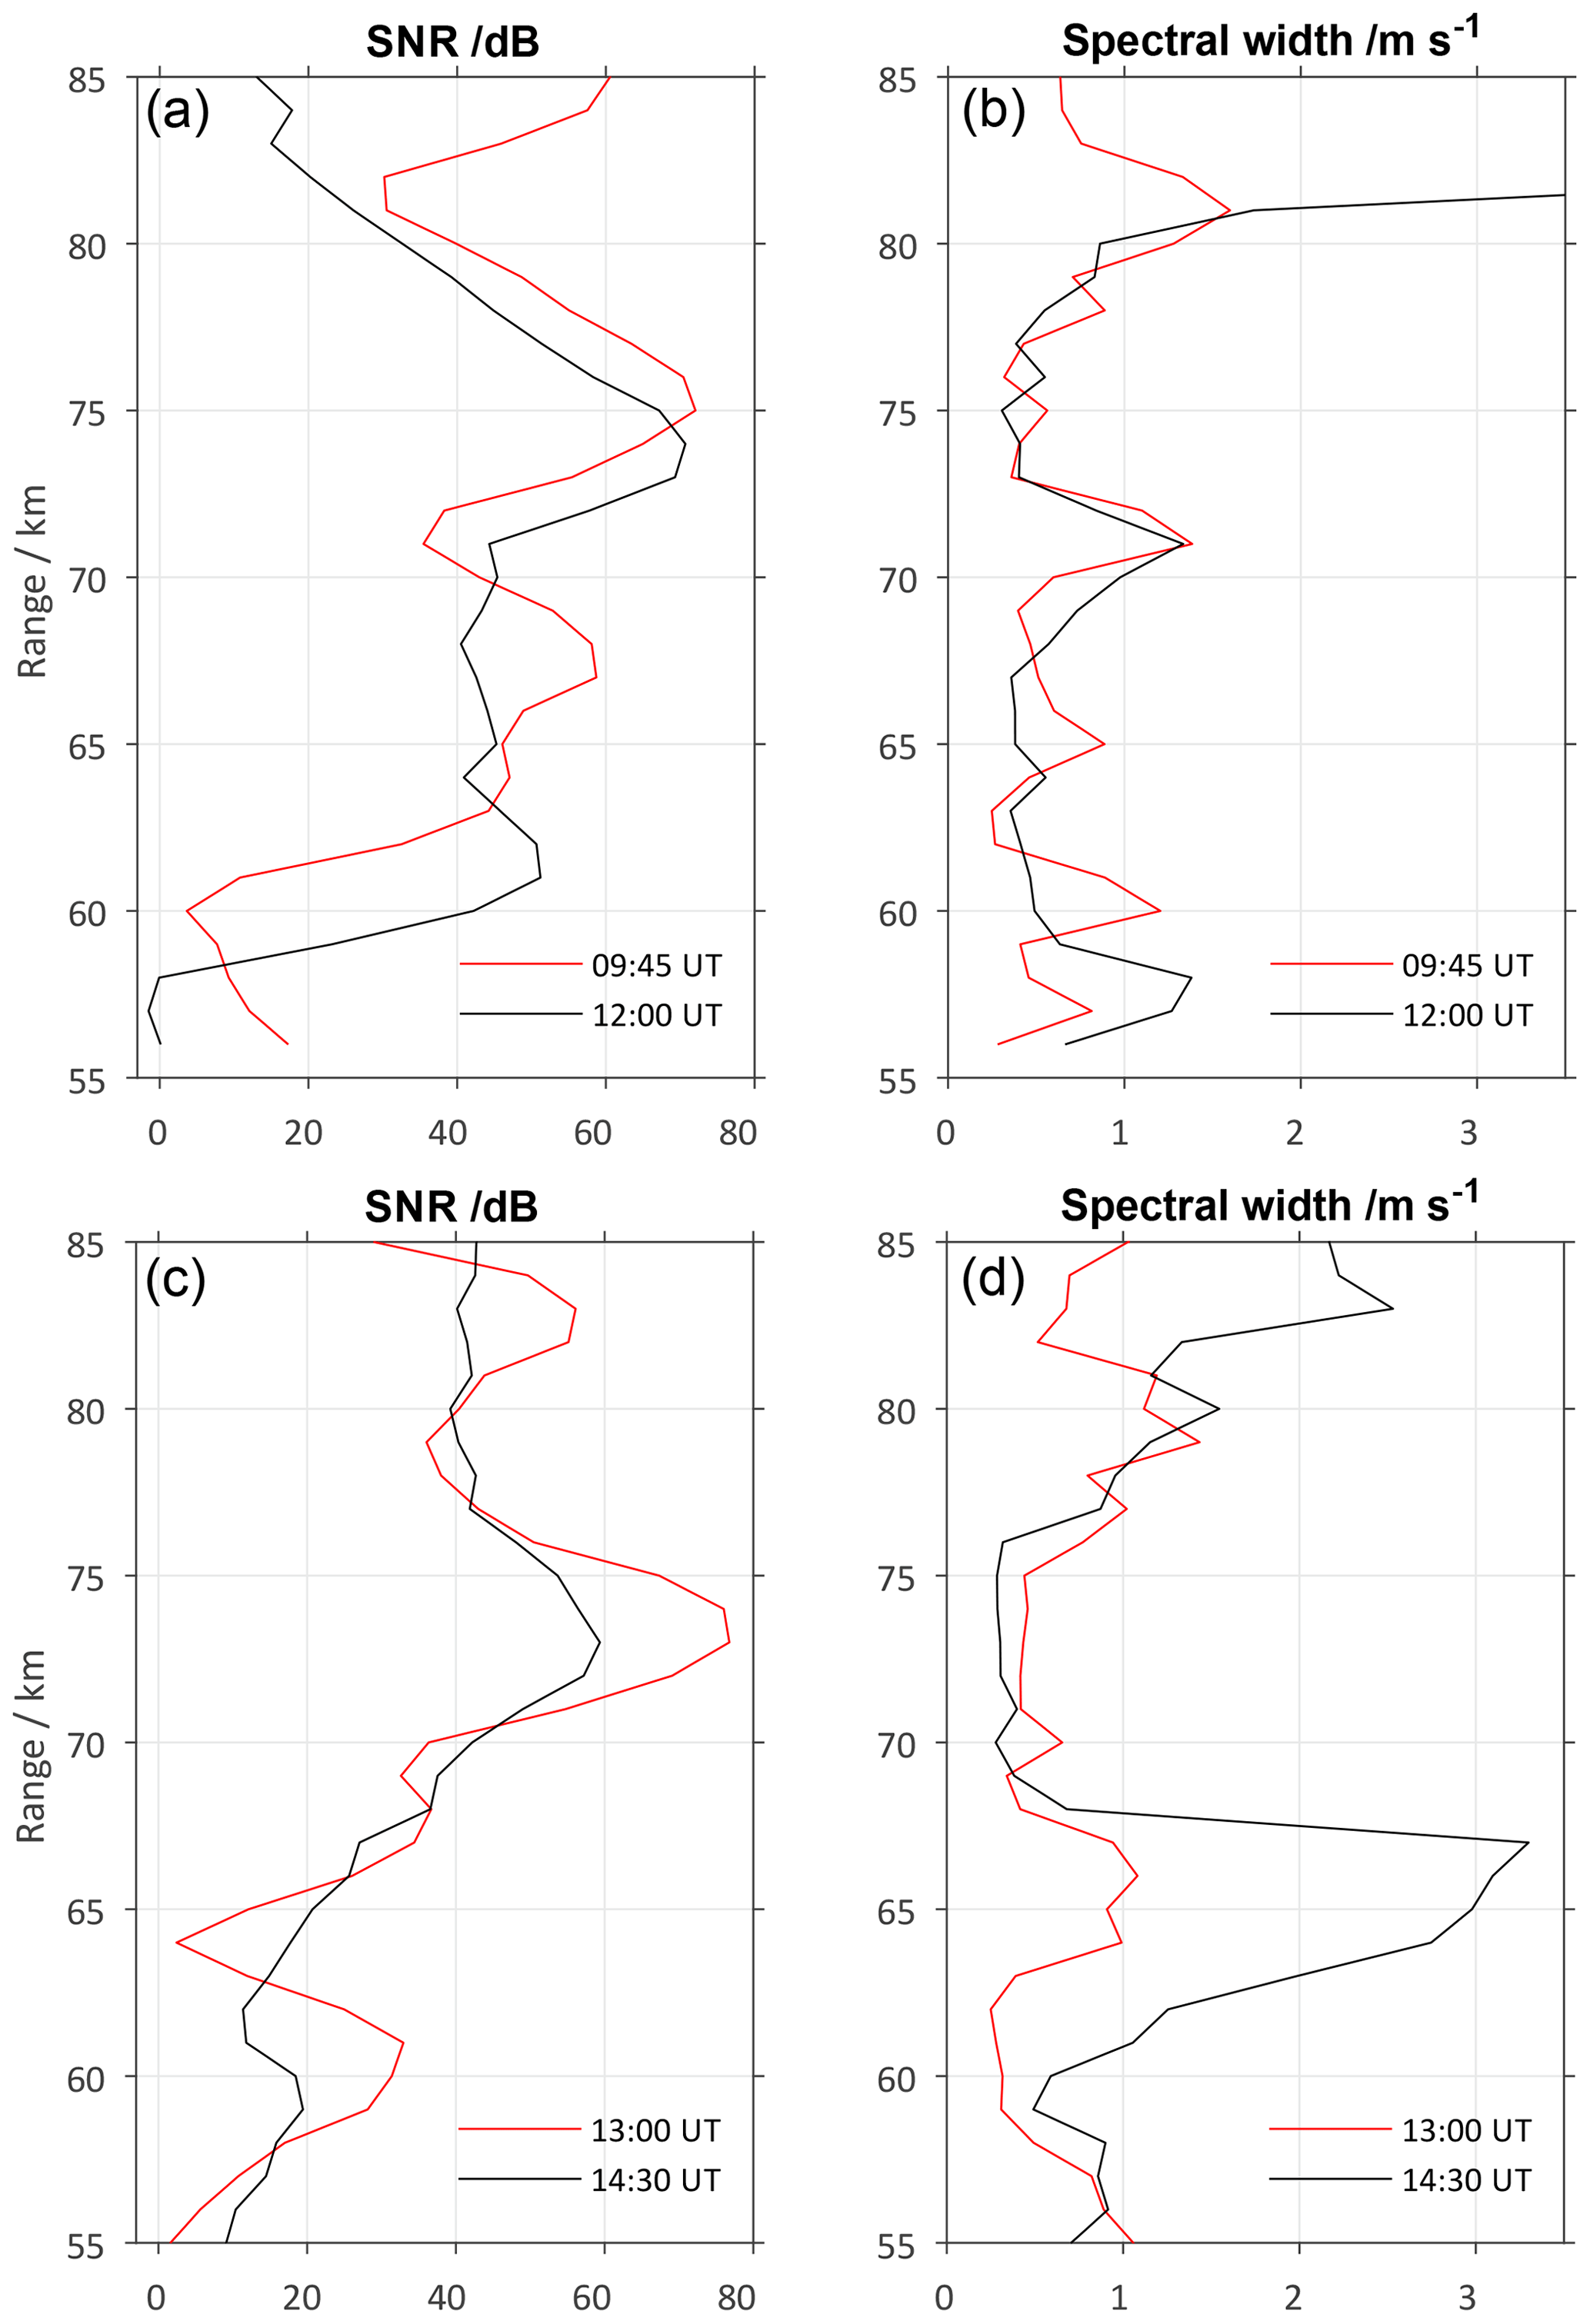
Figure 16X-mode profiles of signal-to-noise ratio and spectral width derived from Saura MF radar data for 13 April 2018, 09:45 and 12:00 UT (a, b) and 18 April 2018, 13:00 and 14:30 UT (c, d).
For both launches the fitted echo power and spectral width are depicted in Fig. 16. Values of spectral widths below 1 m s−1 have been detected in most of the altitudes, while spectral width peaks often occur at altitudes for which a minimum in echo power was detected. The measurements above 80 km are certainly affected by a generally larger population of scatterers due to the altitudinally increasing radar volume and the spectral width estimates still seem to be overestimated.
During the first launch on 13 April 2018 at 09:45 UT spectral broadening is seen between 77–83 km, which likely can be attributed to the minimum of detected power rather than to PWME occurrence. As a reference for quiet conditions without PMWE the fitted power and spectral width for 12:00 UT are also depicted (black curve), which show a very similar behavior as during the launch time. For the second launch day (18 April 2018) a maximum of spectral width is seen around 65 km altitude (bottom panel of Fig. 16), which intensified around 14:30 UT, when PMWE have also been observed with MAARSY in multiple beam directions at 65 km and above (Fig. 13). For these times the uncleaned cross-spectra show clear u-shaped signatures that indicate particle precipitation.
Even after applying spectral cleaning methods as described before the spectra seem to be broadened, such that a turbulence driven broadening cannot be excluded here. Nevertheless, during such conditions the radar volume is certainly highly enlarged and filled with many scatterers, which is not the case for times without particle precipitation.
Continuous probing of the polar mesosphere at Andøya (69.30∘ N, 16.03∘ E) for seven winter seasons from 2011/2012 until 2017/2018 using MAARSY shows that the occurrence of PMWE as a function of season follows closely the solar zenith angle dependence with a symmetric diurnal variation around noon and a mean diurnal occurrence rate of about 20 % for the period September to April with maxima in October and March/April.
PMWE have been observed by MAARSY using a multi-beam experiment during the whole PMWE1 campaign period, starting with a moderate occurrence at the beginning which decreased towards the end of the campaign. The detected signal strengths of the observed echoes varied mainly between 10−17 and 10−15 m−1.
The first sounding rocket was launched on 13 April 2018 at 09:44 UT. Electron densities of more than 109 el m−3 were observed by the Saura MF radar above 70 km between 08:00 and 15:00 UT. A horizontally broad distributed PMWE layer was detected in all MAARSY radar beams at about 79 km altitude around 09:30 UT. The echo was characterized by a relatively broad spectra (σf∼1.5 Hz) and a signal strength of m−1 at the beginning. Slightly positive horizontal winds were measured by the Saura MF radar, indicating a weak wind towards North-East. The PMWE observation led to the launch of the first rocket. The payload passed the decaying part of the PMWE structure. A strong radar echo detected by MAARSY's beam pointing along the rocket trajectory during upleg immediately occurred after the payload had passed the PMWE layer. This echo was characterized by a very narrow spectral extend (σf∼0.3 Hz) and a much stronger intensity of about m−1 compared to the previously observed echo. No PMWE was detected during downleg of the payload.
The second rocket was launched on 18 April 2018 at 13:00 UT. A large variability of electron densities with enhanced ionization in the morning hours but weakening from 08:00 UT was observed by the Saura MF radar throughout the day. Right at the launch time the meassured electron densities increased to 109 el m−3 above 70 km growing towards 13:15 UT. The horizontal winds showed consistent structures related to tides for the entire altitudinal coverage. MAARSY observed some weak PMWE structures in the early morning hours but did not detect any echoes in any of the five radar beams before and during the launch of the second sounding rocket. As with the first rocket launch a radar echo was observed in MAARSY's oblique beam pointing towards the rocket trajectory between 77 and 79 km after the payload had passed this altitude range. This echo was also characterized by a very narrow spectral extend (σf∼0.3 Hz) and a strong intensity of about m−1.
For both days of rocket launches the spectral widths of Saura radar echoes were estimated after applying cleaning methods. For the times of both flights, a minor spectral broadening was found, but maybe by coincidence. However, for the afternoon hours of both days a clear increase of spectral widths was observed, which might be related to imperfect spectral cleaning for the existent particle precipitation events, but turbulence may still play a role for the broadening.
MAARSY data and Saura MF radar data are available from the corresponding author upon request.
BS directed the PMWE1 project as PI. RL conducted the study on the long term changes of PMWE, analyzed the campaign relevant MAARSY data and drafted the first version of the manuscript. TR analysed the Saura MF data and wrote the corresponding passages of the manuscript. All authors actively contributed to the discussions and to writing the final version of the paper.
The authors declare that they have no conflict of interest.
This article is part of the special issue “Kleinheubacher Berichte 2018”. It is a result of the Kleinheubacher Tagung 2018, Miltenberg, Germany, 24–26 September 2018.
We greatly appreciate the excellent support by the Andoya Space Center.
The project PMWE was supported by the German Federal Ministry for Economic Affairs and Energy on the basis of a decision by the German Bundestag. This research has been supported by the German Space Agency (DLR) (grant no. 50OE1402).
This paper was edited by Christoph Jacobi and reviewed by Michael Rietveld and two anonymous referees.
Adams, G. W., Brosnahan, J. W., Walden, D. C., and Nerney, S. F.: Mesospheric observations using a 2.66-MHz radar as an imaging Doppler interferometer: Description and first results, J. Geophys. Res.-Space, 91, 1671–1683, https://doi.org/10.1029/JA091iA02p01671, 1986. a
Belova, E., Kirkwood, S., Ekeberg, J., Osepian, A., Häggström, I., Nilsson, H., and Rietveld, M.: The dynamical background of polar mesosphere winter echoes from simultaneous EISCAT and ESRAD observations, Ann. Geophys., 23, 1239–1247, https://doi.org/10.5194/angeo-23-1239-2005, 2005. a, b, c
Brattli, A., Blix, T. A., Lie-Svendsen, Ø., Hoppe, U.-P., Lübken, F.-J., Rapp, M., Singer, W., Latteck, R., and Friedrich, M.: Rocket measurements of positive ions during polar mesosphere winter echo conditions, Atmos. Chem. Phys., 6, 5515–5524, https://doi.org/10.5194/acp-6-5515-2006, 2006. a
Cho, J. Y. N. and Röttger, J.: An updated review of polar mesosphere summer echoes: Observation, theory, and their relationship to noctilucent clouds and subvisible aerosols, J. Geophys. Res., 102, 2001–2020, 1997. a
Czechowsky, P., Rüster, R., and Schmidt, G.: Variations of mesospheric structures in different seasons, Geophys. Res. Lett., 6, 459–462, 1979. a
Ecklund, W. L. and Balsley, B. B.: Long-term observations of the Arctic mesosphere with the MST radar at Poker Flat, Alaska, J. Geophys. Res., 86, 7775–7780, 1981. a
Hall, C. M., Manson, A. H., Meek, C. E., and Nozawa, S.: Isolated lower mesospheric echoes seen by medium frequency radar at 70∘ N, 19∘ E, Atmos. Chem. Phys., 6, 5307–5314, https://doi.org/10.5194/acp-6-5307-2006, 2006. a
Havnes, O., Latteck, R., Hartquist, T. W., and Antonsen, T.: First Simultaneous Rocket and Radar Detections of Rare Low Summer Mesospheric Clouds, Geophys. Res. Lett., 45, 5727–5734, https://doi.org/10.1029/2018GL078218, 2018. a
Hocking, W.: Observation and measurement of turbulence in the middle atmosphere with a VHF radar, J. Atmos. Terr. Phys., 48, 655–670, https://doi.org/10.1016/0021-9169(86)90015-2, 1986. a
Kero, A., Enell, C.-F., Kavanagh, A. J., Vierinen, J., Virtanen, I., and Turunen, E.: Could negative ion production explain the polar mesosphere winter echo (PMWE) modulation in active HF heating experiments?, Geophys. Res. Lett., 35, L23102, https://doi.org/10.1029/2008GL035798, 2008. a
Kirkwood, S.: Polar mesosphere winter echoes – A review of recent results, Adv. Space Res., 40, 751–757, https://doi.org/10.1016/j.asr.2007.01.024, 2007. a
Kirkwood, S., Barabash, V., Belova, E., Nilsson, H., Rao, T. N., Stebel, K., Osepian, A., and Chilson, P. B.: Polar mesosphere winter echoes during solar proton events, in: Advances in Polar Upper Atmosphere Research, No. 16. September, edited by: Watanabe, O., National Institute of Polar Research, Tokyo., p. 111, 2002. a, b, c
Kirkwood, S., Belova, E., Blum, U., Croskey, C., Dalin, P., Fricke, K.-H., Goldberg, R. A., Manninen, J., Mitchell, J. D., and Schmidlin, F.: Polar mesosphere winter echoes during MaCWAVE, Ann. Geophys., 24, 1245–1255, https://doi.org/10.5194/angeo-24-1245-2006, 2006a. a
Kirkwood, S., Chilson, P., Belova, E., Dalin, P., Häggström, I., Rietveld, M., and Singer, W.: Infrasound – the cause of strong Polar Mesosphere Winter Echoes?, Ann. Geophys., 24, 475–491, https://doi.org/10.5194/angeo-24-475-2006, 2006b. a, b
La Hoz, C. and Havnes, O.: Artificial modification of polar mesospheric winter echoes with an RF heater: Do charged dust particles play an active role?, J. Geophys. Res.-Atmos., 113, D19205, https://doi.org/10.1029/2008JD010460, 2008. a
Latteck, R. and Strelnikova, I.: Extended observations of polar mesosphere winter echoes over Andøya (69∘ N) using MAARSY, J. Geophys. Res.-Atmos., 120, 8216–8226, https://doi.org/10.1002/2015JD023291, 2015. a, b, c, d, e
Latteck, R., Singer, W., and Bardey, H.: The ALWIN MST radar – Technical design and performances, in: Proceedings of the 14th ESA Symposium on European Rocket and Balloon Programmes and Related Research, Potsdam, Germany, edited by: Kaldeich-Schürmann, B., Vol. ESA-SP 437, 179–184, ESA Publications Devision, ESTEC, Noordwijk, the Netherlands, 1999. a
Latteck, R., Singer, W., Rapp, M., Renkwitz, T., and Stober, G.: Horizontally resolved structures of radar backscatter from polar mesospheric layers, Adv. Radio Sci., 10, 285–290, https://doi.org/10.5194/ars-10-285-2012, 2012a. a
Latteck, R., Singer, W., Rapp, M., Vandepeer, B., Renkwitz, T., Zecha, M., and Stober, G.: MAARSY – The new MST radar on Andøya: System description and first results, Radio Sci., 47, RS1006, https://doi.org/10.1029/2011RS004775, 2012b. a
Lübken, F.-J., Strelnikov, B., Rapp, M., Singer, W., Latteck, R., Brattli, A., Hoppe, U.-P., and Friedrich, M.: The thermal and dynamical state of the atmosphere during polar mesosphere winter echoes, Atmos. Chem. Phys., 6, 13–24, https://doi.org/10.5194/acp-6-13-2006, 2006. a, b
Morris, R. J., Klekociuk, A. R., and Holdsworth, D. A.: First observations of Southern Hemisphere polar mesosphere winter echoes including conjugate occurrences at ∼69∘ S latitude, Geophys. Res. Lett., 38, L03811, https://doi.org/10.1029/2010GL046298, 2011. a
Nishiyama, T., Sato, K., Nakamura, T., Tsutsumi, M., Sato, T., Kohma, M., Nishimura, K., Tomikawa, Y., Ejiri, M. K., and Tsuda, T. T.: Height and time characteristics of seasonal and diurnal variations in PMWE based on 1 year observations by the PANSY radar (69.0∘ S, 39.6∘ E), Geophys. Res. Lett., 42, 2100–2108, https://doi.org/10.1002/2015GL063349, 2015. a
Rapp, M. and Lübken, F.-J.: Polar mesosphere summer echoes (PMSE): Review of observations and current understanding, Atmos. Chem. Phys., 4, 2601–2633, https://doi.org/10.5194/acp-4-2601-2004, 2004. a, b
Rapp, M., Latteck, R., Stober, G., and Singer, W.: First 3-dimensional observations of polar mesosphere winter echoes: resolving space-time ambiguity, J. Geophys. Res., 116, A11307, https://doi.org/10.1029/2011JA016858, 2011. a, b
Renkwitz, T. and Latteck, R.: Variability of virtual layered phenomena in the mesosphere observed with medium frequency radars at 69∘ N, J. Atmos. Sol.-Terr. Phy., 163, 38–45, https://doi.org/10.1016/j.jastp.2017.05.009, 2017. a, b
Renkwitz, T., Tsutsumi, M., Laskar, F. I., Chau, J. L., and Latteck, R.: On the role of anisotropic MF/HF scattering in mesospheric wind estimation, Earth Planets Space, 70, 158, https://doi.org/10.1186/s40623-018-0927-0, 2018. a, b, c
Roper, R. G. and Brosnahan, J. W.: Imaging Doppler interferometry and the measurement of atmospheric turbulence, Radio Sci., 32, 1137–1148, https://doi.org/10.1029/97RS00089, 1997. a, b
Singer, W., Latteck, R., Friedrich, M., Dalin, P., Kirkwood, S., Engler, N., and Holdsworth, D.: D-region electron densities obtained by differential absorption and phase measurements with a 3-MHz Doppler radar, 17th ESA Symposium on European Rocket and Balloon Programmes and Related Research, 233–238, 2005. a
Singer, W., Latteck, R., and Holdsworth, D. A.: A new narrow beam Doppler radar at 3 MHz for studies of the high-latitude middle atmosphere, Adv. Space Res., 41, 1488–1494, https://doi.org/10.1016/j.asr.2007.10.006, 2008. a
Stober, G., Latteck, R., Rapp, M., Singer, W., and Zecha, M.: MAARSY – the new MST radar on Andøya: first results of spaced antenna and Doppler measurements of atmospheric winds in the troposphere and mesosphere using a partial array, Adv. Radio Sci., 10, 291–298, https://doi.org/10.5194/ars-10-291-2012, 2012. a
Strelnikov, B., Szewczyk, A., Strelnikova, I., Latteck, R., Baumgarten, G., Lübken, F.-J., Rapp, M., Fasoulas, S., Löhle, S., Eberhart, M., Hoppe, U.-P., Dunker, T., Friedrich, M., Hedin, J., Khaplanov, M., Gumbel, J., and Barjatya, A.: Spatial and temporal variability in MLT turbulence inferred from in situ and ground-based observations during the WADIS-1 sounding rocket campaign, Ann. Geophys., 35, 547–565, https://doi.org/10.5194/angeo-35-547-2017, 2017. a
Strelnikov, B., Eberhart, M., Friedrich, M., Hedin, J., Khaplanov, M., Baumgarten, G., Williams, B. P., Staszak, T., Asmus, H., Strelnikova, I., Latteck, R., Grygalashvyly, M., Lübken, F.-J., Höffner, J., Wörl, R., Gumbel, J., Löhle, S., Fasoulas, S., Rapp, M., Barjatya, A., Taylor, M. J., and Pautet, P.-D.: Simultaneous in situ measurements of small-scale structures in neutral, plasma, and atomic oxygen densities during WADIS sounding rocket project, Atmos. Chem. Phys. Discuss., https://doi.org/10.5194/acp-2018-1043, in review, 2019. a
Woodman, R. F. and Guillen, A.: Radar observations of winds and turbulence in the stratosphere and mesosphere, J. Atmos. Sci., 31, 493–505, 1974. a
Zeller, O., Zecha, M., Bremer, J., Latteck, R., and Singer, W.: Mean characteristics of mesosphere winter echoes at mid- and high-latitudes, J. Atmos. Sol.-Terr. Phy., 68, 1087–1104, https://doi.org/10.1016/j.jastp.2006.02.015, 2006. a, b, c
- Abstract
- Introduction
- Long term observations of polar mesosphere winter echoes at Andøya
- The PMWE1 campaign at Andøya in April 2018
- Extended analysis of Saura MF radar data for turbulence estimation
- Summary
- Data availability
- Author contributions
- Competing interests
- Special issue statement
- Acknowledgements
- Financial support
- Review statement
- References