 | 19 Sep 2019
High-Frequency Modeling of Coplanar Waveguides Including Surface Roughness
Konstantin Lomakin
Klaus Helmreich
Uwe Arz
An existing analytical transmission line model to describe propagation properties of coplanar waveguides including dispersion and radiation effects was extended to take into account surface roughness of conductor traces. The influence of parasitics is successively included in the simulation and compared to measurements. The device under test (DUT) was fabricated on an Al2O3 wafer. A metal and ceramic chuck was utilized during measurements up to 120 GHz. The extended model is then capable of precisely predicting propagation properties in a wide frequency range and can now be used for calibration purposes like the development of uncertainty budgets.
- Article
(2572 KB) - Full-text XML
- BibTeX
- EndNote


Coplanar waveguides (CPWs) are frequently used in all different kinds of planar circuits like (printed circuit boards) PCBs and on-wafer applications. Especially the latter – ubiquitous nano- and microelectronics – utilize this transmission line type particularly. The exact knowledge of its high-frequency properties thus is essential for modern electronics with increasing data-rates and consequently increasing application frequencies.
Nowadays numerical full-wave electro-magnetic simulators are available that are capable of accounting for parasitic effects like dispersion, radiation and conductor loss effects (Schmückle et al., 2011). Nevertheless analytical transmission line models are required for developing reliable uncertainty budgets for calibration purposes (Arz et al., 2017) and moreover have fundamental importance to microwave design.
Such an analytical model was presented in the early nineties (Heinrich, 1993). This quasi-TEM approach describes the electrical behavior of a CPW from DC to a certain frequency – depending on CPW dimensions – from where on radiation and additional dispersion, due to coupling to higher order modes, take place. These effects were added to the CPW model in (Schnieder et al., 2003), so that modeling of CPW properties at high frequencies is possible now. But at high frequencies the skin depth decreases to the order of surface roughness, so that the assumption of ideal smooth conductor walls does not hold anymore and roughness strongly impacts on transmission properties of any kind of waveguide.
This paper shows the application of a roughness model (Gold and Helmreich, 2012) that is capable of accounting for impact on loss and delay of transmission lines to the contemplated CPW model. This new extension finally allows for precisely describing properties of CPWs including all known parasitic effects. The model predictions are compared to measurements of CPWs on Al2O3 with both metal and ceramic chuck and show a very good agreement in both scenarios.
In the following the geometrical parameters wg, w, t, s and h are utilized as shown in the sketched cross-section of a CPW in Fig. 1. Additionally the material parameters relative permittivity εr of the substrate, dielectric loss tangent tan δ and conductivity σ of the traces are necessary.
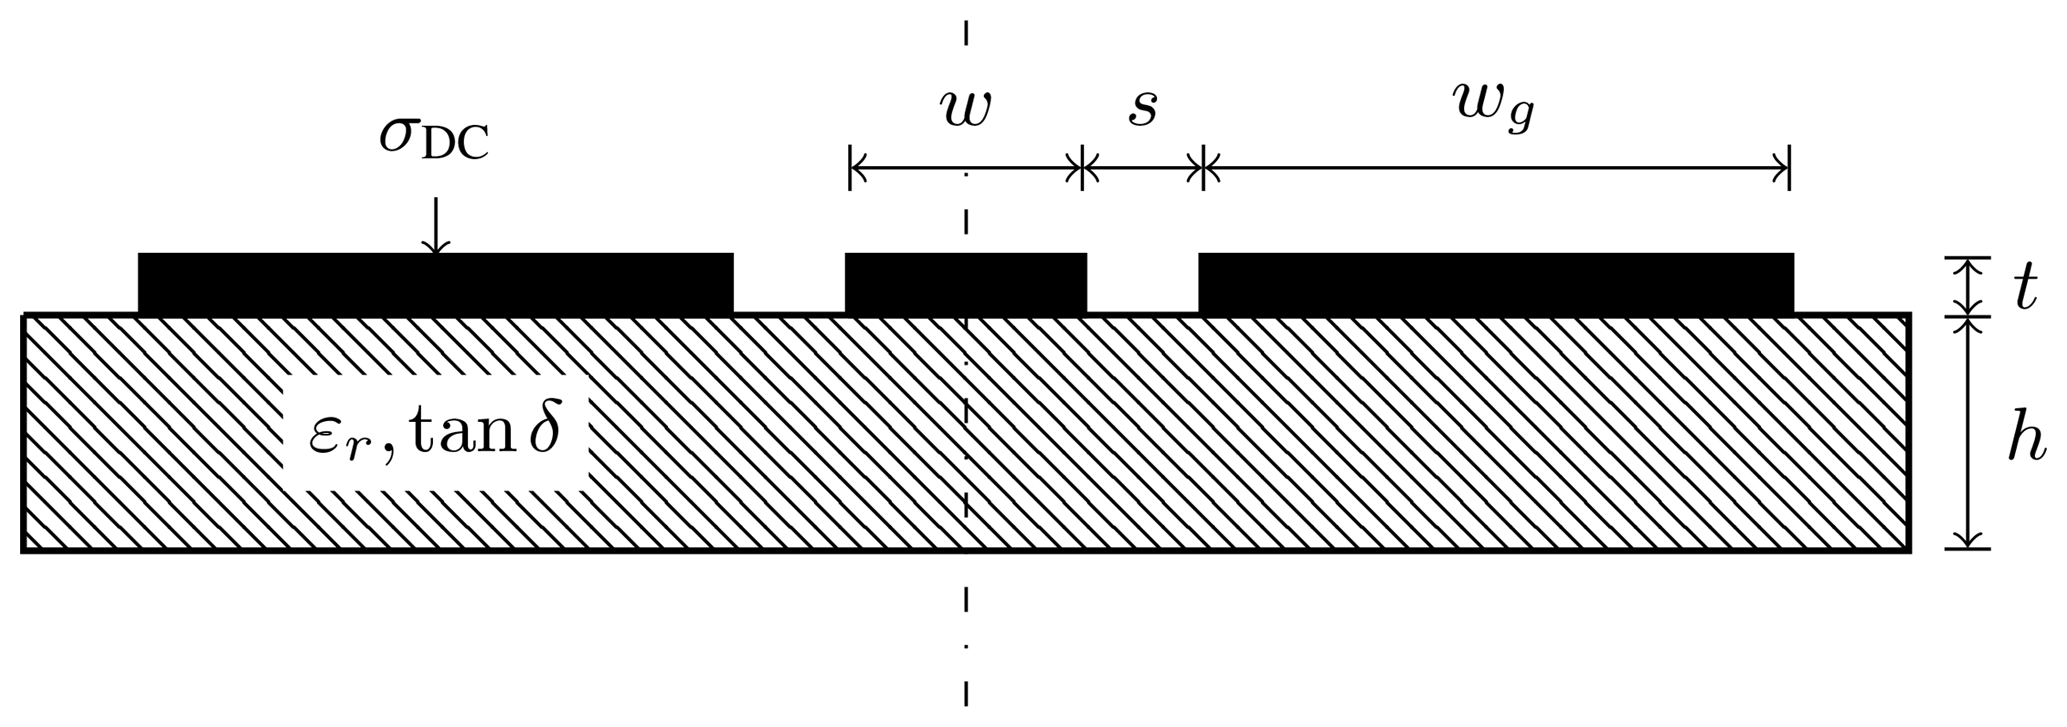
The regarded transmission lines are purely coplanar, i.e. there is no additional ground plane beneath the dielectric. However, to rest the DUT during measurement, a so called chuck is used. Depending on its material, metal or ceramic, there is an impact on the measurement and consequently has to be considered during simulation, which is done by assuming an infinite substrate in the case of the ceramic chuck. This assumption is justified, since the height of the chuck is very large compared to the substrate, so that the electromagnetic field does not penetrate through it. Additionally, the relative permittivity of the chuck and substrate are assumed to be equal. The metal chuck results in a boundary condition respectively after the specified substrate height. A more detailed insight of the impact from different chuck permittivities is given in Phung et al. (2018a, b).
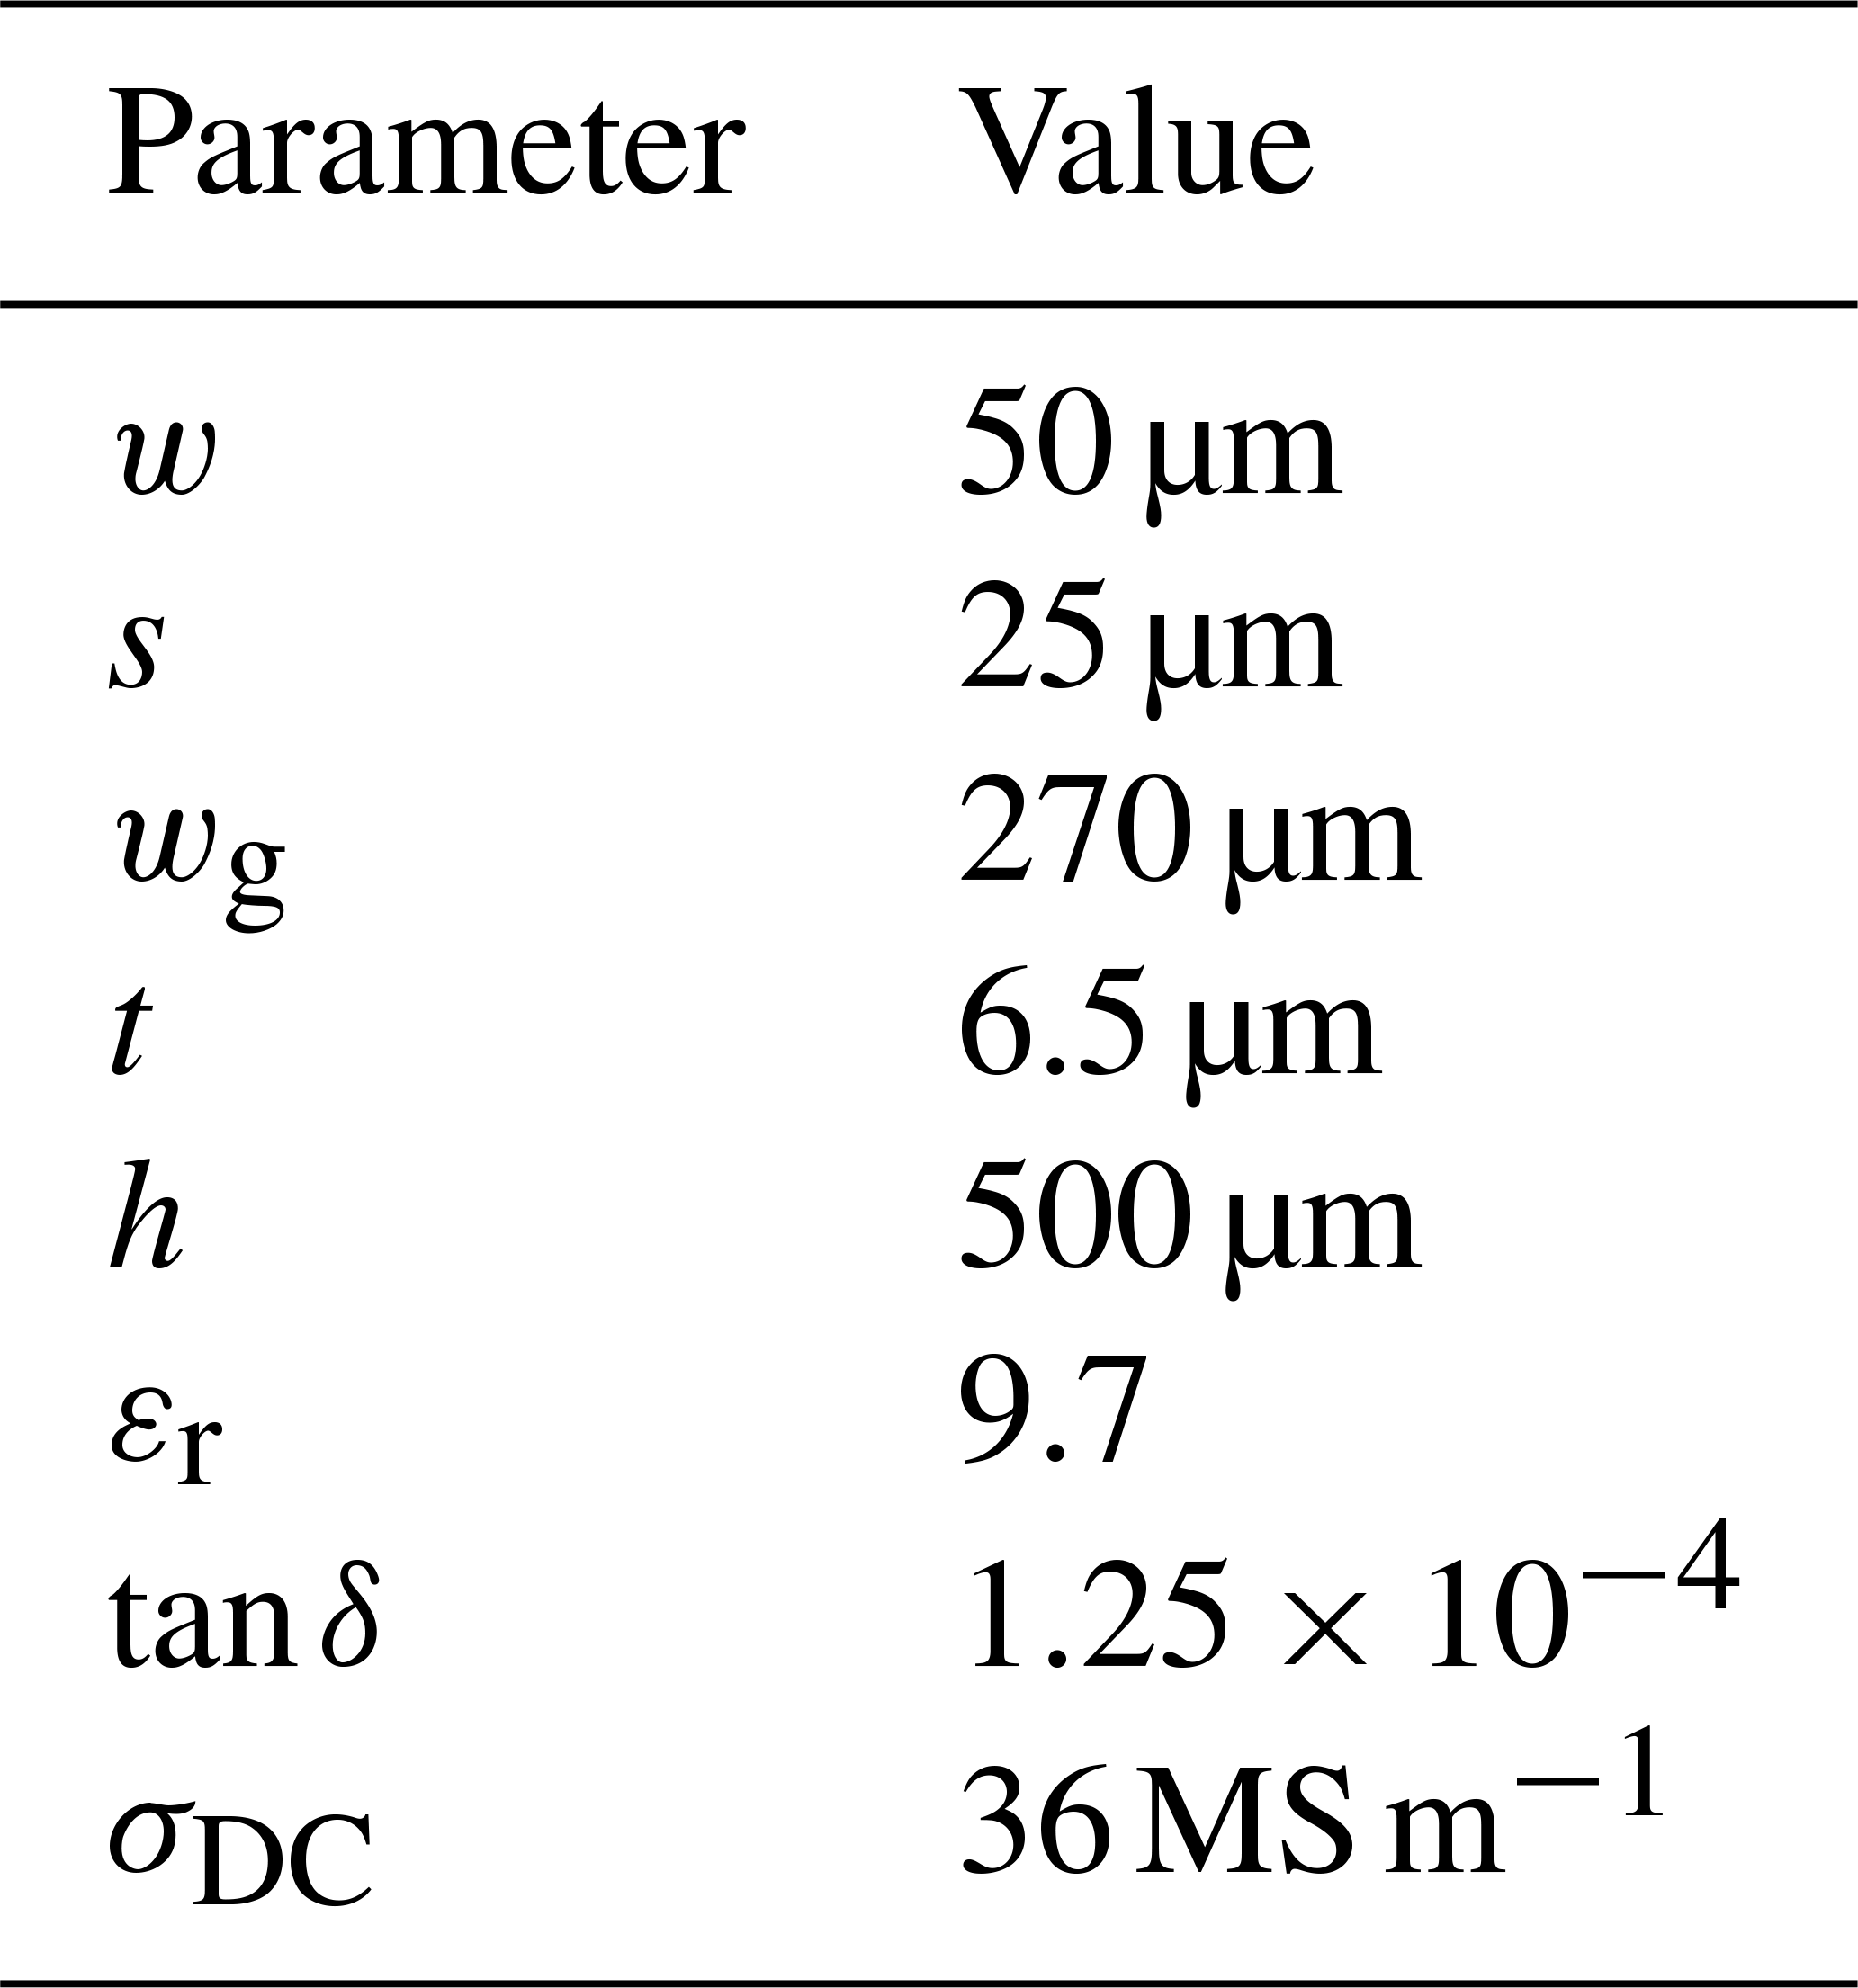
The CPW was fabricated on an Al2O3 substrate, which was characterized separately with a split cylinder resonator (Janezic, 2003). The relative permittivity in the frequency range from 8 to 22 GHz was measured as 9.7, the loss tangent about to . The nominal dimensions of the lines are w=50 µm, s=25 µm, wg=270 µm. Due to the electroplating process the conductive traces are subject to a variation of their thickness across the wafer. A figure of 6.5 µm therefore is used in the following investigations. Likewise the conductivity σDC is affected by the electroplating process, since it is always lower compared to bulk metal. Because of that we use a conductivity value of 36 MS m−1.
Thus, measurements were performed whereby the complex propagation coefficient γ of the CPW is obtained by a multiline calibration method (Marks, 1991). The measured responses are presented as attenuation α=Re(γ) and effective permittivity , in which vp in turn is the phase velocity .
In the next sections, the CPW model with and without radiation and dispersion effects is compared to the measured propagation properties. Then the application of the surface roughness model is explained. For this purpose the relationship between independently measured surface profile data, magnetic field and resulting effective, frequency dependent material parameters and necessary adaptions in the CPW model are shown.
3.1 CPW Model without dispersion and radiation
In analytical transmission line models, the electromagnetic properties are described with per unit length (pul) parameters L′ and C′, the loss mechanisms with R′ and G′ for an infinitesimal short transmission line segment dz. From those parameters, the complex propagation coefficient can be calculated:
It's worth to note, that both outer and inner inductance contribute to the total pul inductance . The inner inductance represents the magnetic field penetrating the conductor due to its finite conductivity, i.e. the skin effect.
The quasi-TEM model approach (Heinrich, 1993) includes conductor loss, substrate loss and finite metallization thickness. With the geometrical and material properties from section II, attenuation α and effective, relative permittivity εr, eff can be calculated analytically. These responses are compared to the measurement in Figs. 2 and 3. To illustrate the stepwise improvements in the following, the deviation of simulation and measurement is plotted as relative error (gray filled).
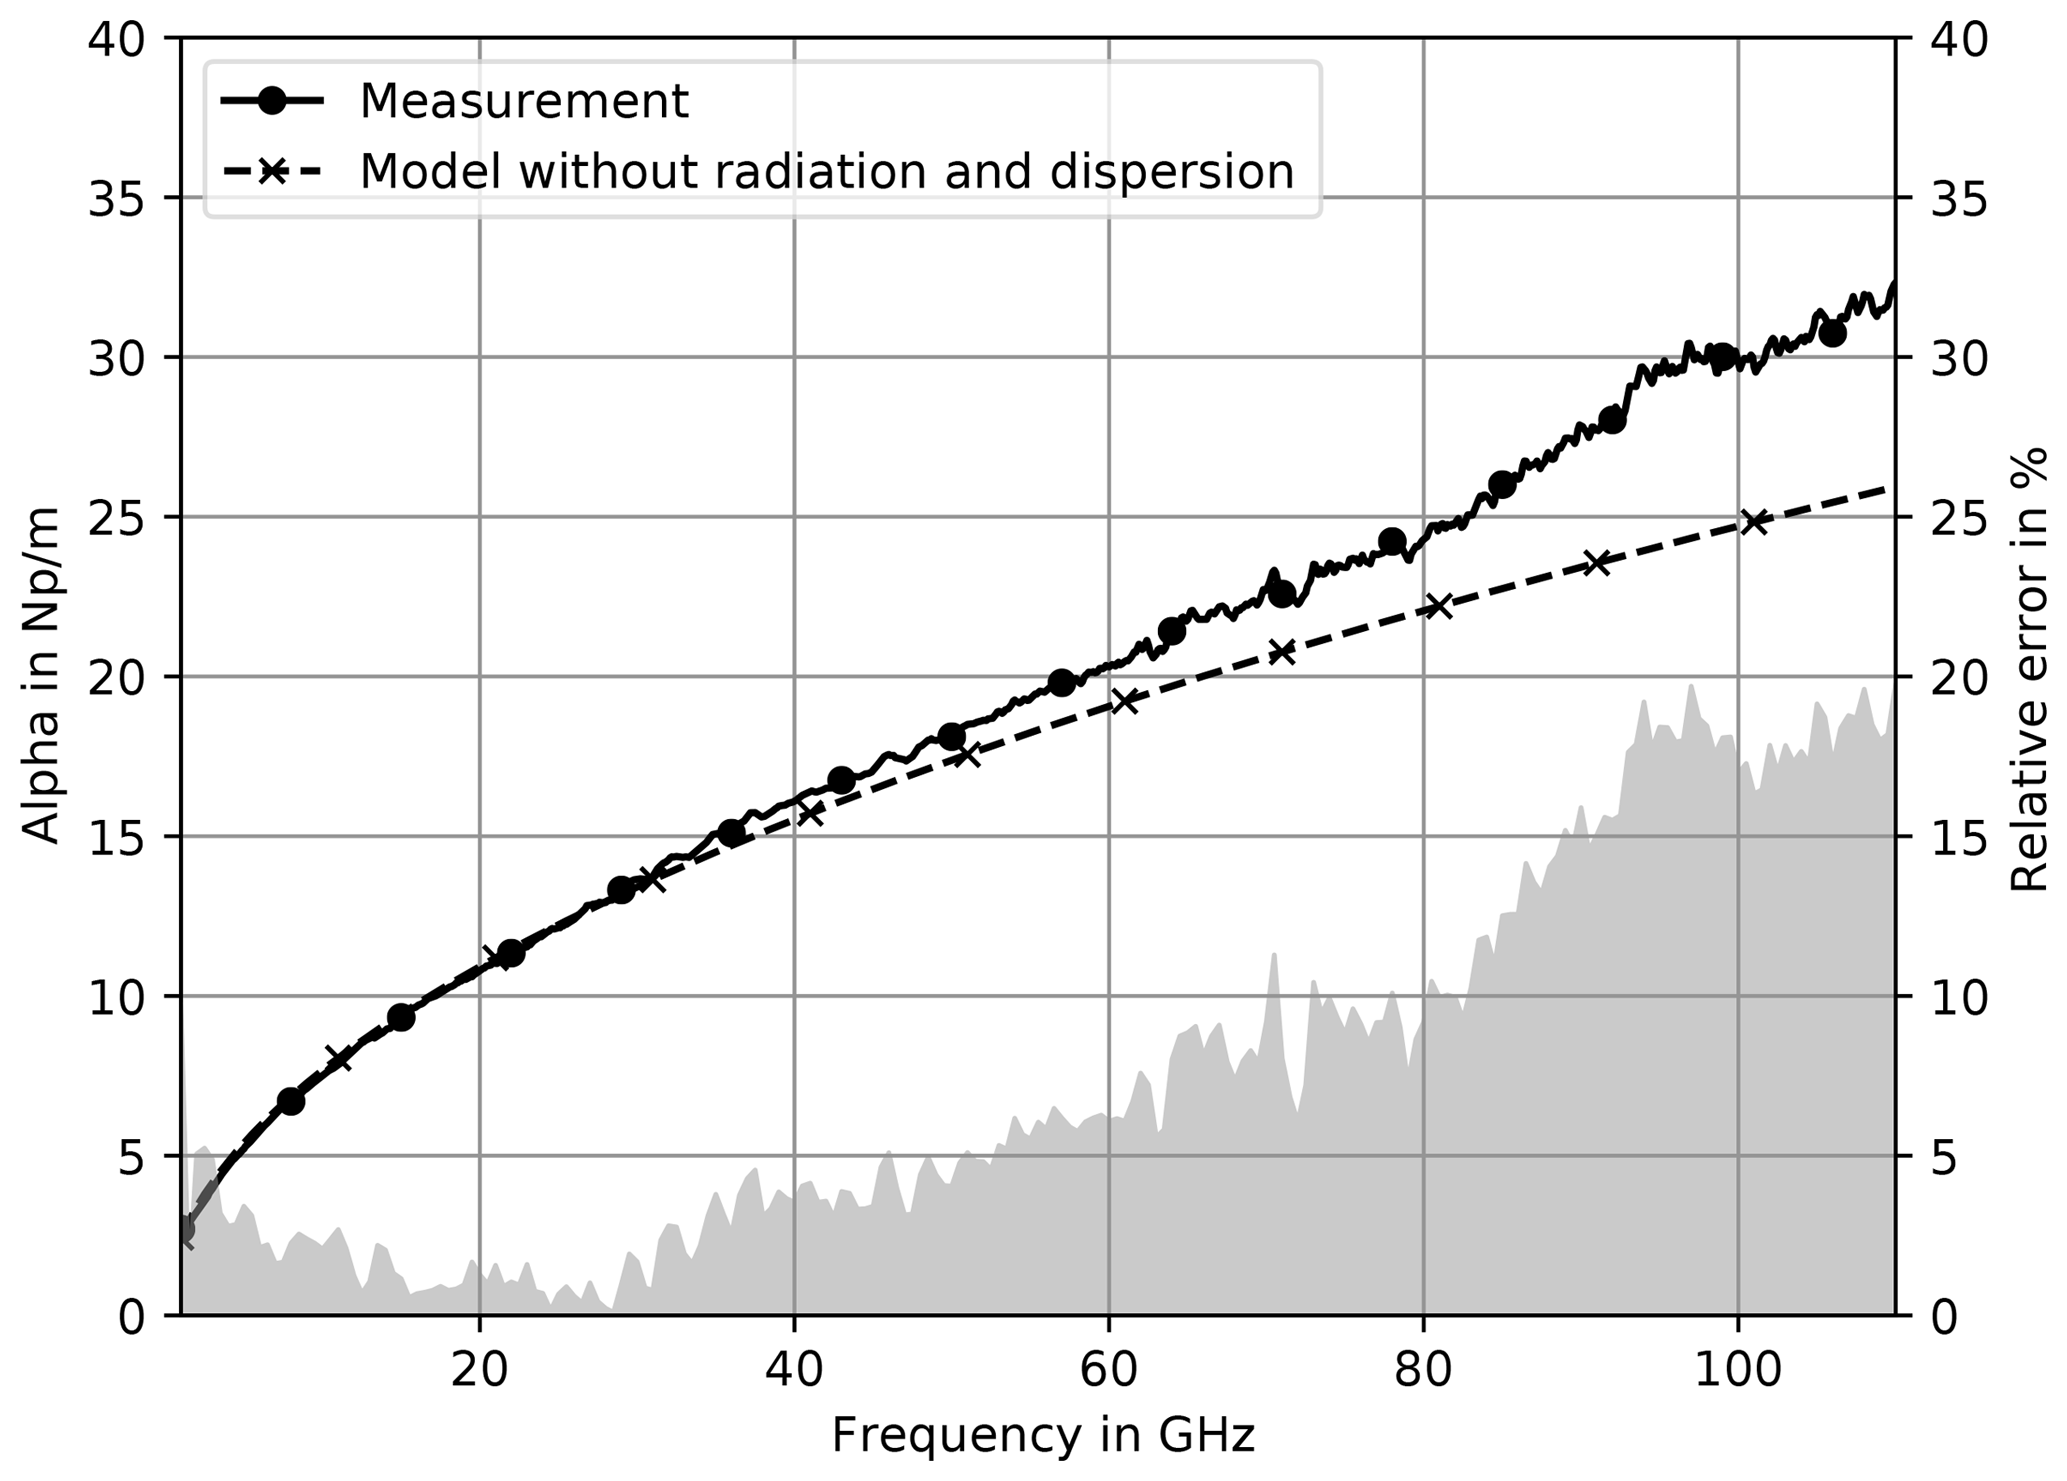
Figure 2Measured and simulated attenuation on metal chuck. The simulation does neither include radiation and dispersion nor surface roughness.
The simulation is in good agreement with the measured responses at lower frequencies. The deviation of simulated and measured attenuation gets significant above 40 GHz. The effective rel. permittivities in Fig. 3 mainly show an offset, which could be explained by uncertainties in εr of substrate, metallization thickness t or surface roughness impact. Besides this, the shape of the response clearly drift apart above 40 GHz.

Figure 3Measured and simulated effective rel. permittivity on metal chuck. The simulation does neither include radiation and dispersion nor surface roughness.
3.2 CPW Model with radiation and dispersion
The CPW model (Schnieder et al., 2003) is an extension to the quasi-TEM model (Heinrich, 1993) now considering radiation and dispersion effects. As a result, it delivers an attenuation response (Fig. 4), that adapts the measured response much better.
Particularly, with regard to the bend towards higher attenuation that is observed above 60 GHz. This response strongly differs from the one calculated with the quasi-TEM model having only a - and f-dependency and the relative error decreases below 10 %. Including dispersion effects in the model also leads to a simulated effective permittivity (Fig. 5) which shows a similar response as the measured one. Especially, the increase of phase delay above 60 GHz is now depicted. The relative error stays below 3 % and indicates a merely constant offset over the entire frequency range.
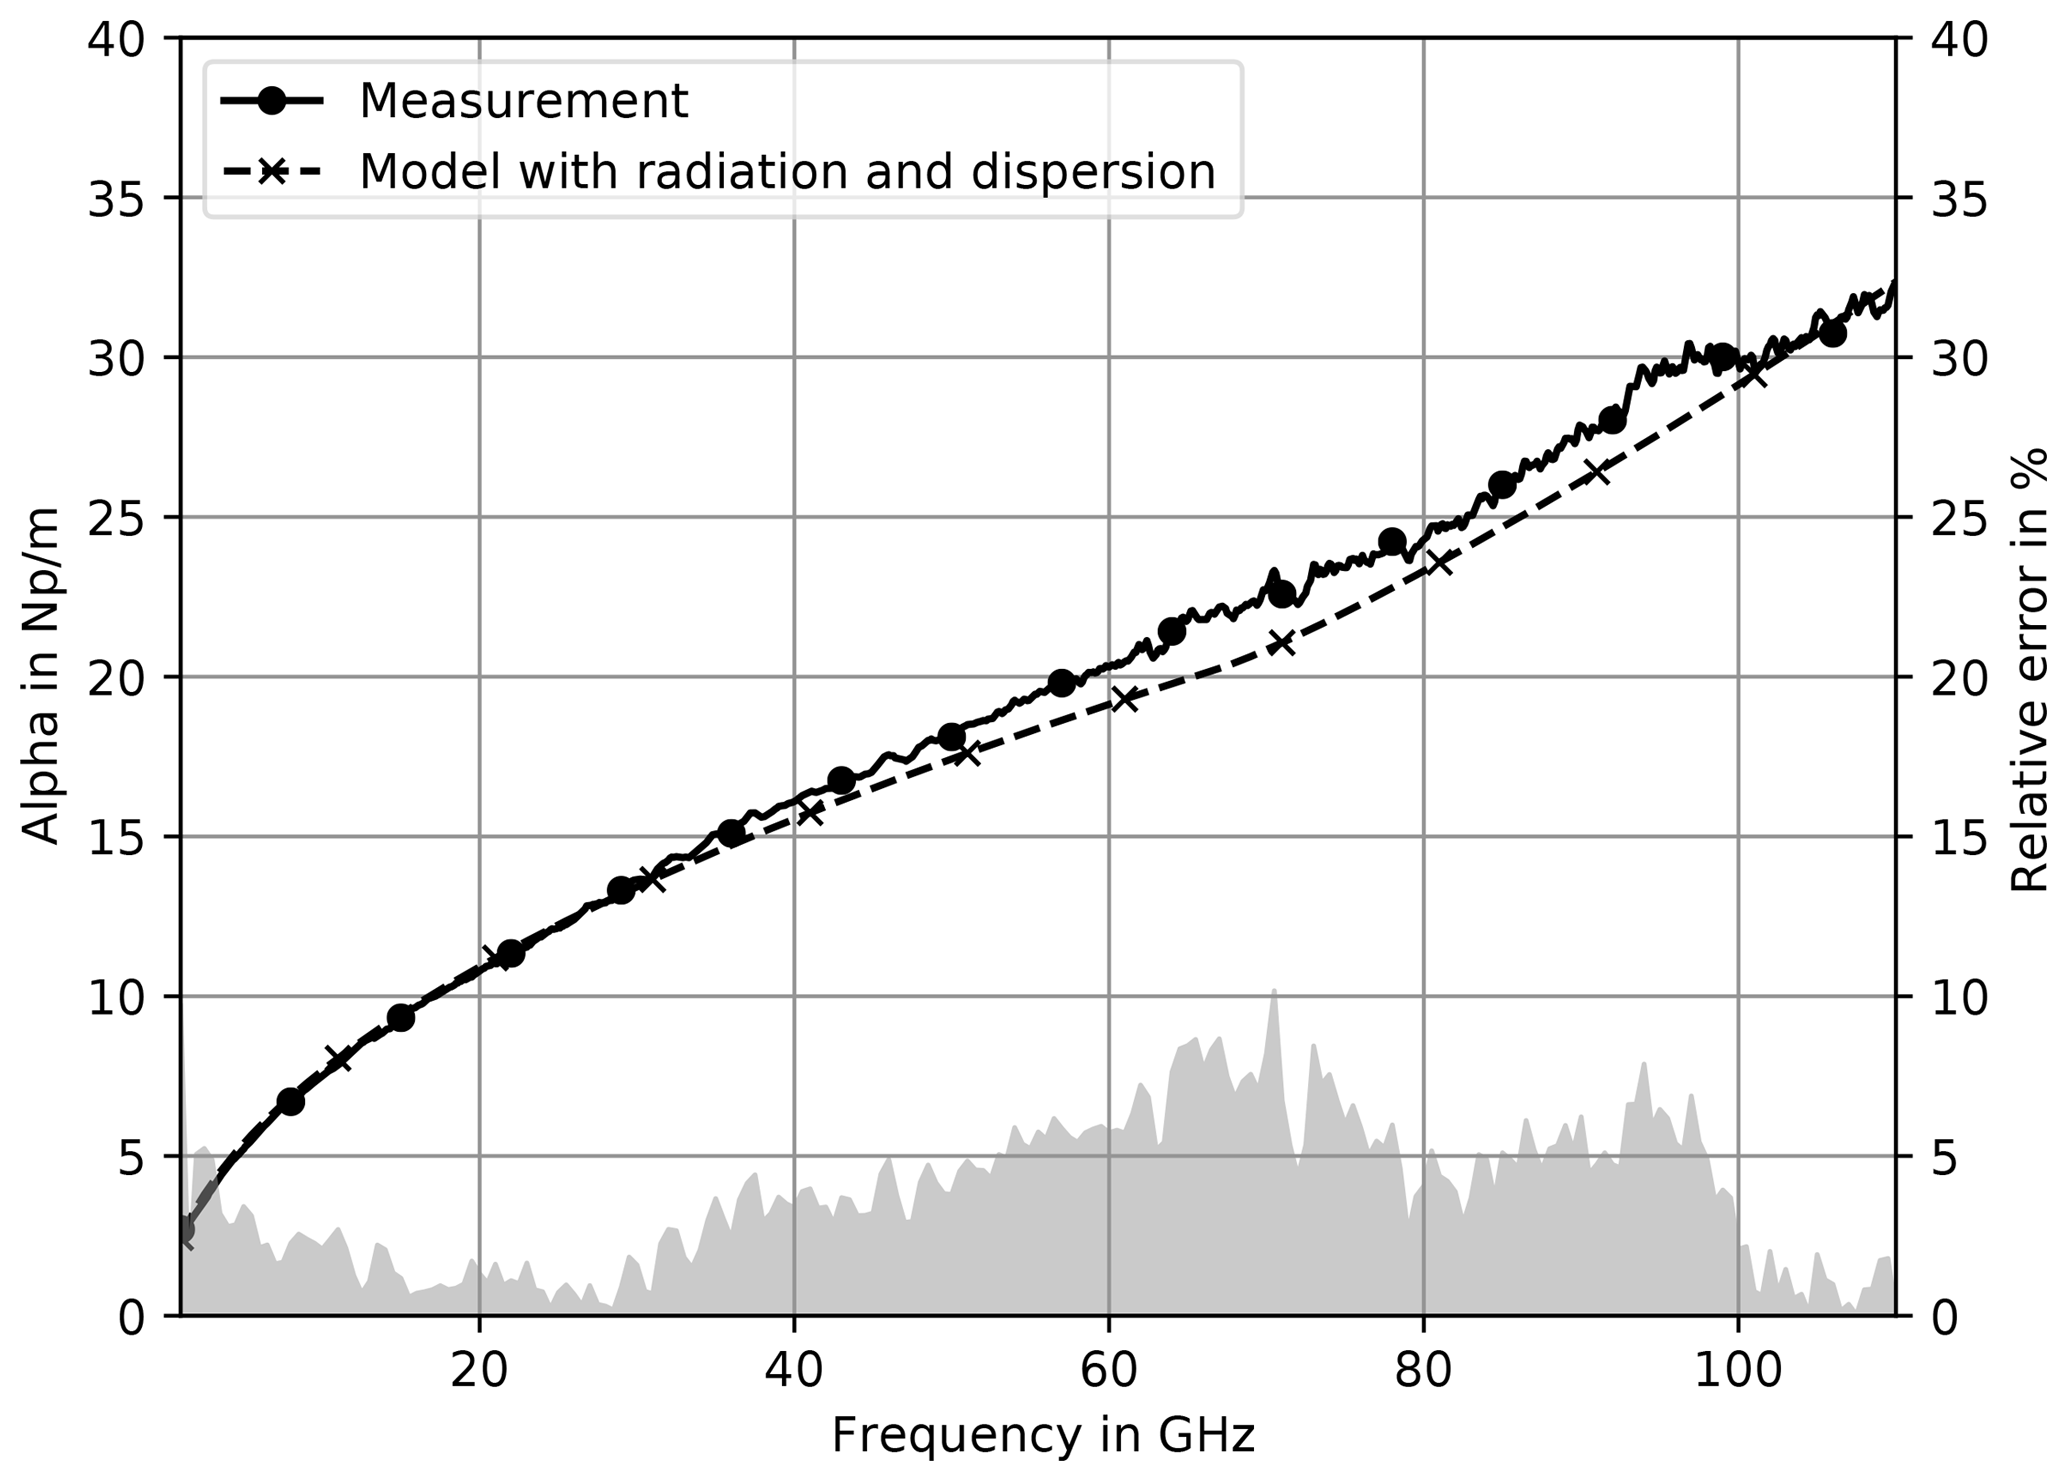
Figure 4Measured and simulated attenuation on metal chuck. The simulation includes radiation and dispersion.
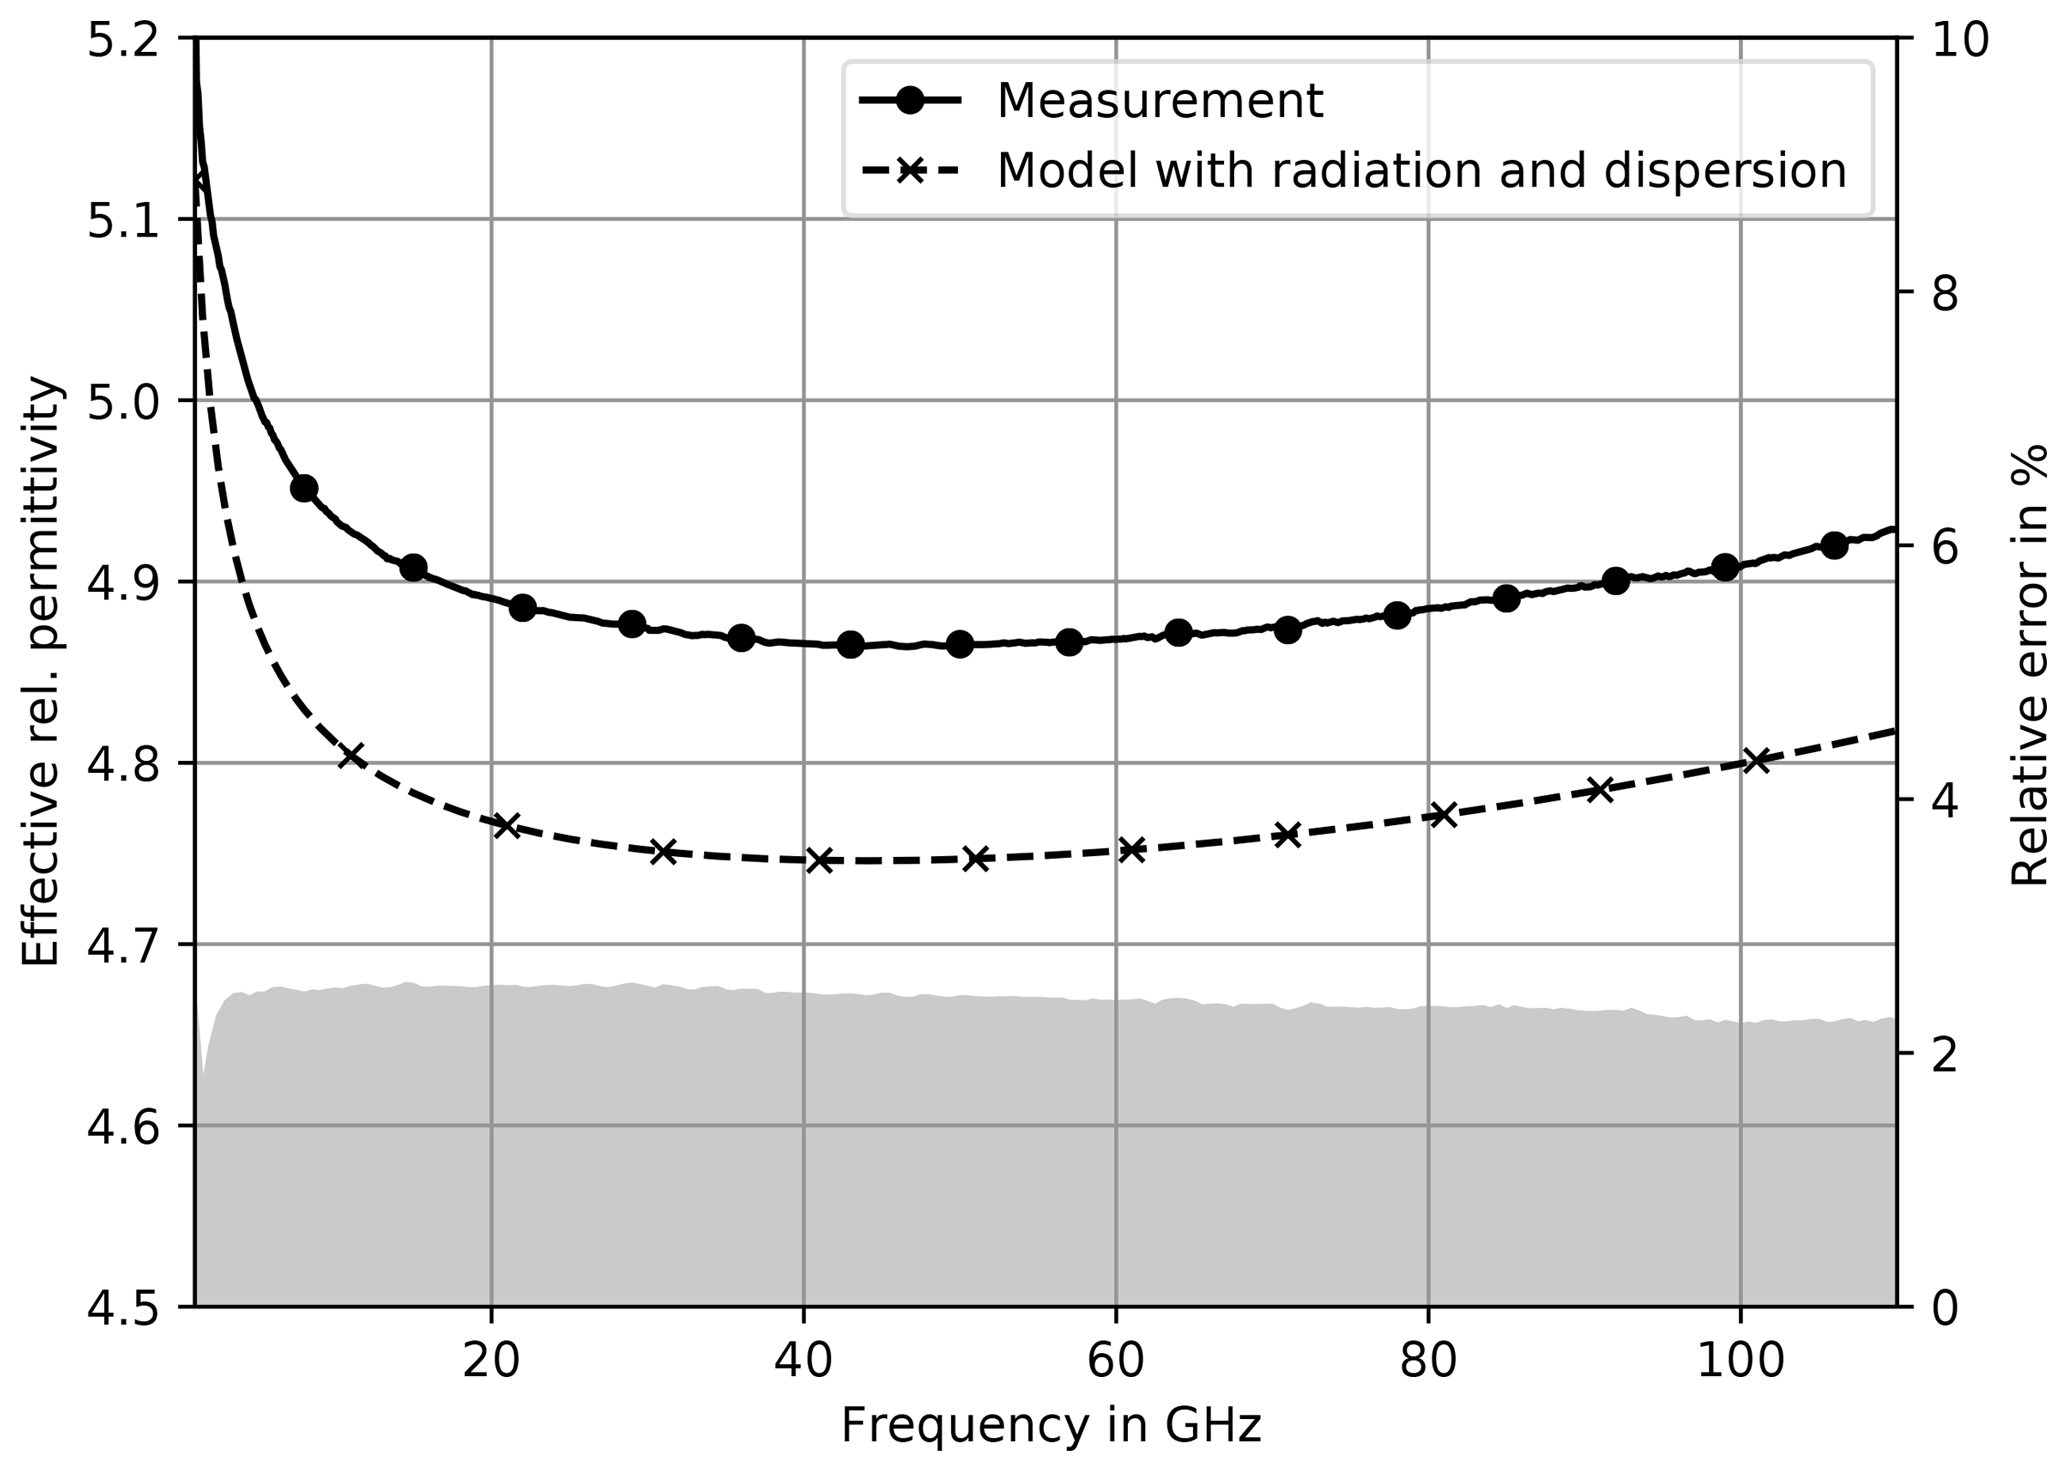
Figure 5Measured and simulated effective rel. permittivity on metal chuck. The simulation includes radiation and dispersion.
3.3 Surface Roughness
Generally a model should have an underlying physical notion, a minimum number of parameters and of course it must predict measurement results with reasonable accuracy. Especially a model for the interaction of electromagnetic fields with rough surfaces should utilize input parameters for surface properties, that are well known and specified in surface metrology. For example the RMS1-roughness Rq is an estimate for the standard deviation of the surface profile from the mean surface. It is defined in ISO 4287 (1997-04) among other surface texture parameters.
The Gradient Model presented by Gold and Helmreich (2012) fulfills the stated requirements and is capable of predicting roughness impact on both loss and delay. Therefore the rough surface is modeled by a continuous conductivity transition from the dielectric to the bulk conductivity σDC. In the following the parameter x describes the depth counting positively into the material. For surface profiles that are distributed normally, it only requires one additional parameter, the RMS-roughness Rq to calculate the conductivity profile:
Many surface profile measurement systems like tactile or optical ones not only deliver statistical parameters, but also the bearing area curve (BAC) or Abott-Firestone curve (Abbott and Firestone, 1933), which corresponds to a cumulative probability density function. In cases of not very random surface profiles, such as with chatter marks for example, the Gradient Model is also capable of dealing with the measured BAC directly.
3.3.1 Surface Profile Measurements
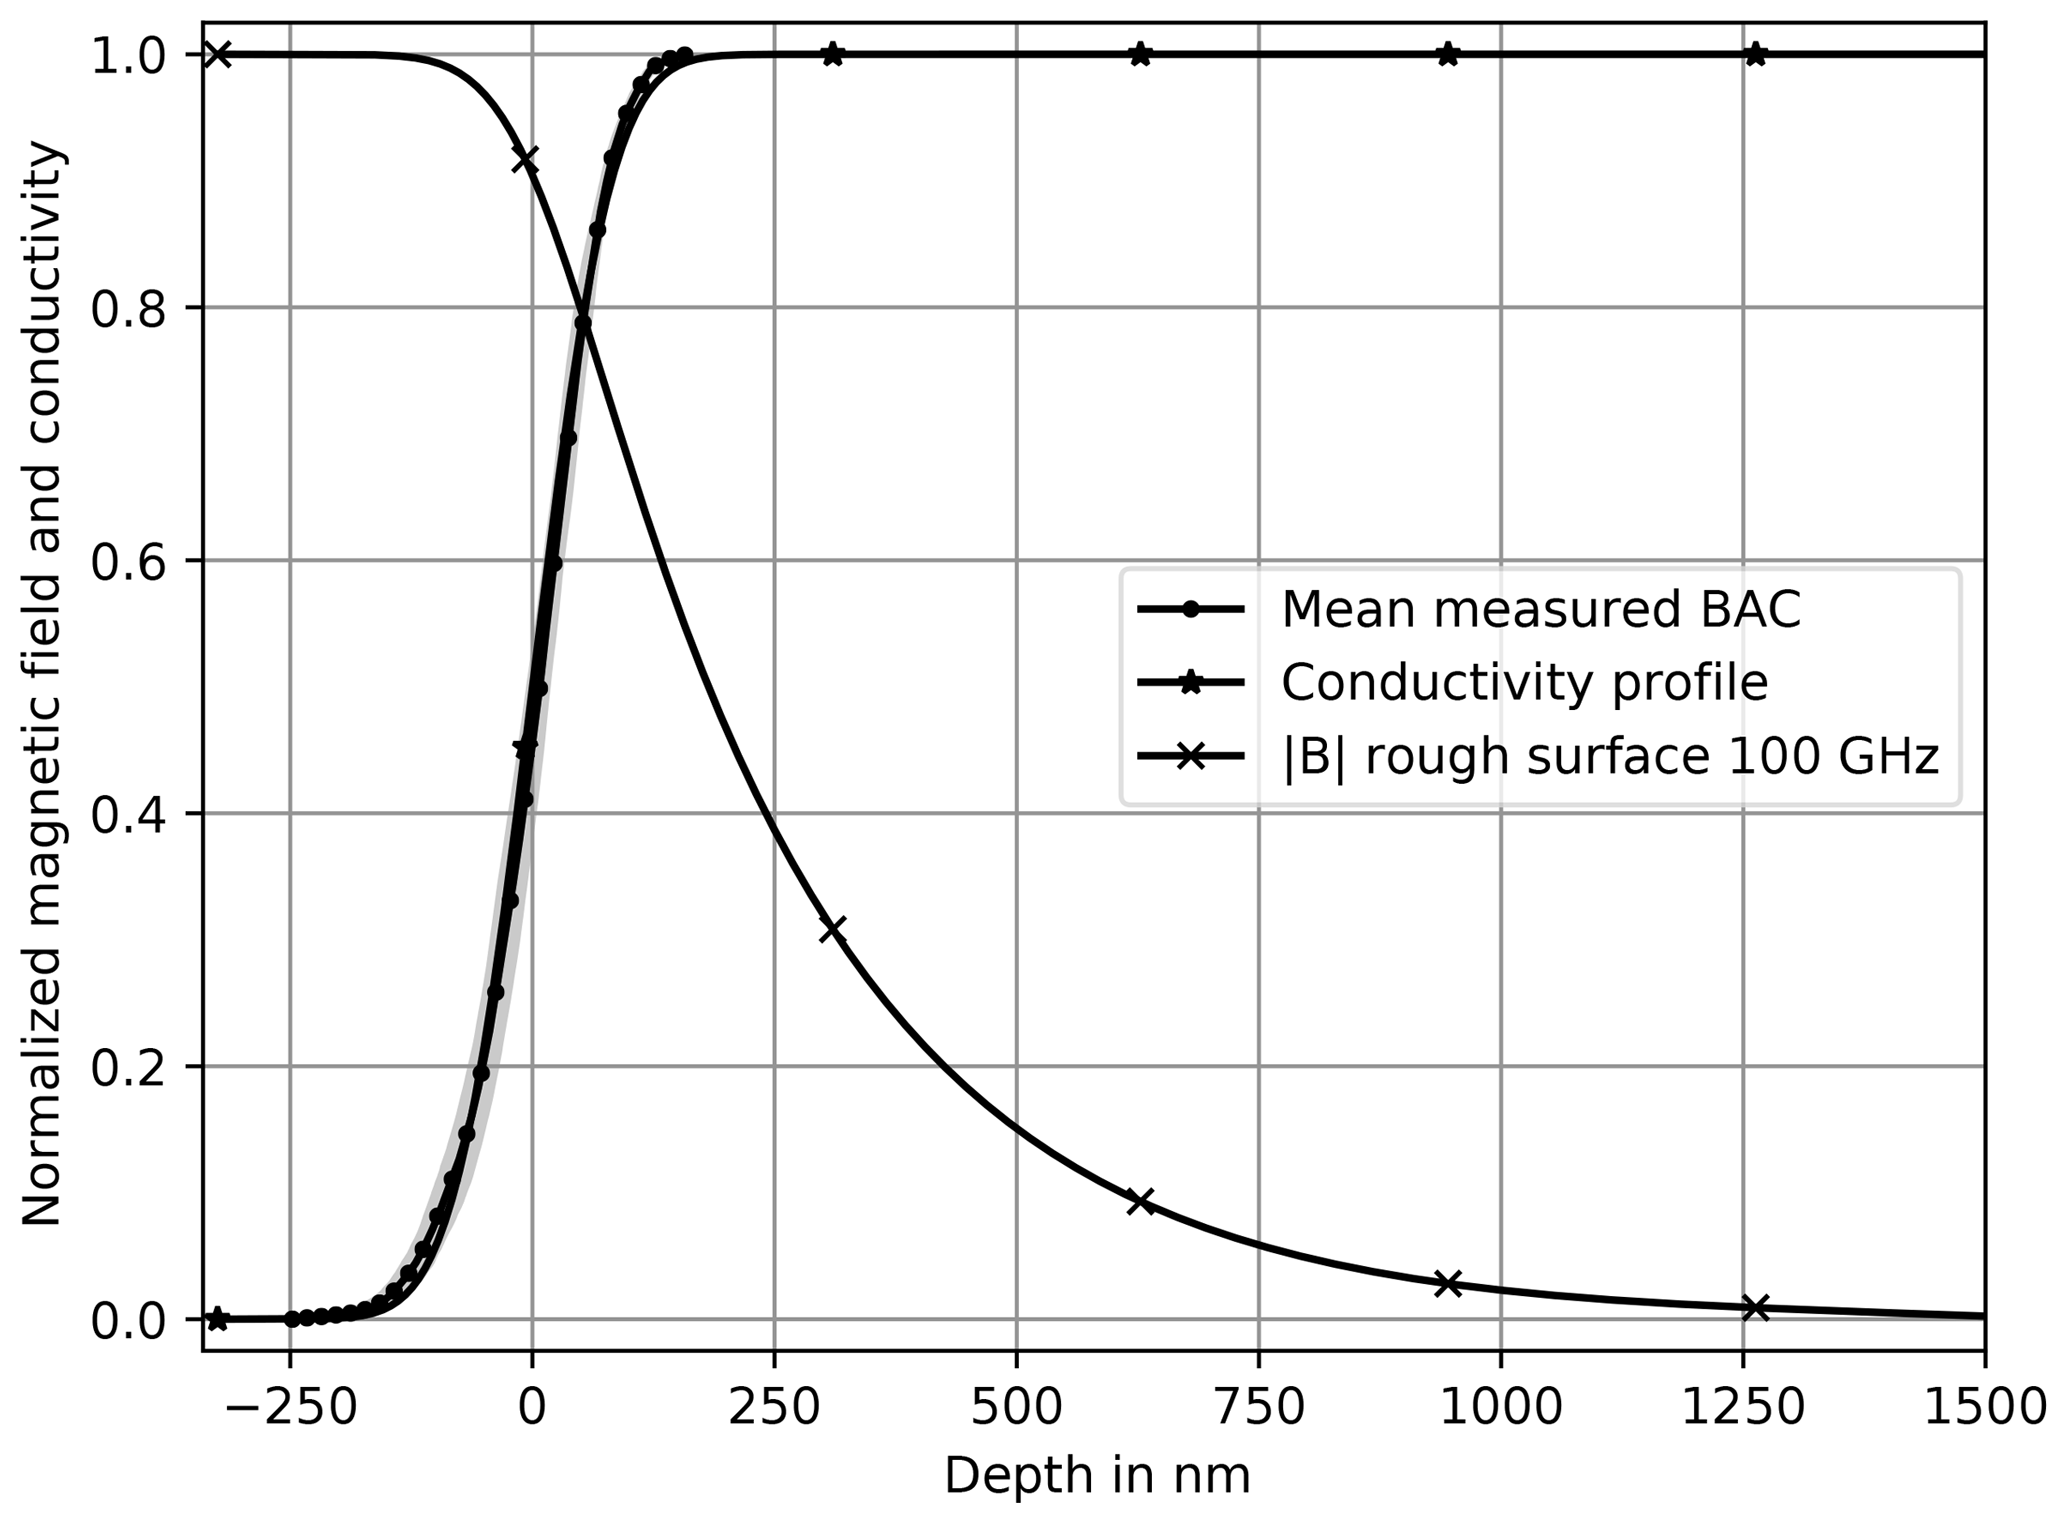
The mean response from four BAC measurements at the top of the Al2O3 wafer metallization is shown in Fig. 6. The standard deviation is marked gray in the background. From the mean BAC, Rq was estimated to be Rq=63.5 nm. Then again a CDF can be calculated with Eq. (2), which is also shown in Fig. 6 and multiplied with σDC used as conductivity profile to calculate the magnetic field in the rough surface. It can be clearly seen, that the magnitude of the magnetic field differs from an exponential function, which is the solution of classical skin effect for ideally smooth surfaces.
3.3.2 Application using effective material parameters
From the magnetic field all other relevant quantities, e.g. loss power density, magnetic field energy, etc. can be calculated. Since most analytical transmission line models assume ideally smooth surfaces, the application of the Gradient Model utilizing effective, frequency dependent material parameter was shown in Gold and Helmreich (2017). The effective conductivity σeff represents roughness impact on loss (R′) and the effective permeability μr, eff the impact on inner inductance (). They are determined by comparing loss power density or magnetic field energy of the rough and smooth surface respectively. The responses for Rq=63.5 nm are shown in Fig. 7. In this case, the effective material values are different from the ideal case, i.e. σeff=σDC and but relatively close to it. That is because even for 100 GHz the skin depth is roughly four times larger than Rq. Or in other words the conductors are very smooth – but not ideally smooth – in the regarded frequency range.
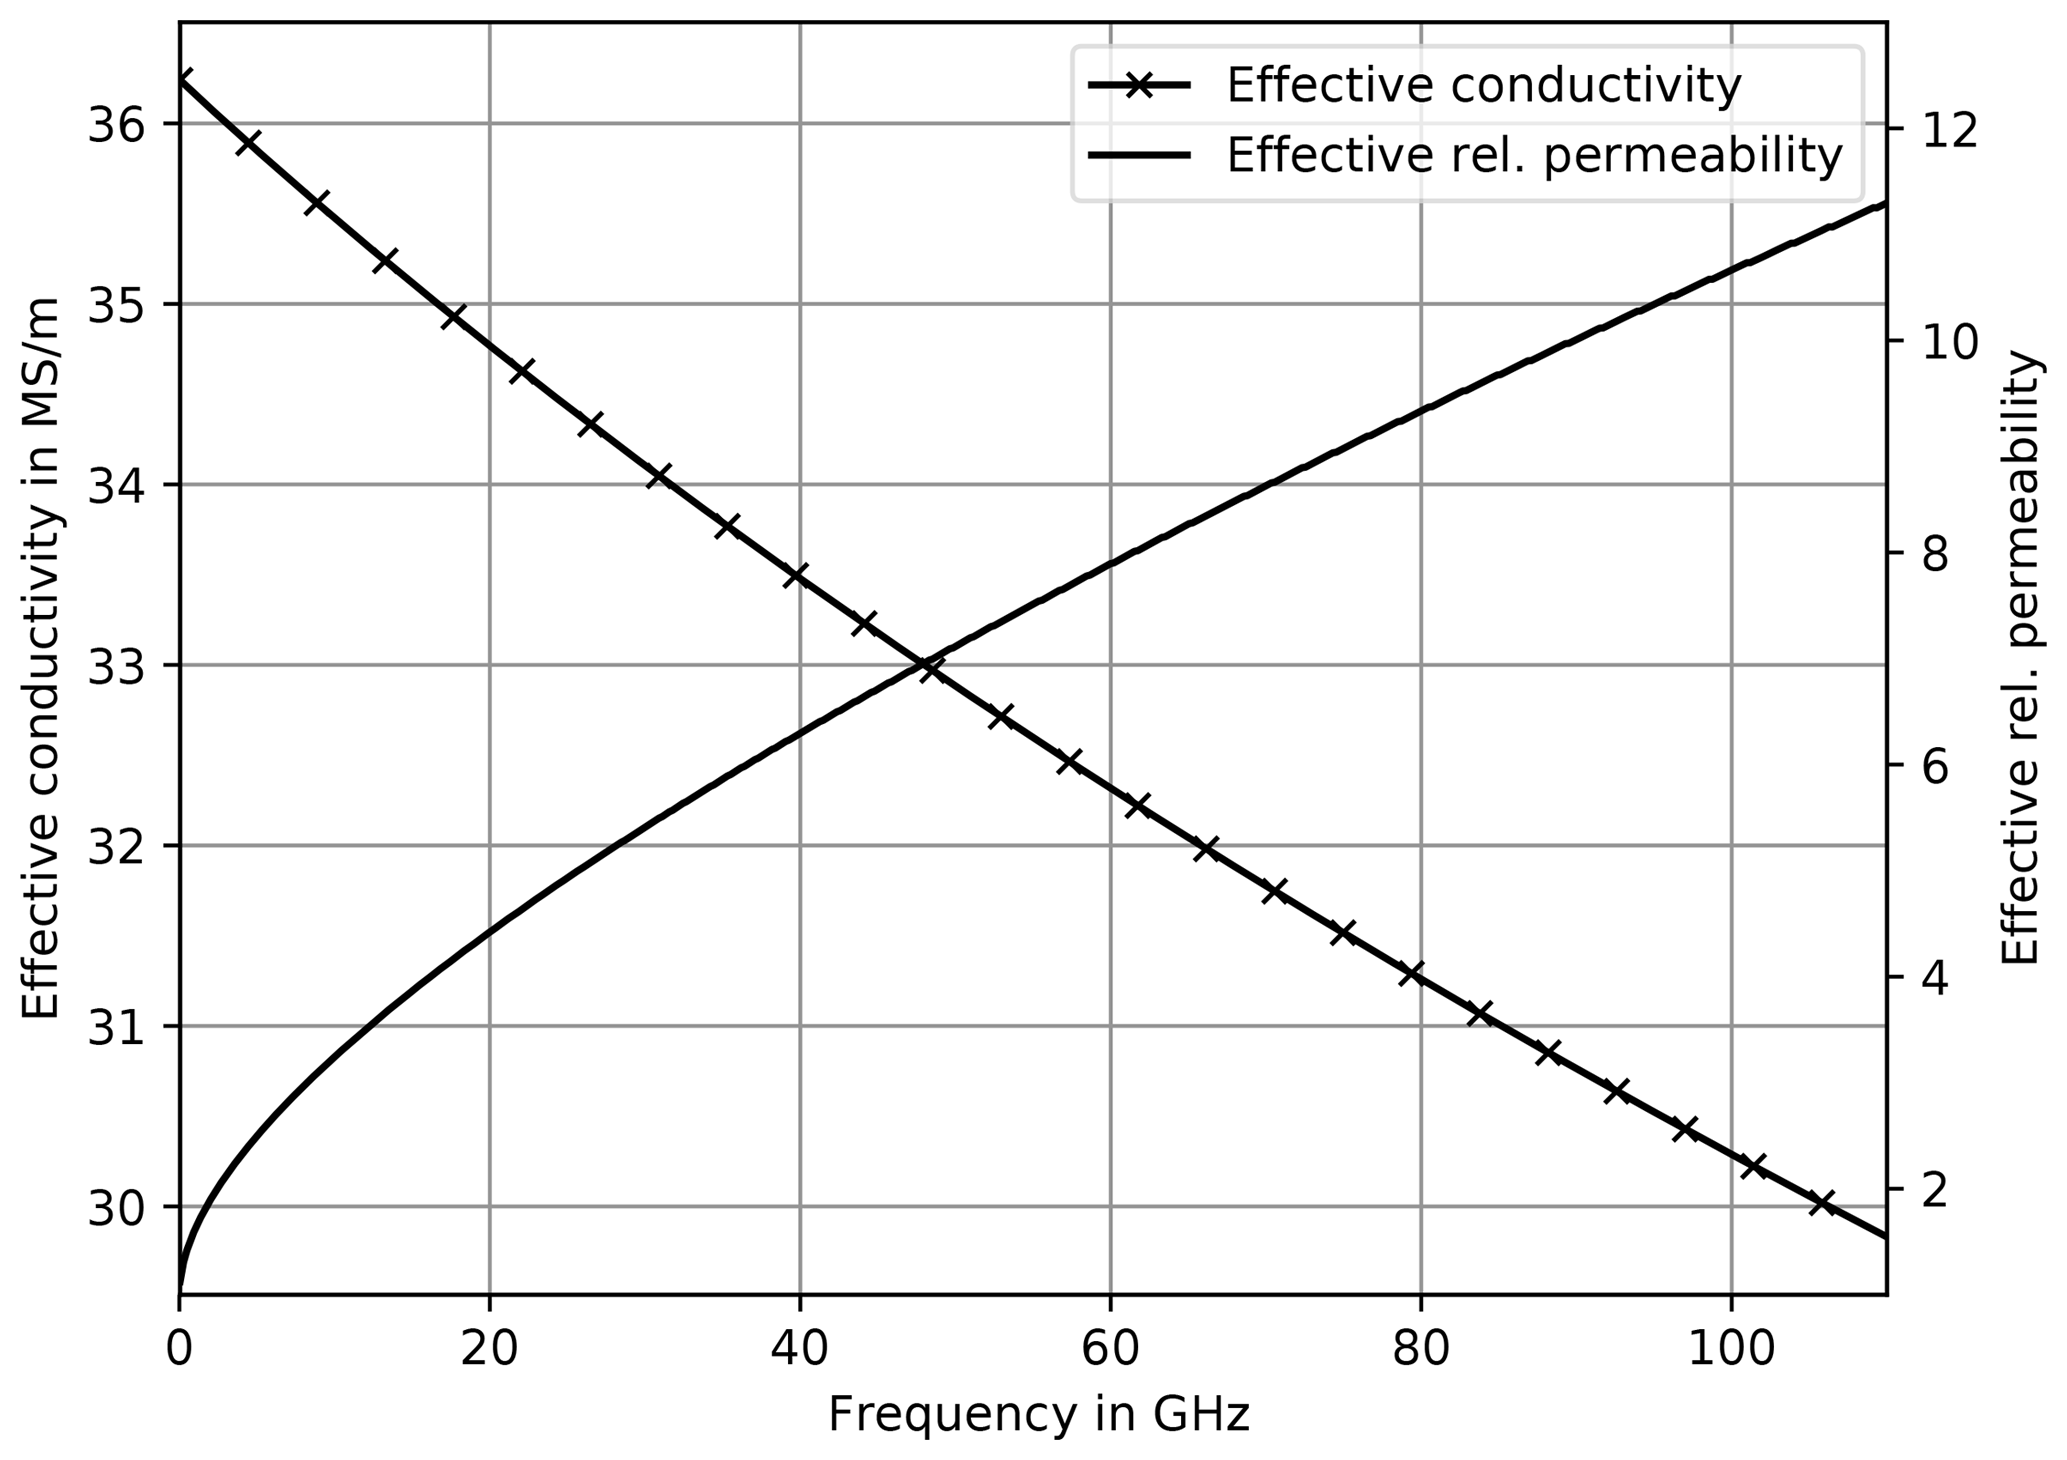
Figure 7Decreasing effective conductivity σeff and increasing effective permeability μr, eff for Rq=63.5 nm.
3.4 CPW Model with radiation, dispersion and roughness
The advantage of using effective material parameters to depict roughness impact is, that they can be utilized in any model assuming ideally smooth surfaces. This is done by simply replacing material with effective material parameters, one only has to take care of their frequency dependence.
The CPW model distinguishes three frequency sections: The quasi-static case, a transition region and the skin effect region. Since the Gradient Model assumes the skin effect, only skin effect and transition region has to be adapted. In the latter, the conductivity σ is replaced by σeff in the pul parameter R′:
where index “c” denotes the signal and “g” the ground conductor traces respectively. The effective permeability μr, eff is added to pul inductance L′ in this region denoted as Lz2:
In the skin effect region the modifications of the pul resistances , are as follows:
The pul inductance L′ in the skin effect region becomes:
From the original document (Heinrich, 1993) only Eqs. (6), (7), (9) and expressions for , and were modified. The variables FL and F0 are geometry factors and are also derived in (Heinrich, 1993). All other equations can be left untouched.
As a result we obtain a model including most known parasitics, that can precisely predict propagation properties of CPWs. The additional consideration of surface roughness impact leads to an improvement in the frequency range from 50 to 100 GHz regarding the attenuation in Fig. 8 utilizing a metal chuck. The relative error stays below 5 % up to 100 GHz. Above 100 GHz measurement uncertainties become larger due to influences from parasitic modes such as e.g. substrate modes.
The surface roughness impact on phase delay and effective rel. permittivity respectively is typically nearly constant over the regarded frequency range (Fig. 9), so that the simulated and measured responses only lead to an effective error below 0.5 %.

Figure 8Measured and simulated attenuation on metal chuck. The simulation includes radiation, dispersion and roughness.
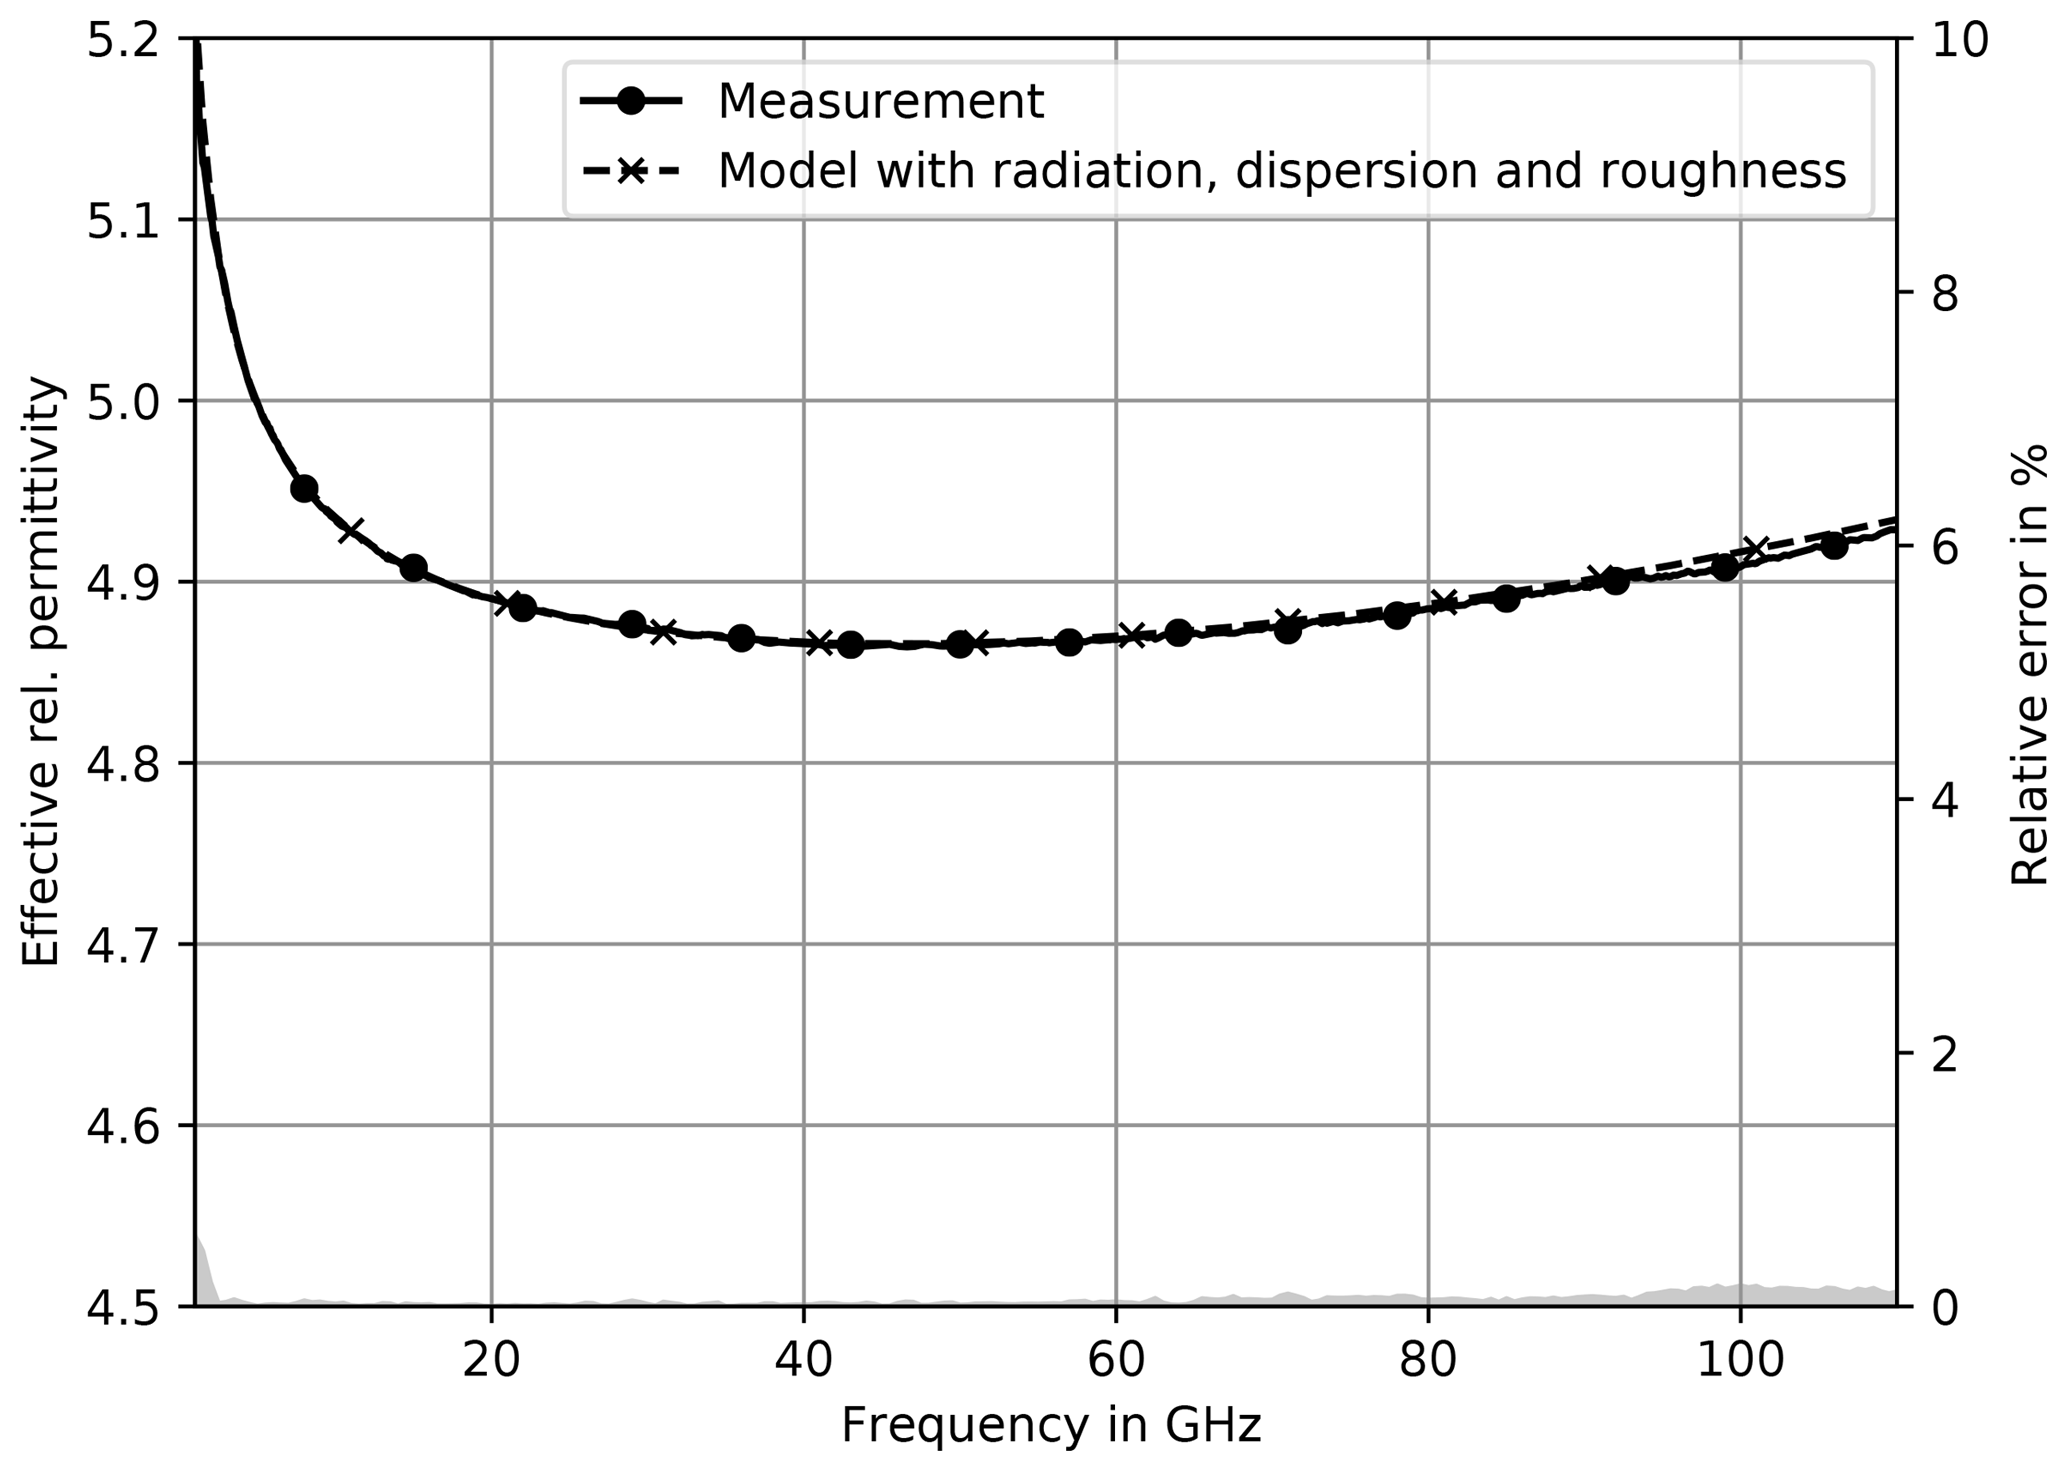
Figure 9Measured and simulated effective rel. permittivity on metal chuck. The simulation includes radiation, dispersion and roughness.
Measurements of the same wafer on a ceramic chuck lead to slightly different results. Especially, the attenuation does not show a distinctive bend above 60 GHz. Figure 10 shows, that it is much closer to a - and f-dependency than the responses obtained from measurements utilizing a metal chuck.
In the simulation the ceramic chuck was considered by assuming an infinite substrate height, since it consists of a similar material.
Like in the case with metal chuck, the relative error only raises to noteworthy figures above 100 GHz.
Also the effective relative permittivity in case of a ceramic chuck is predicted very well, as can be seen in Fig. 11 with a similar relative error as for the measurements on a metal chuck.
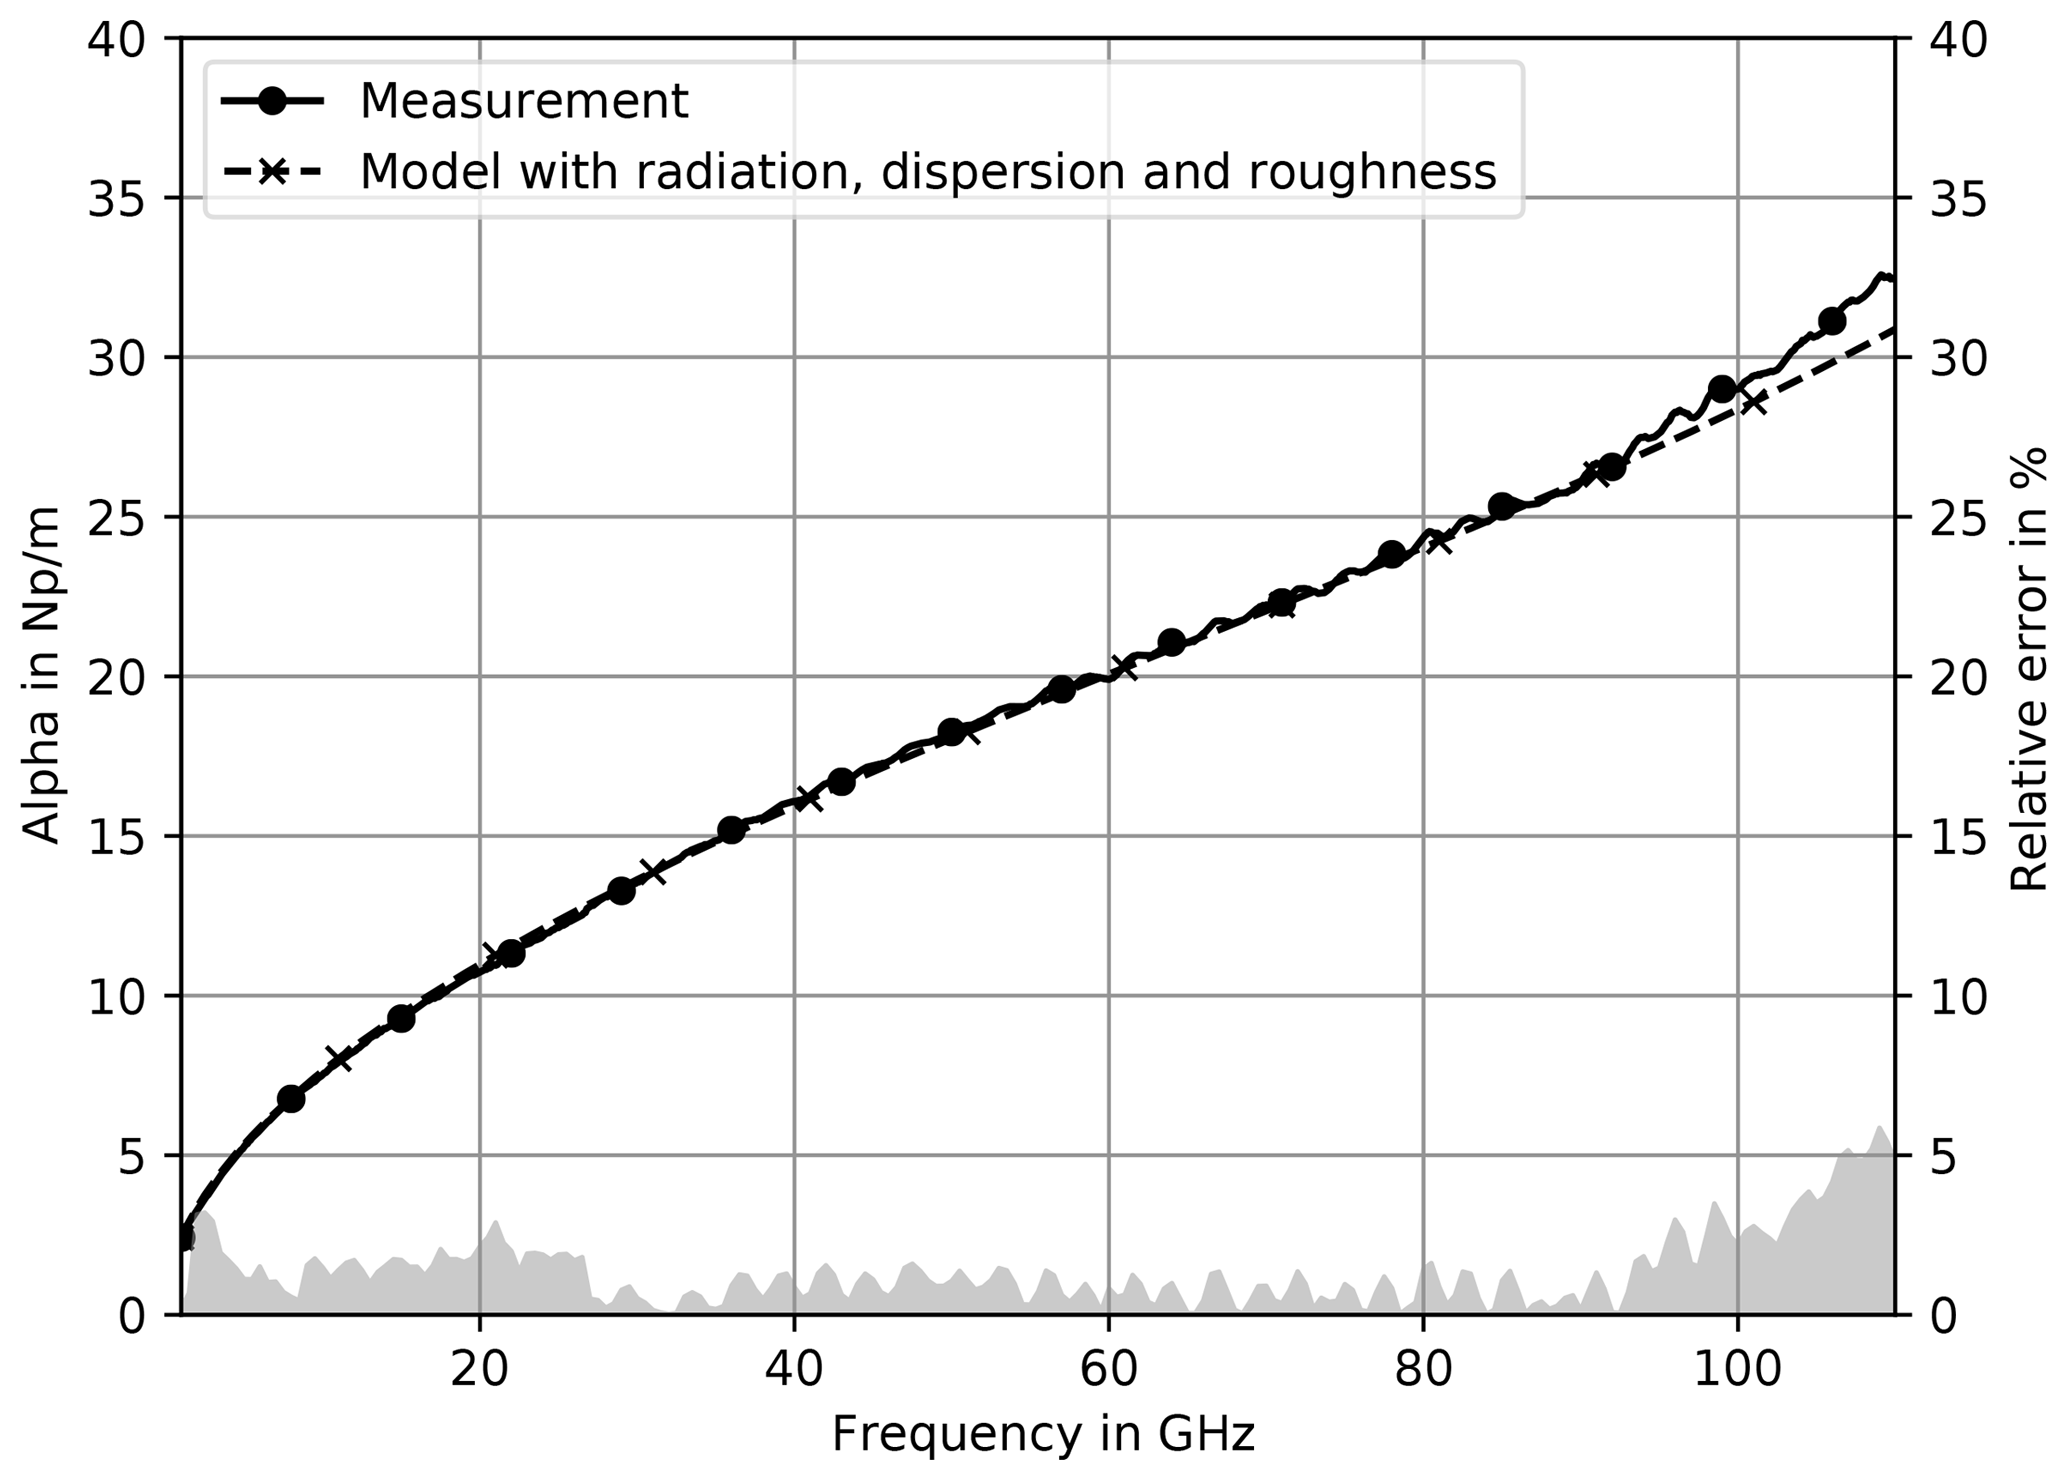
Figure 10Measured and simulated attenuation on ceramic chuck. The simulation includes radiation, dispersion and roughness.

Figure 11Measured and simulated effective rel. permittivity on ceramic chuck. The simulation includes radiation, dispersion and roughness.
An existing CPW model was expanded utilizing frequency dependent, effective material parameters. The necessary modifications were explained in detail. Those effective parameters are calculated with a surface roughness model that considers roughness impact on both phase and delay. Its input parameter, the RMS-roughness Rq, was estimated from measured bearing area curves. The obtained model now includes parasitics like dispersion, radiation and conductor surface roughness.
The DUT was fabricated on an Al2O3 substrate and was measured utilizing a ceramic and a metal chuck. The simulations with the extended model precisely predict the measured responses, i.e. attenuation and phase delay in both cases up to 100 GHz. The impact from dispersion and surface roughness on attenuation and effective relative permittivity was shown by successively including those parasitics in simulations.
Precise analytical transmission line models including parasitics are fundamental for developing reliable uncertainty budgets for calibration purposes and also have their importance in design.
The data are available from the authors upon request.
The authors declare that they have no conflict of interest.
The authors are grateful to Rohde & Schwarz for manufacturing the calibration substrate, to Thorsten Probst from PTB for performing the on-wafer measurements, and to Dylan Williams from NIST for providing the initial layout of the substrate.
Furthermore, the authors would like to thank Franz-Josef Schmückle from Ferdinand-Braun-Institute for supplying program code on radiation and dispersion effects of a CPW.
The authors acknowledge support by the European Metrology Programme for Innovation and Research (EMPIR) Project 14IND02 “Microwave measurements for planar circuits and components”. The EMPIR program is co-financed by the participating countries and from the European Union's Horizon 2020 research and innovation program.
This paper was edited by Thorsten Schrader and reviewed by two anonymous referees.
Abbott, E. and Firestone, F.: Specifying surface quality: a method based on accurate measurement and comparison, Mech. Eng., 55, 569–572, 1933. a
Arz, U., Zinal, S., Probst, T., Hechtfischer, G., Schmückle, F. J., and Heinrich, W.: Establishing traceability for on-wafer S-parameter measurements of membrane technology devices up to 110 GHz, in: 2017 90th ARFTG Microwave Measurement Symposium (ARFTG), Boulder, CO, 1–4, https://doi.org/10.1109/ARFTG.2017.8255874, 2017. a
Gold, G. and Helmreich, K.: A Physical Model for Skin Effect in Rough Surfaces, in: 2012 7th European Microwave Integrated Circuit Conference, Amsterdam, 631–634, 2012. a, b
Gold, G. and Helmreich, K.: A Physical Surface Roughness Model and Its Applications, IEEE T. Microw. Theory, 65, 3720–3732, https://doi.org/10.1109/TMTT.2017.2695192, 2017. a
Heinrich, W.: Quasi-TEM description of MMIC coplanar lines including conductor-loss effects, IEEE T. Microw. Theory, 41, 45–52, https://doi.org/10.1109/22.210228, 1993. a, b, c, d, e
ISO 4287: Geometrical product specification (GPS) Surface texture: Profile method; Terms, definitions and surface texture parameters, ISO, the International Organization for Standardization, 1997. a
Janezic, M. D.: Nondestructive Relative Permittivity and Losstangent Measurements Using a Split-cylinder Resonator, PhD dissertation, University of Colorado, Boulder, 2003. a
Marks, R. B.: A multiline method of network analyzer calibration, IEEE T. Microw. Theory, 39, 1205–1215, https://doi.org/10.1109/22.85388, 1991. a
Phung, G. N., Schmückle, F. J., Doerner, R., Heinrich, W., Probst, T., and Arz, U.: Impact of Substrate Modes on mTRL-Calibrated CPW Measurements in G Band, in: 2018 48th European Microwave Conference (EuMC), Madrid, 194–197, https://doi.org/10.23919/EuMC.2018.8541813, 2018a. a
Phung, G. N., Schmückle, F. J., Doerner, R., Heinrich, W., Probst, T., and Arz, U.: Effects Degrading Accuracy of CPW mTRL Calibration at W Band, in: 2018 IEEE/MTT-S International Microwave Symposium – IMS, Philadelphia, 1296–1299, https://doi.org/10.1109/MWSYM.2018.8439837, 2018b. a
Schmückle, F. J., Doerner, R., Phung, G. N., Heinrich, W., Williams, D., and Arz, U.: Radiation, multimode propagation, and substrate modes in W-band CPW calibrations, in: 2011 41st European Microwave Conference, Manchester, 297–300, https://doi.org/10.23919/EuMC.2011.6101804, 2011. a
Schnieder, F., Tischler, T., and Heinrich, W.: Modeling dispersion and radiation characteristics of conductor-backed CPW with finite ground width, IEEE T. Microw. Theory, 51, 137–143, https://doi.org/10.1109/TMTT.2002.806926, 2003. a, b
root mean square.