 | 10 Dec 2020
Near-Field Antenna Measurements with Manual Collection of the Measurement Samples
Hans-Jürgen Steiner
Thomas F. Eibert
Near-field measurements are commonly performed in anechoic chambers which limits the flexibility of the measurements and requires high precision equipment to achieve exact results. In this contribution, we investigate a simple near-field measurement setup which does not use any sophisticated positioning system nor operates in a controlled environment. Instead, the probe antenna is moved by an operator person while the probe position is measured by a laser tracker. This implies that the measurement results will have a higher error level in comparison with antenna chamber measurements. However, excellent error levels are not always necessary, especially when it comes to on-site testing of the principle functionality of antennas. Measurement results are shown to illustrate the performance of the system.
- Article
(9344 KB) - Full-text XML
- BibTeX
- EndNote


Antennas are usually characterized in terms of their far-field (FF) radiation pattern. An efficient method to obtain the pattern involves near-field (NF) measurements from which the FF can be calculated by a NF to FF transformation (NFFFT) (Yaghjian, 1986; Gregson et al., 2007; Parini et al., 2014). Such NF measurements are usually performed in anechoic chambers, since this echo free measurement environment is an acceptable approximation of free space. However, performing in-situ measurements becomes more relevant as the operation environment of an antenna may influence its performance. Moreover, many relevant antennas cannot be brought into antenna measurement chambers and the interest in portable and flexible antenna measurement solutions is, thus, growing. A key enabler of portable and flexible measurement solutions with irregular measurement locations and measurement probe orientations is the availability of an appropriate NFFFT algorithm, which is able to handle the collected measurement data. Advanced NFFFT algorithms such as the fast irregular antenna field transformation algorithm (FIAFTA) can perform such tasks and offer even additional diagnostic capabilities (Eibert et al., 2010, 2015). Another important property of this kind of transformation approach is its capability to consider the measurement environment at least in parts, e.g., by the consideration of a reflective ground half-space, either metallic or even dielectric (Mauermayer and Eibert, 2016; Eibert and Mauermayer, 2018), or by the direct modelling of scatterers (Yinusa et al., 2012).
A very sophisticated measurement system for high-quality measurements of antennas in assembly halls by utilizing an overhead crane is described in Geise et al. (2019). This system works with a measurement gondola positioned by the overhead crane where the exact position and orientation of the measurement probe is determined by a 6D laser tracking device.
Another even more flexible approach for the realization of in-situ measurements is the employment of a UAV which carries the probe antenna to the desired positions (Fritzel et al., 2016). First experiments and tests in the field of UAV-based antenna measurements are found in García-Fernández et al. (2017) and Virone et al. (2014). A severe problem with these published approaches is that the used receivers can only measure the magnitudes of the fields. Since available algorithms for phaseless NFFFTs are not yet accurate and reliable enough (Paulus et al., 2017), the results and error levels are still far from what is achievable with NF measurements performed in anechoic chambers.
Sometimes the exact characterization of an antenna in its real environment might not be necessary, since the principle antenna behavior is known and only the influence of the operation environment shall be revealed, e.g., of the mast carrying a radio broadcast antenna or other nearby scattering objects. Another application scenario is the verification of antennas mounted onto a satellite. Satellites are built on construction sites and then shipped thousands of kilometers to a spaceport for take-off to space. In this case, the antenna behavior is known and only the correct operation needs to be verified in a fast check-up because of possible damages due to packaging and transportation.
In this paper, we present a simple method for the NF measurement of antennas with manual collection of the field samples. Within traditional NF ranges, the probe antenna is commonly mounted on a positioning system which is capable of moving the antenna to a predefined position. Instead of using a sophisticated positioner or a UAV as mentioned before, the probe antenna is moved manually by an operator person. This implies that the position and orientation of the probe antenna are not exactly known from the positioning itself. To cope with this, the position of the probe antenna is measured by a laser tracker. The orientation data is not determined or measured at all and, therefore, introduces some uncertainty into the measurement data. Because of its simplicity, the measurement setup is very flexible for transportation and can be used for fast on-site testing of antennas.
The basic arrangement of such a measurement system was already described in Eibert et al. (2013). A similar system with manual movement of the field probe has recently been published in He et al. (2016) for field monitoring and for radar applications in Álvarez-Narciandi et al. (2019). The main difference to the system in this paper is the employed positioning system. In He et al. (2016) and Álvarez-Narciandi et al. (2019), an optical tracking system was employed while our system is based on a laser tracker. On the one hand, the optical tracking system provides orientation data of the probe while the laser tracker does not. On the other hand, the laser tracker is much more more flexible in terms of operation range and area while an optical tracking system has a limited range and is more applicable for indoor operation.
This paper is structured as follows. Section 2 describes the setup and hardware implementation of the measurement system. Measurement results for two different scanning geometries, quasi-planar and quasi-cylindrical, are presented in Sect. 3.
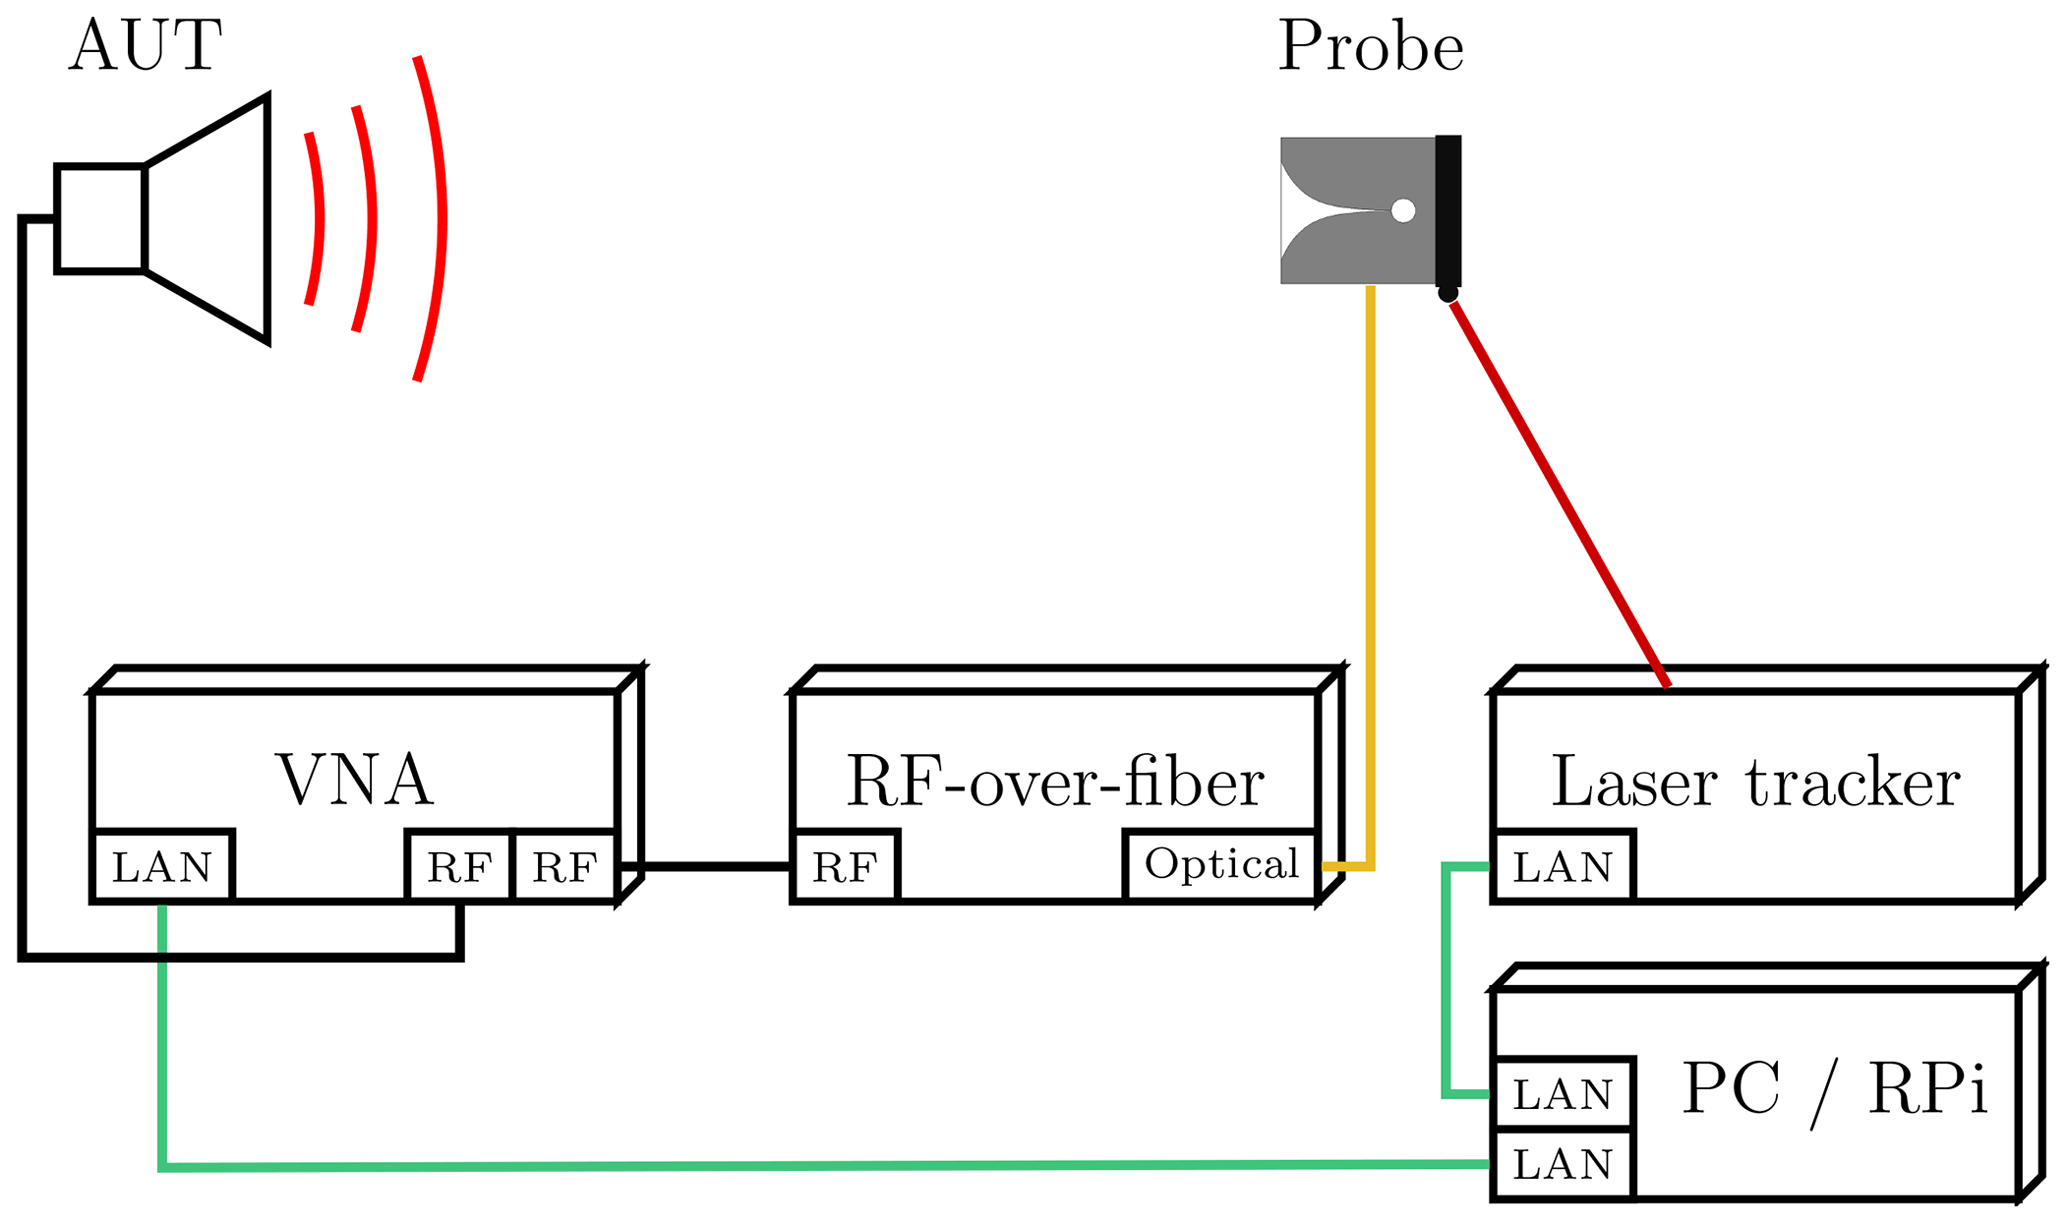
Figure 1Schematic drawing of the measurement setup. The field and position data of the manually moved probe antenna are recorded by a vector network analyzer (VNA) and a laser tracker, respectively. The probe antenna is connected by an optical fiber link to the VNA and a Raspberry Pi (RPi) is used to read and store the data from the VNA and laser tracker.
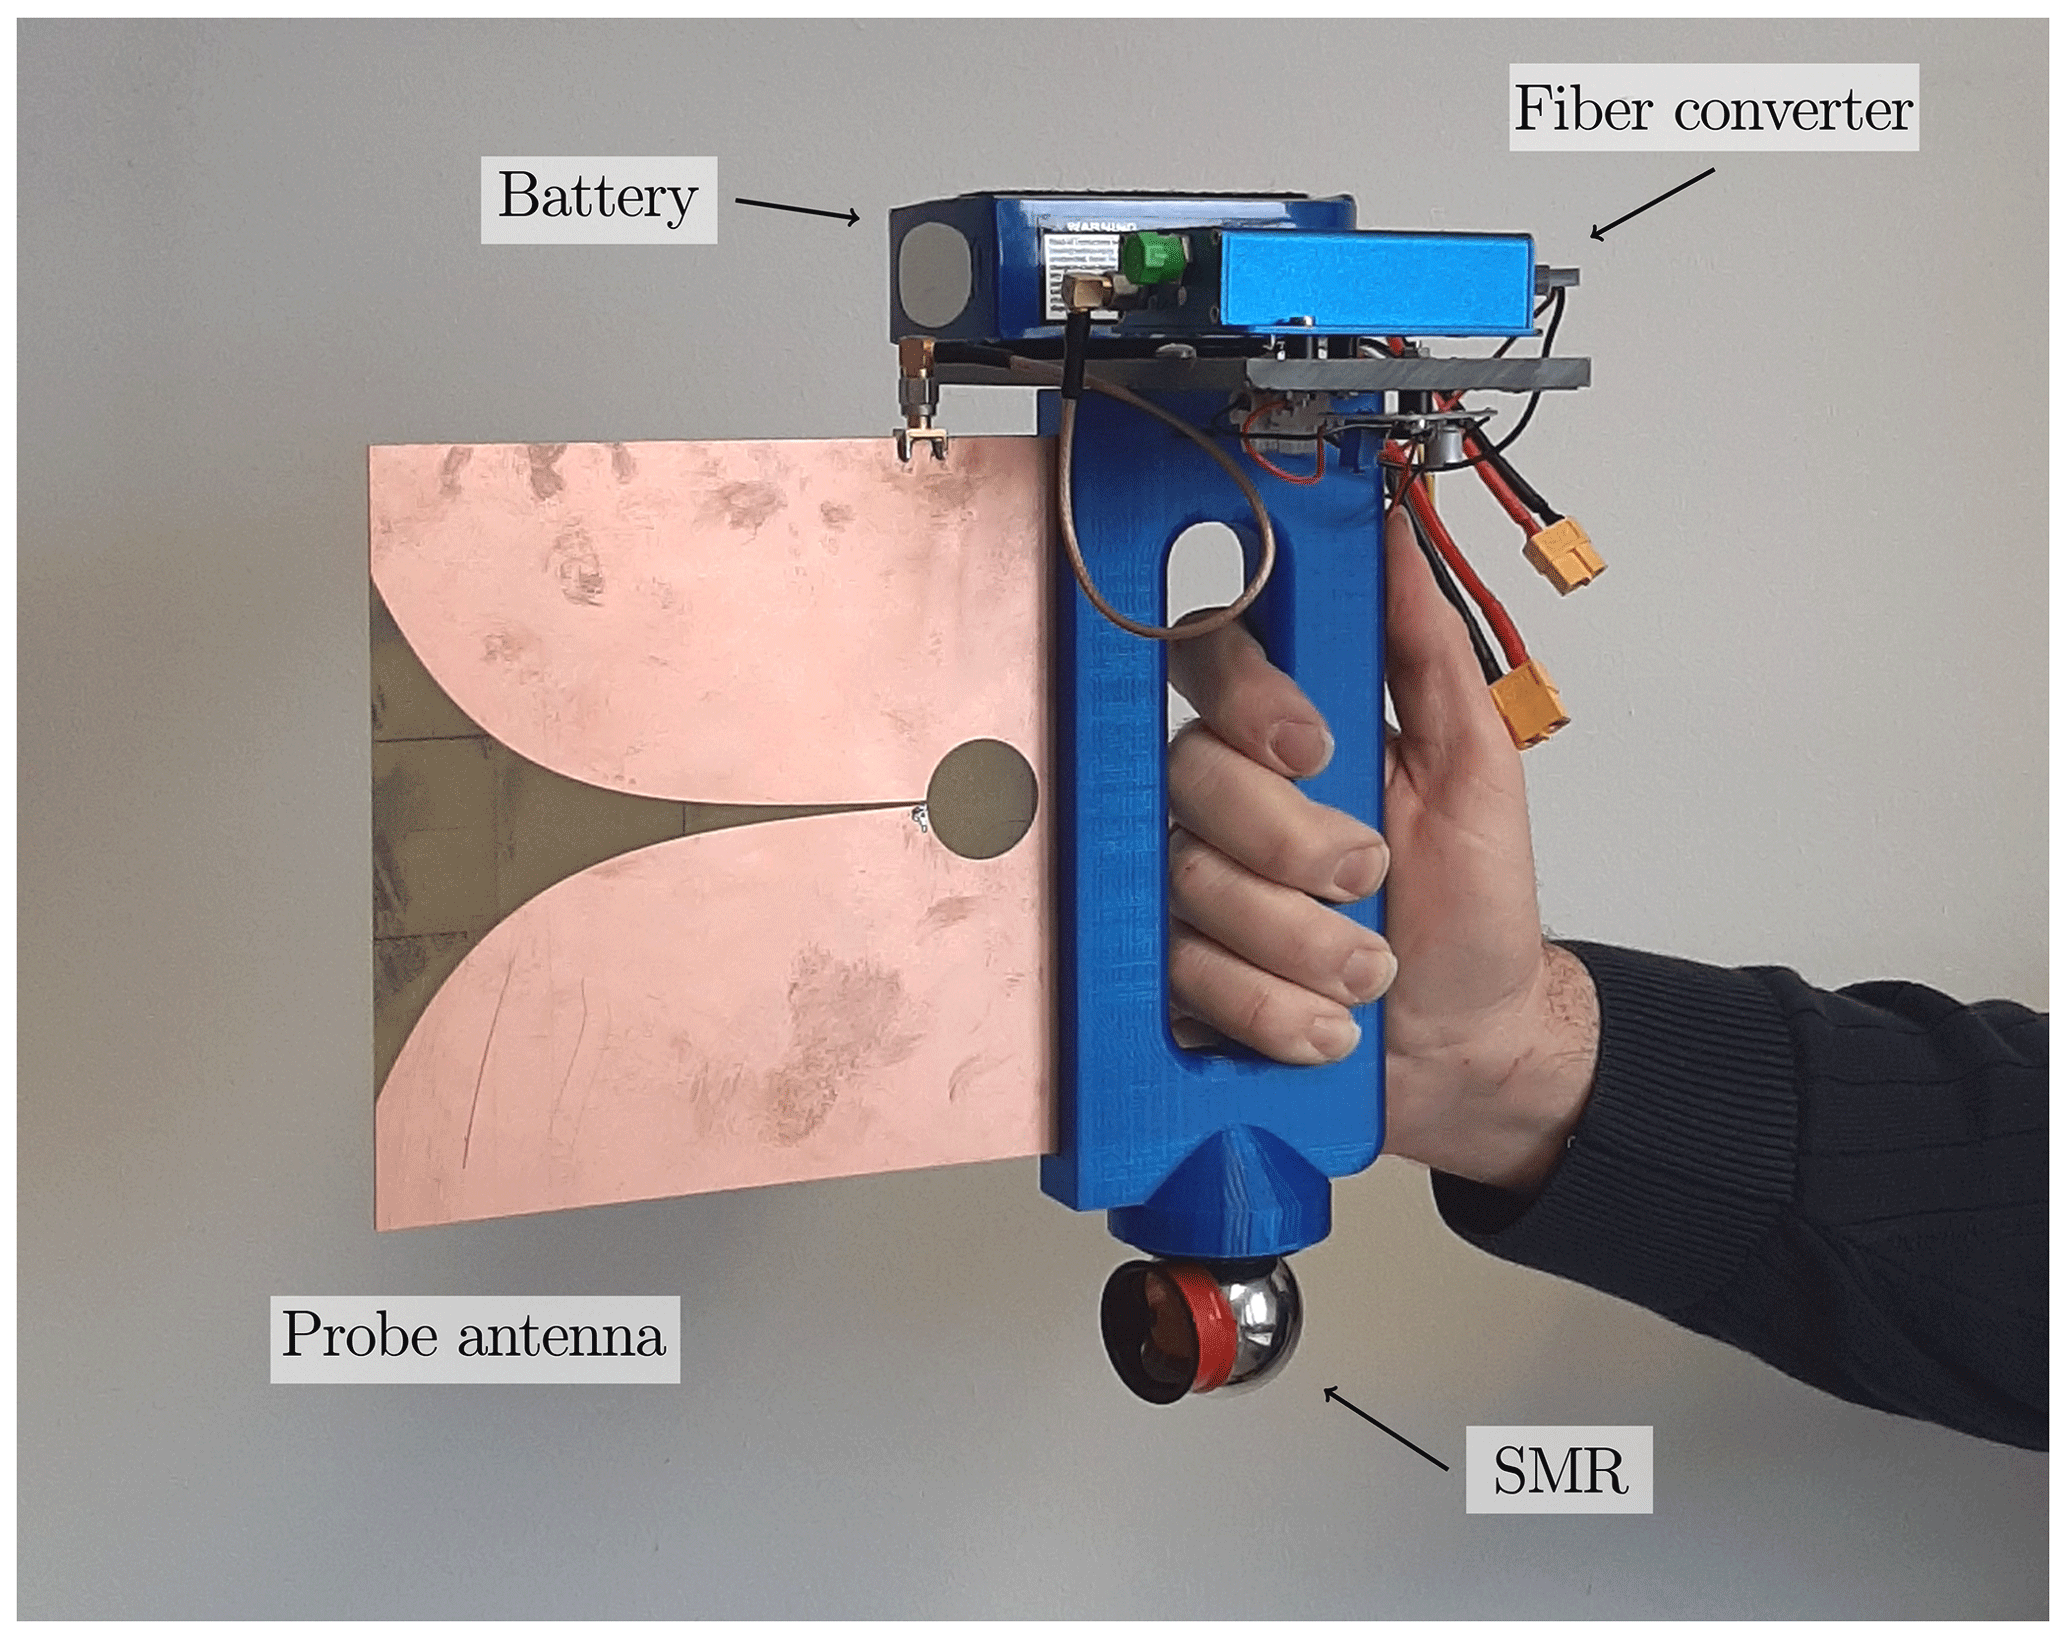
Figure 2The Vivaldi probe antenna is attached to a handle which carries the retro-reflector target (SMR), the RF-over-fiber converter and a battery.
A schematic drawing of the measurement setup is shown in Fig. 1. The two main components are a laser tracker of model FARO Vantage (FARO Technologies Inc., 2016) and a vector network analyzer (VNA) of type R&S ZVL (Rohde & Schwarz, 2020). The laser tracker is capable of measuring the position of a spherical-mounted retro-reflector (SMR) up to sub-millimeter accuracy. The SMR is attached to the bottom of the utilized probe antenna handle. The network analyzer is connected to the antenna under test (AUT) and the probe antenna, so that the complex transmission parameter can be recorded during the measurement. While the AUT is connected to the VNA via an SMA-cable, which exhibits an attenuation of 4.45 dB at 1 GHz, the probe antenna is connected to the VNA by an optical fiber link. For this, an RF-over-fiber module (ViaLite Communications, 2020) is mounted on the probe handle together with a battery as power supply for the RF-over-fiber module. Despite its attenuation of 4.83 dB, the advantage of the optical fiber link over an SMA-cable is the flexibility of the probe handle and it also diminishes the influence of possible cable bending due to the movement of the probe. In particular, the phase stability of the optical fiber link has been found to be very good and the attenuation of the optical fiber link is also low with about 0.05 dB at 1 GHz. However, it must be kept in mind that the noise figure of the optical fiber link is on the order of 15 to 20 dB. Both, laser tracker and VNA are triggered from a Raspberry Pi (RPi). After each trigger impulse, the data from both devices are read out and stored before a new trigger impulse is sent, in order to ensure that the field and position data correspond to each other. The utilized measurement probe is a PCB fabricated Vivaldi antenna working in the frequency range of 1 to 3 GHz and as seen in Fig. 2. Its radiation behaviour, when it is mounted on the probe handle together with the RF-over-fiber converter and the battery, has been measured in the anechoic chamber at the Technical University of Munich and validated by simulation. An illustration of the measured probe pattern is found in Fig. 3.
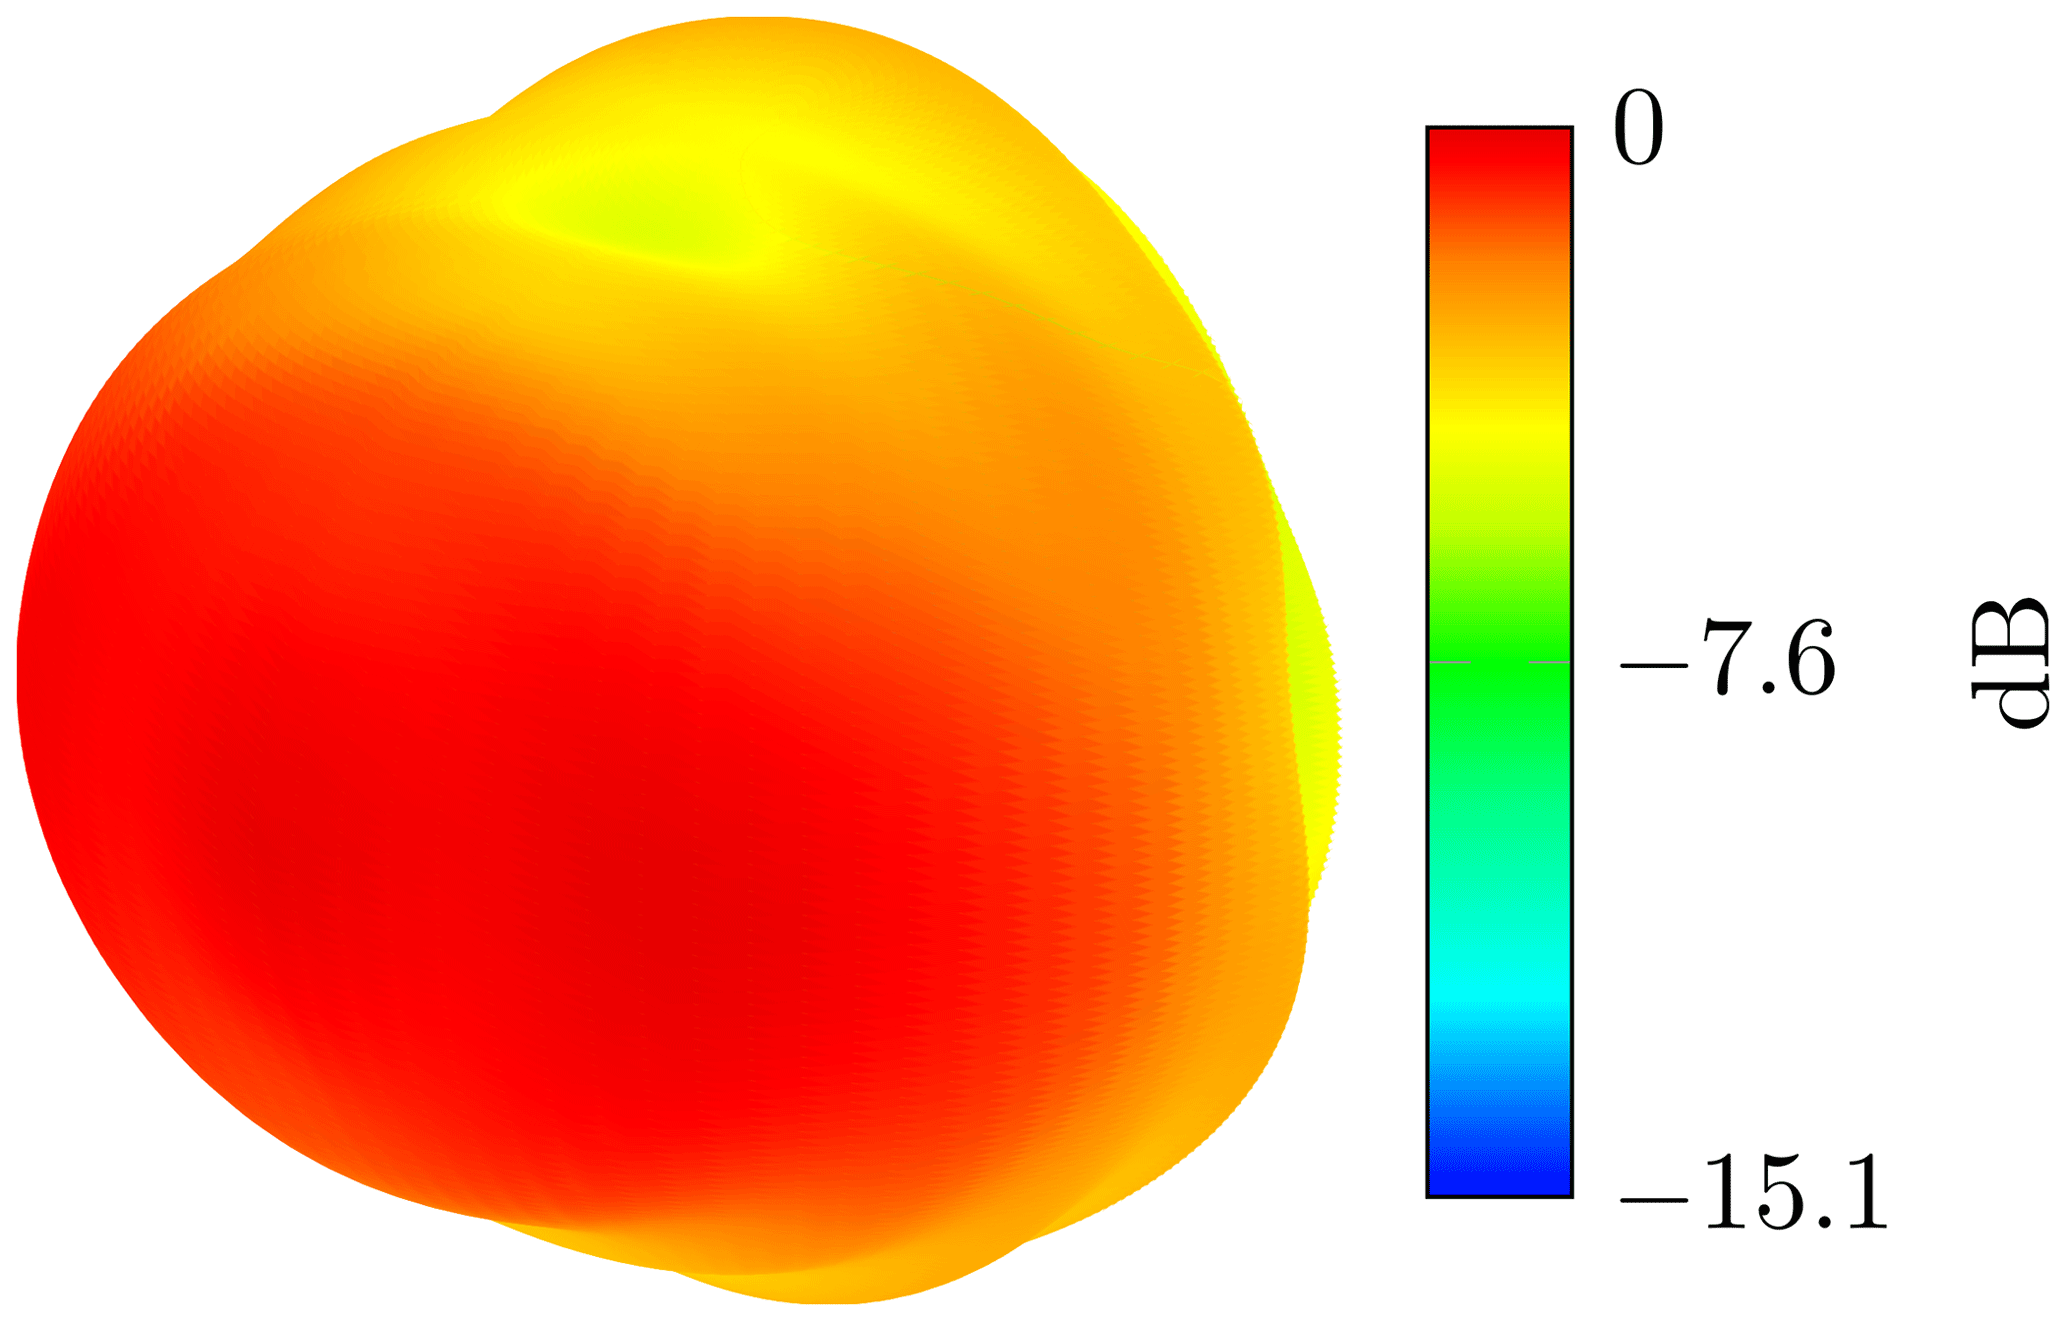
Figure 3Far-field radiation pattern of the probe antenna including the handle and all electronics. The pattern has been measured in an anechoic chamber.
3.1 Planar measurement geometry
The described setup has been tested in a large sports facility. Figure 4 shows the setup where the double-ridged horn antenna DRH400 was used as AUT, mounted on a stand 2.4 m above ground. The measurement frequency was 1 GHz while a set of position and field data was recorded every 50 ms. The AUT near-field was scanned on an almost planar surface in horizontal lines as depicted in Fig. 5.
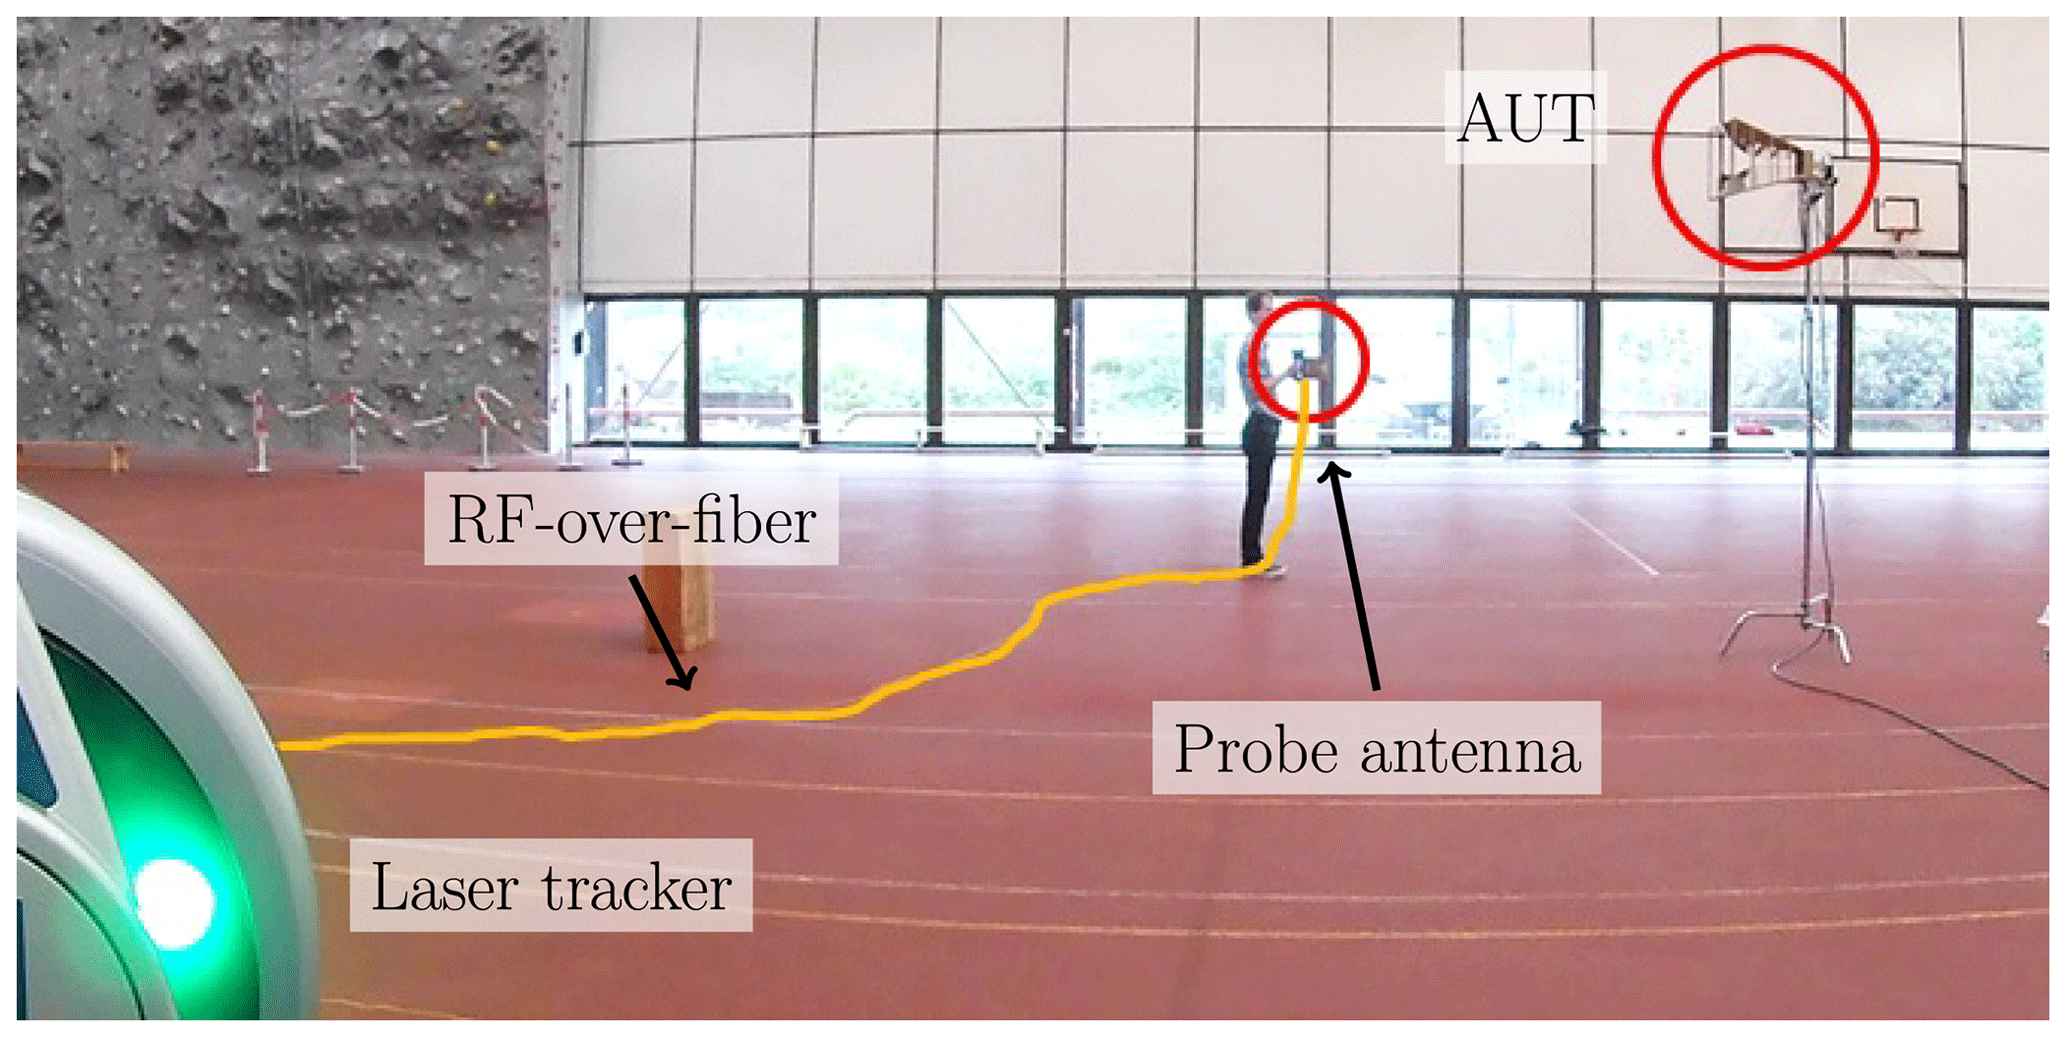
Figure 4On-site measurement scenario. An operator person moves the probe antenna on a planar scanning surface in front of the antenna under test. The probe position is tracked by a laser tracker, while the probe antenna itself is connected to a vector network analyzer by an optical fiber link.
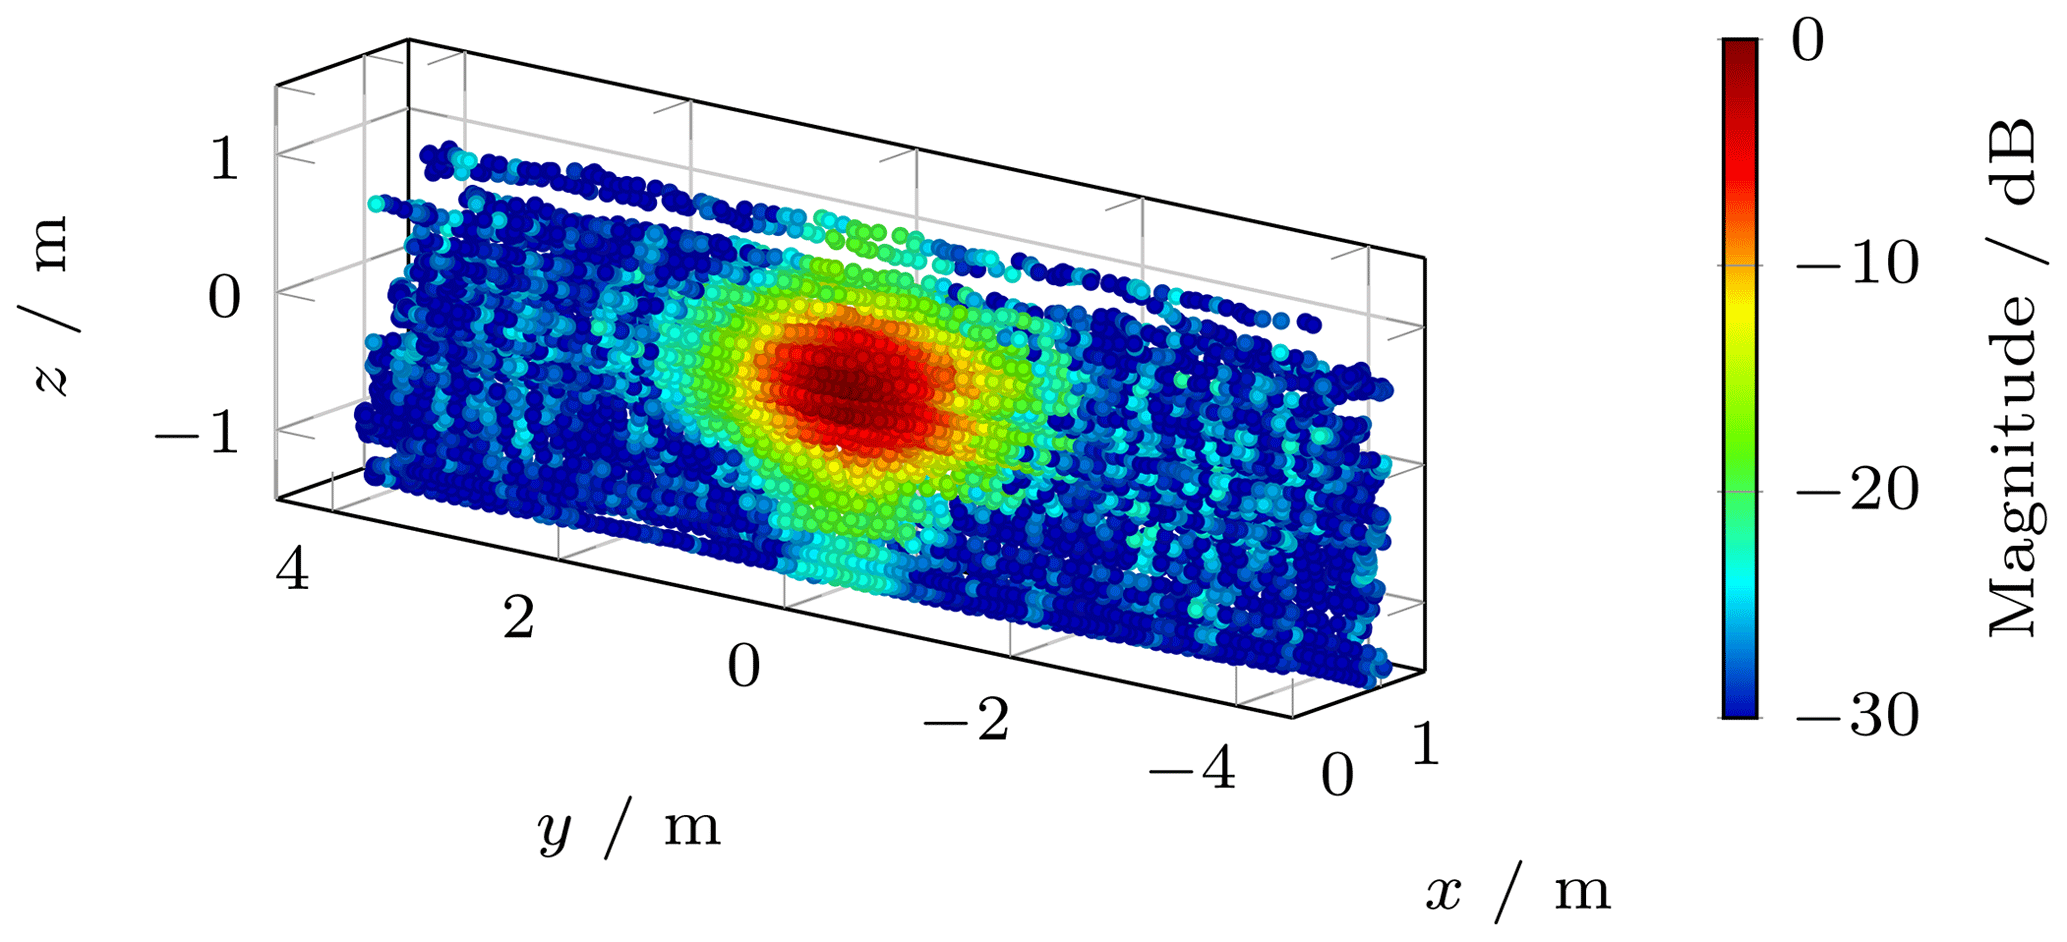
Figure 5Magnitudes of the near-field samples located on the quasi-planar measurement surface. Each dot represents one measurement sample where the field magnitude is coded in color.
The main beam of the AUT can clearly be seen within the NF data. However, there are fluctuations in the field magnitude which is due to improper orientation of the probe antenna and noise due to parasitic echo contributions and external interference. An operator person carried the probe antenna during the measurements, where a long wooden stick extended the positioning range to larger heights above ground at the risk of a less accurate probe orientation. During the NFFFT via FIAFTA, it was assumed that the probe orientation did not change during the whole measurement data acquisition. Obviously, this introduces some errors into the field transformation since the correction of the probe influence on the measured field data cannot be fully corrected due to possibly wrong orientation data of the probe antenna. The probe correction is performed utilizing the FF pattern of the Vivaldi antenna including the handle and all electronics, as shown in Fig. 3. In most parts of the scan area, the sampling of the NF is considerably finer than required by the sampling theorem. This was desired as it reduces the error influence of single measurement samples. A comparison of the resulting FF pattern with a reference measurement, performed in the anechoic chamber of the Technical University of Munich, reveals a deviation of up to −20 dB within the expected valid angular range. The FF main cuts for and are depicted in Fig. 6.
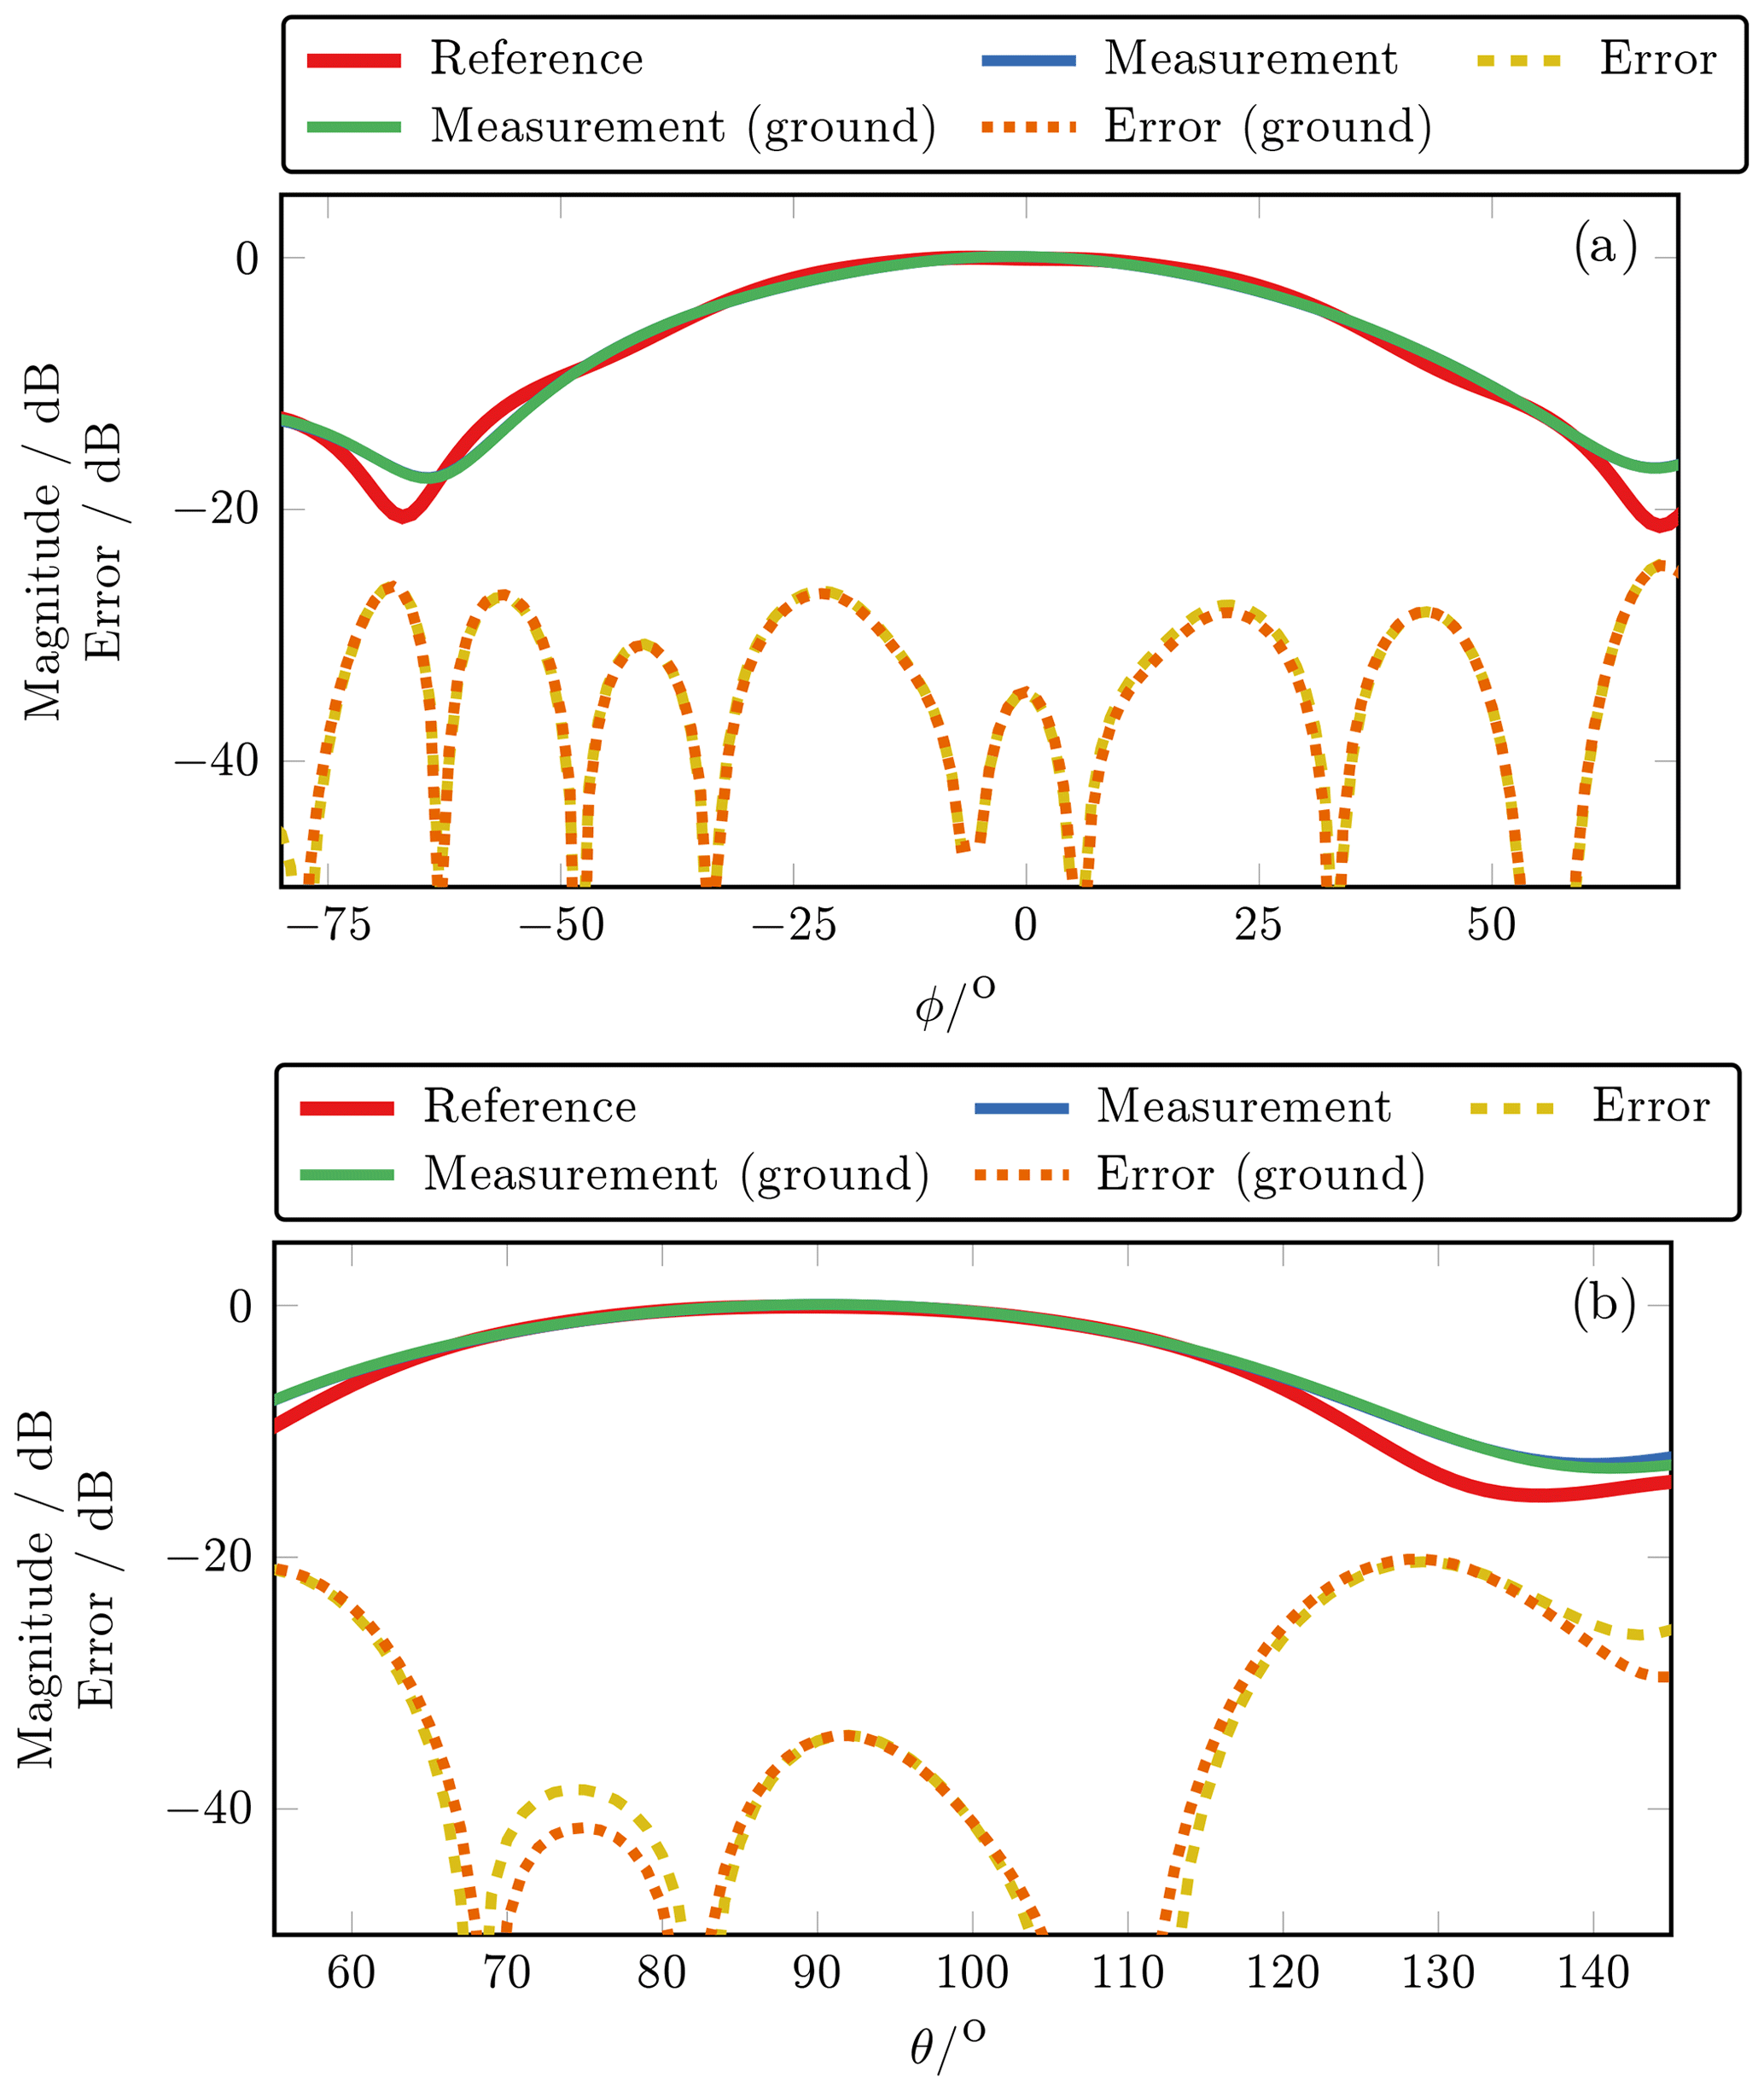
Figure 6Far-field main cuts in the valid angles with and without ground consideration. The phi-cut (a) is evaluated at and the theta-cut (b) at . The maximum deviation of the measurement from the reference is −20 dB.
The deviation between the manual measurements and the reference is given by
where Eref is the FF of the reference measurement and Eman the FF of the manual measurement. Due to the finite scan surface, the transformation results are only valid in a certain angular range. The valid angles are calculated according to
and
where Δxmeas and Δymeas are the width and length of the measurement surface and waut and haut the width and height of the AUT. The finite scan surface also introduces errors within the valid angular range, especially near the edges, as, e.g., also described in Qureshi (2013).
On-site antenna measurements are inherently different from NF measurements performed in anechoic chambers in terms of external influences such as scatterers and ground effects. Therefore, these influences should be taken into account within the NFFFT. The measurement has been performed in a large sports facility to ensure free space around the AUT and lower the influence of scatters. Figure 6 also includes the results of the NFFFT performed with consideration of dielectric ground. A comparison of the FF cuts with and without ground consideration reveals that the ground influence is little in this measurement. In fact, this quasi-planar measurement has been performed several times with similar results in terms of error level and ground influence. The errors of some measurements are given in Table 1, which shows the repeatability of such manual antenna measurements within the stated error bounds.
Table 1Comparison of the far-field errors of multiple quasi-planar measurements. Meas 1 is the measurement described in detail in Sect. 3.1, while all other measurements have been performed in a similar manner. Note that the frequency of Meas 4 is different from the others.
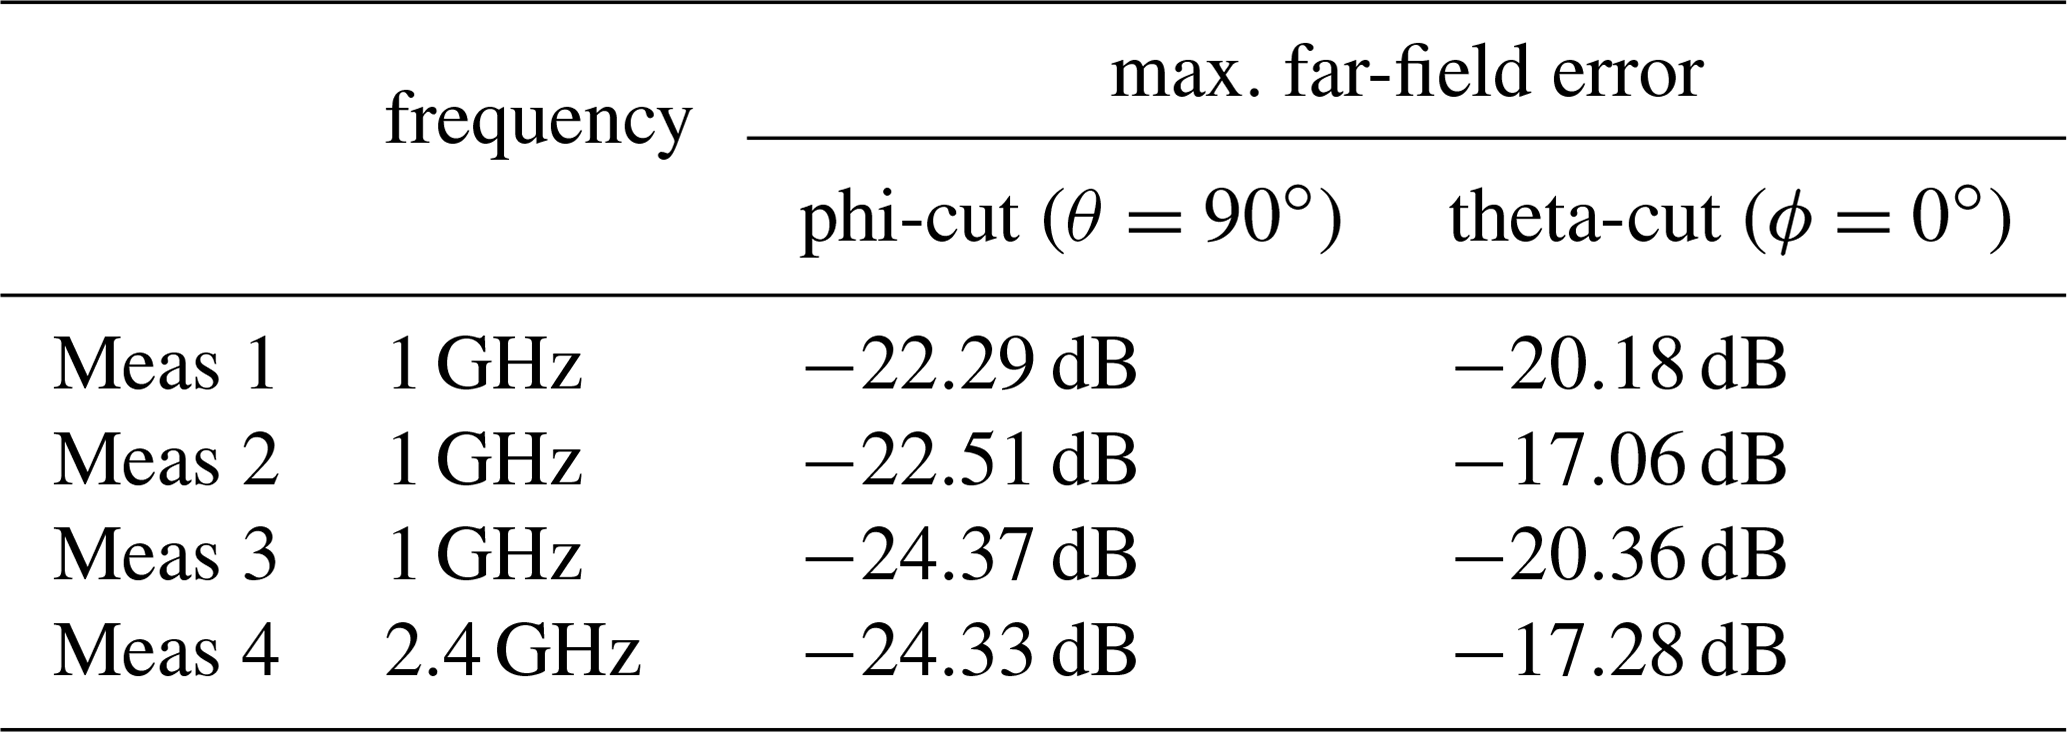
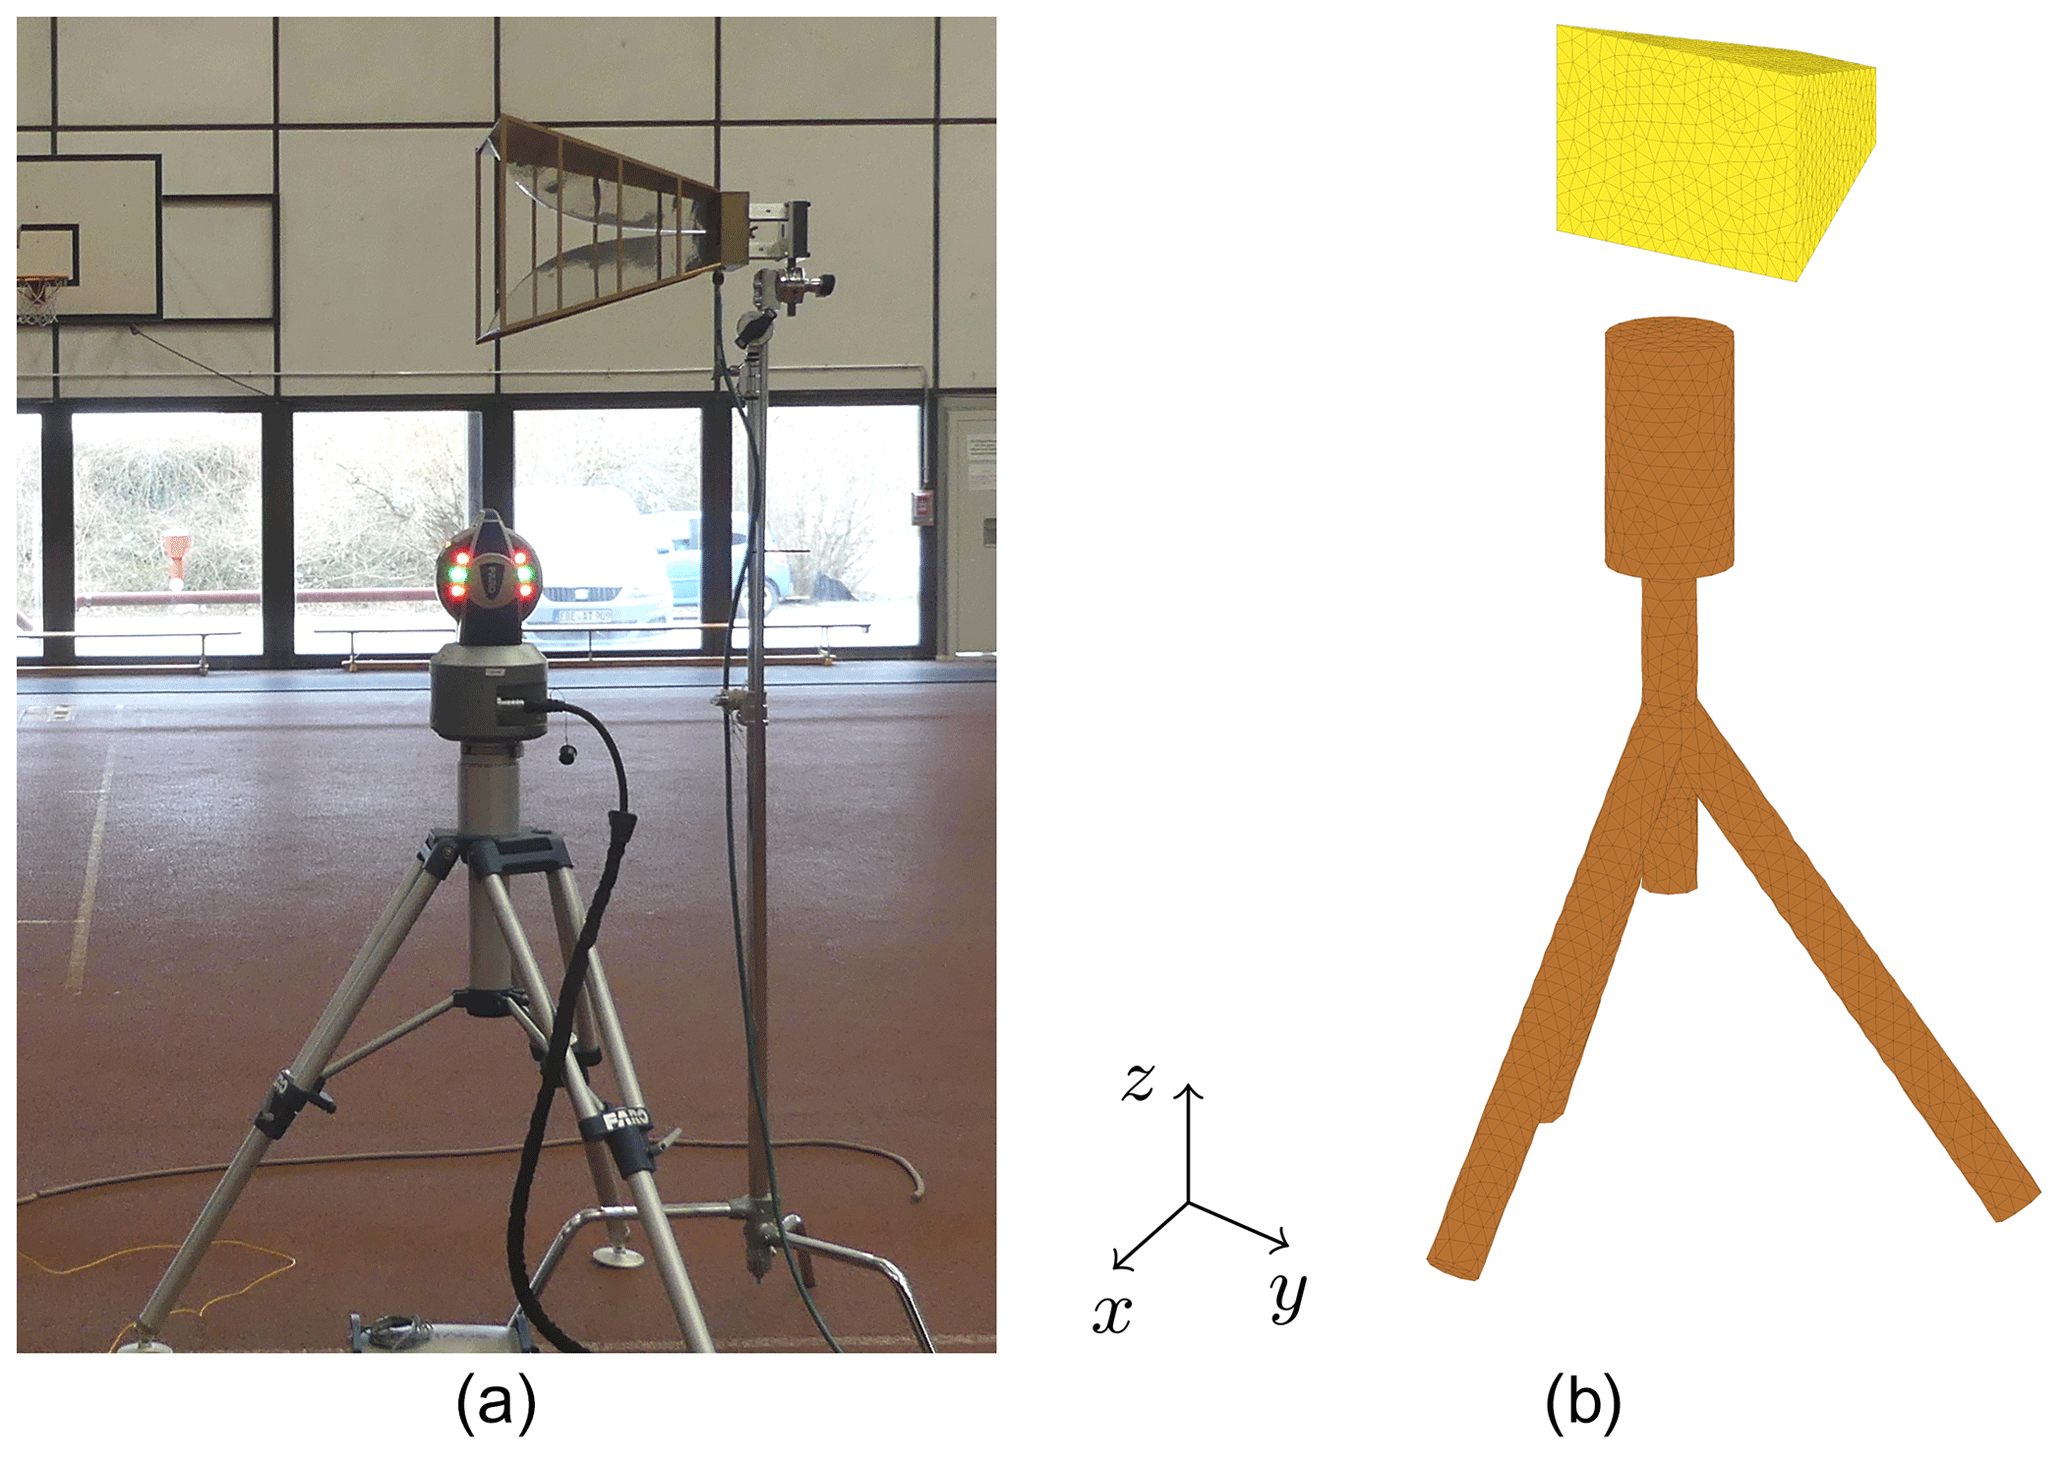
Figure 7The laser tracker was placed under the AUT (a) to perform a manual measurement with a cylindrical scan geometry. In the NFFFT, an AUT mesh (yellow) was used for the computation of the far-field while a mesh of the laser tracker (copper) was declared as scatterer (b).
3.2 Cylindrical measurement geometry
To increase the valid angular range in horizontal direction, another measurement with a cylindrical scan geometry has been performed. For this, the laser tracker was placed under the AUT as depicted in Fig. 7a. This was necessary since line-of-sight between the laser tracker and the SMR is required and could otherwise not be realized for all measurement positions. Again, the probe antenna handle was moved by an operator person with the extension of a wooden stick in the upper field parts. The AUT itself was placed 2 m above ground and the vertical distance between AUT and laser tracker was 30 cm. Once more, the field has been measured at a frequency of 1 GHz while the recording interval was decreased to 5 ms to collect even more samples. Figure 8 shows the magnitude of the measured field data. The transformed FF cuts are shown in Fig. 9. A comparison of Figs. 6a and 9a reveals that the valid angular range could be increased with a similar error level of the results.
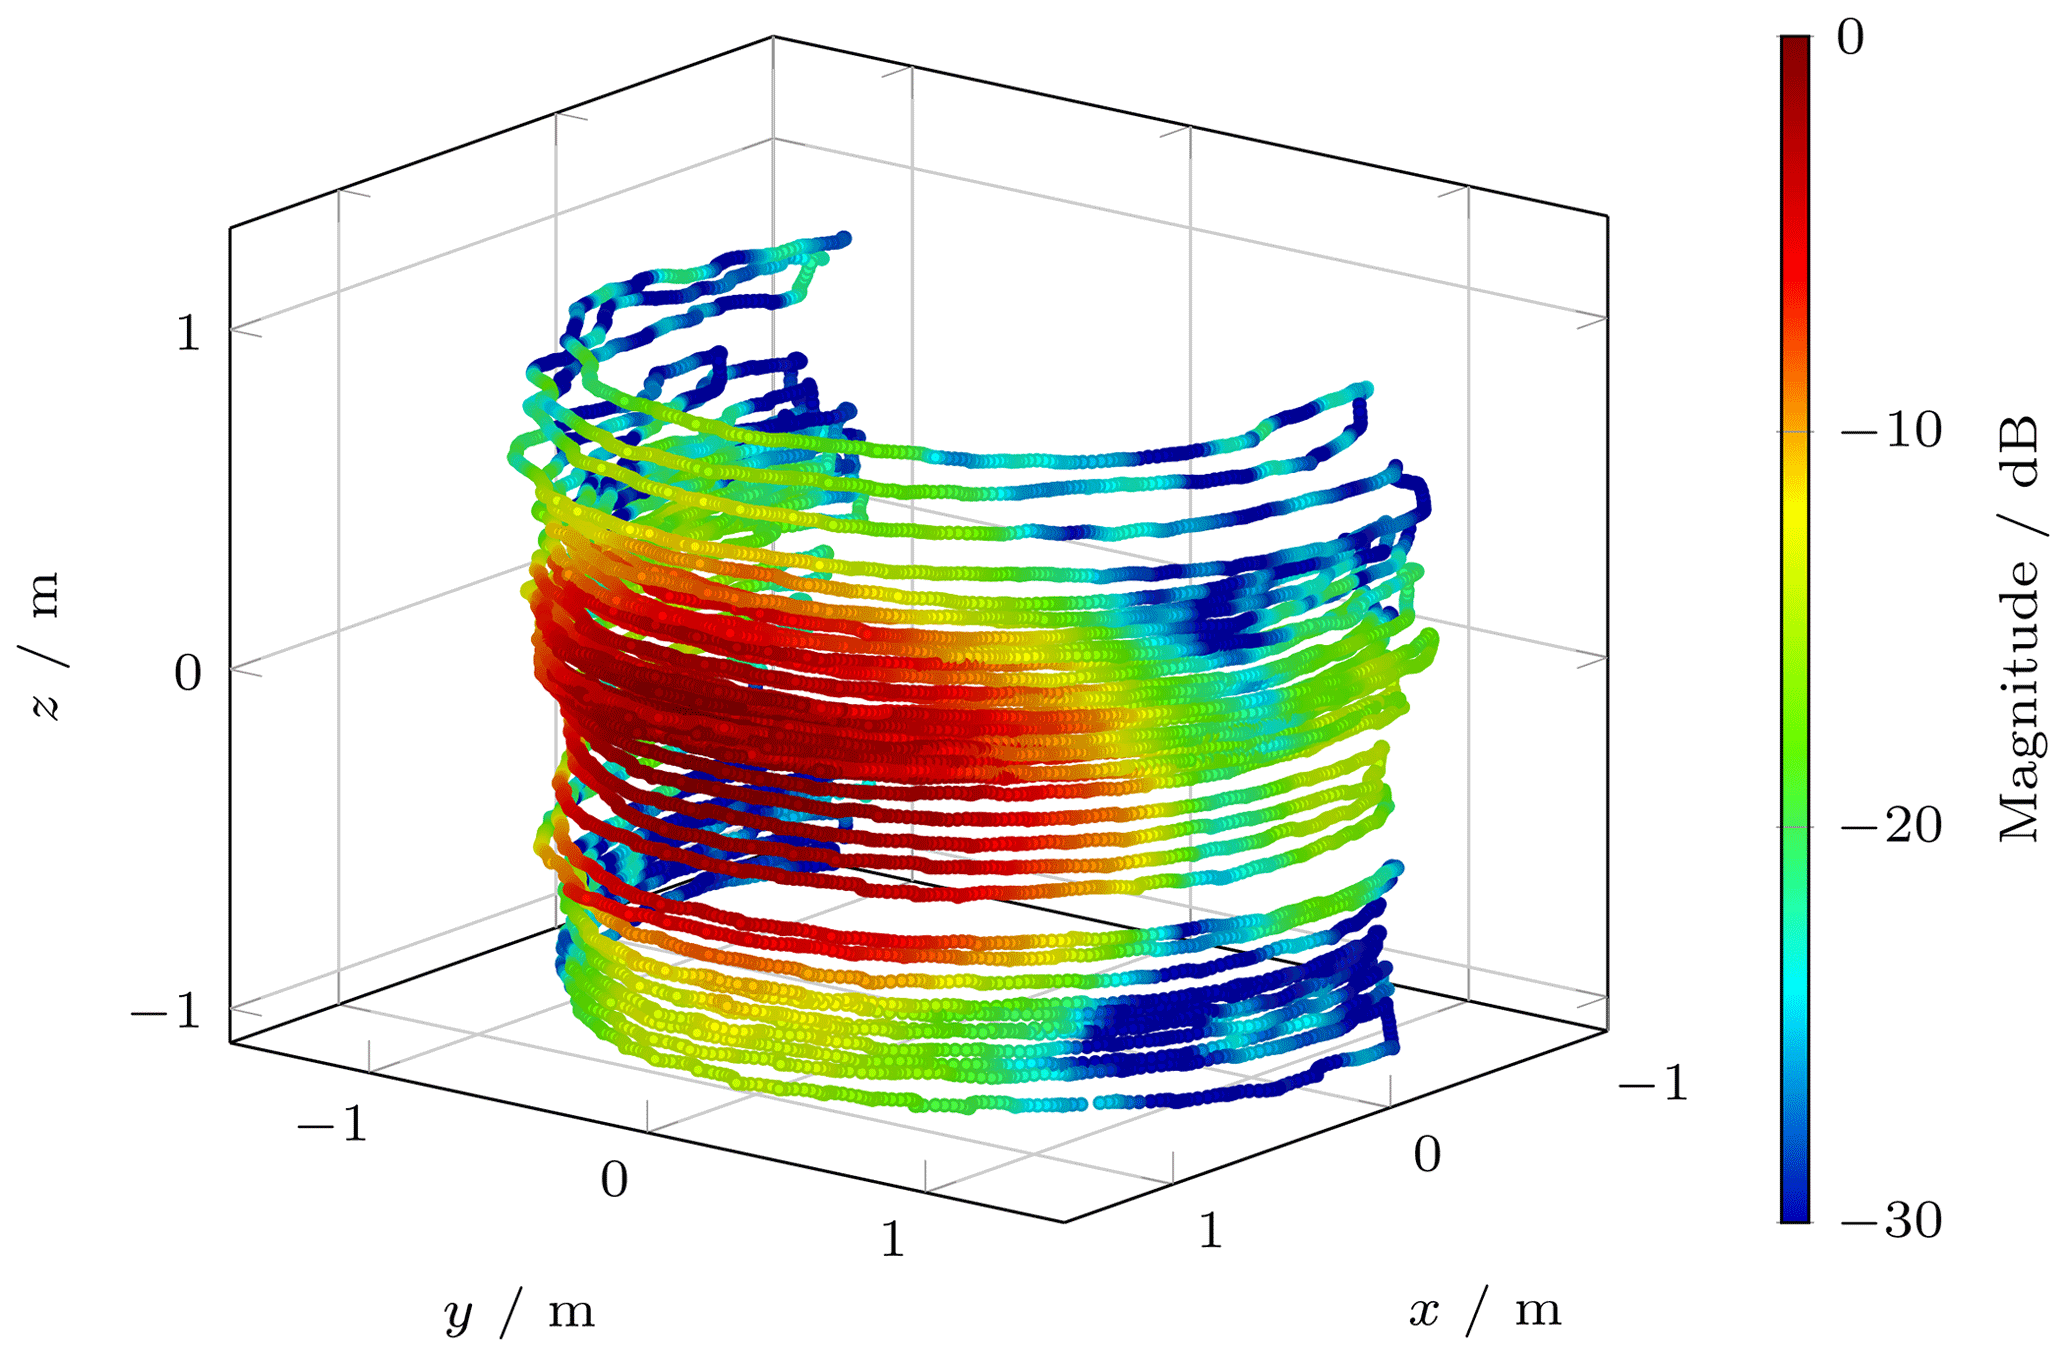
Figure 8Magnitude of the measured near-field where red represents high and blue low magnitude. The field has been measured on a cylindrical scan geometry to increase the valid angles.
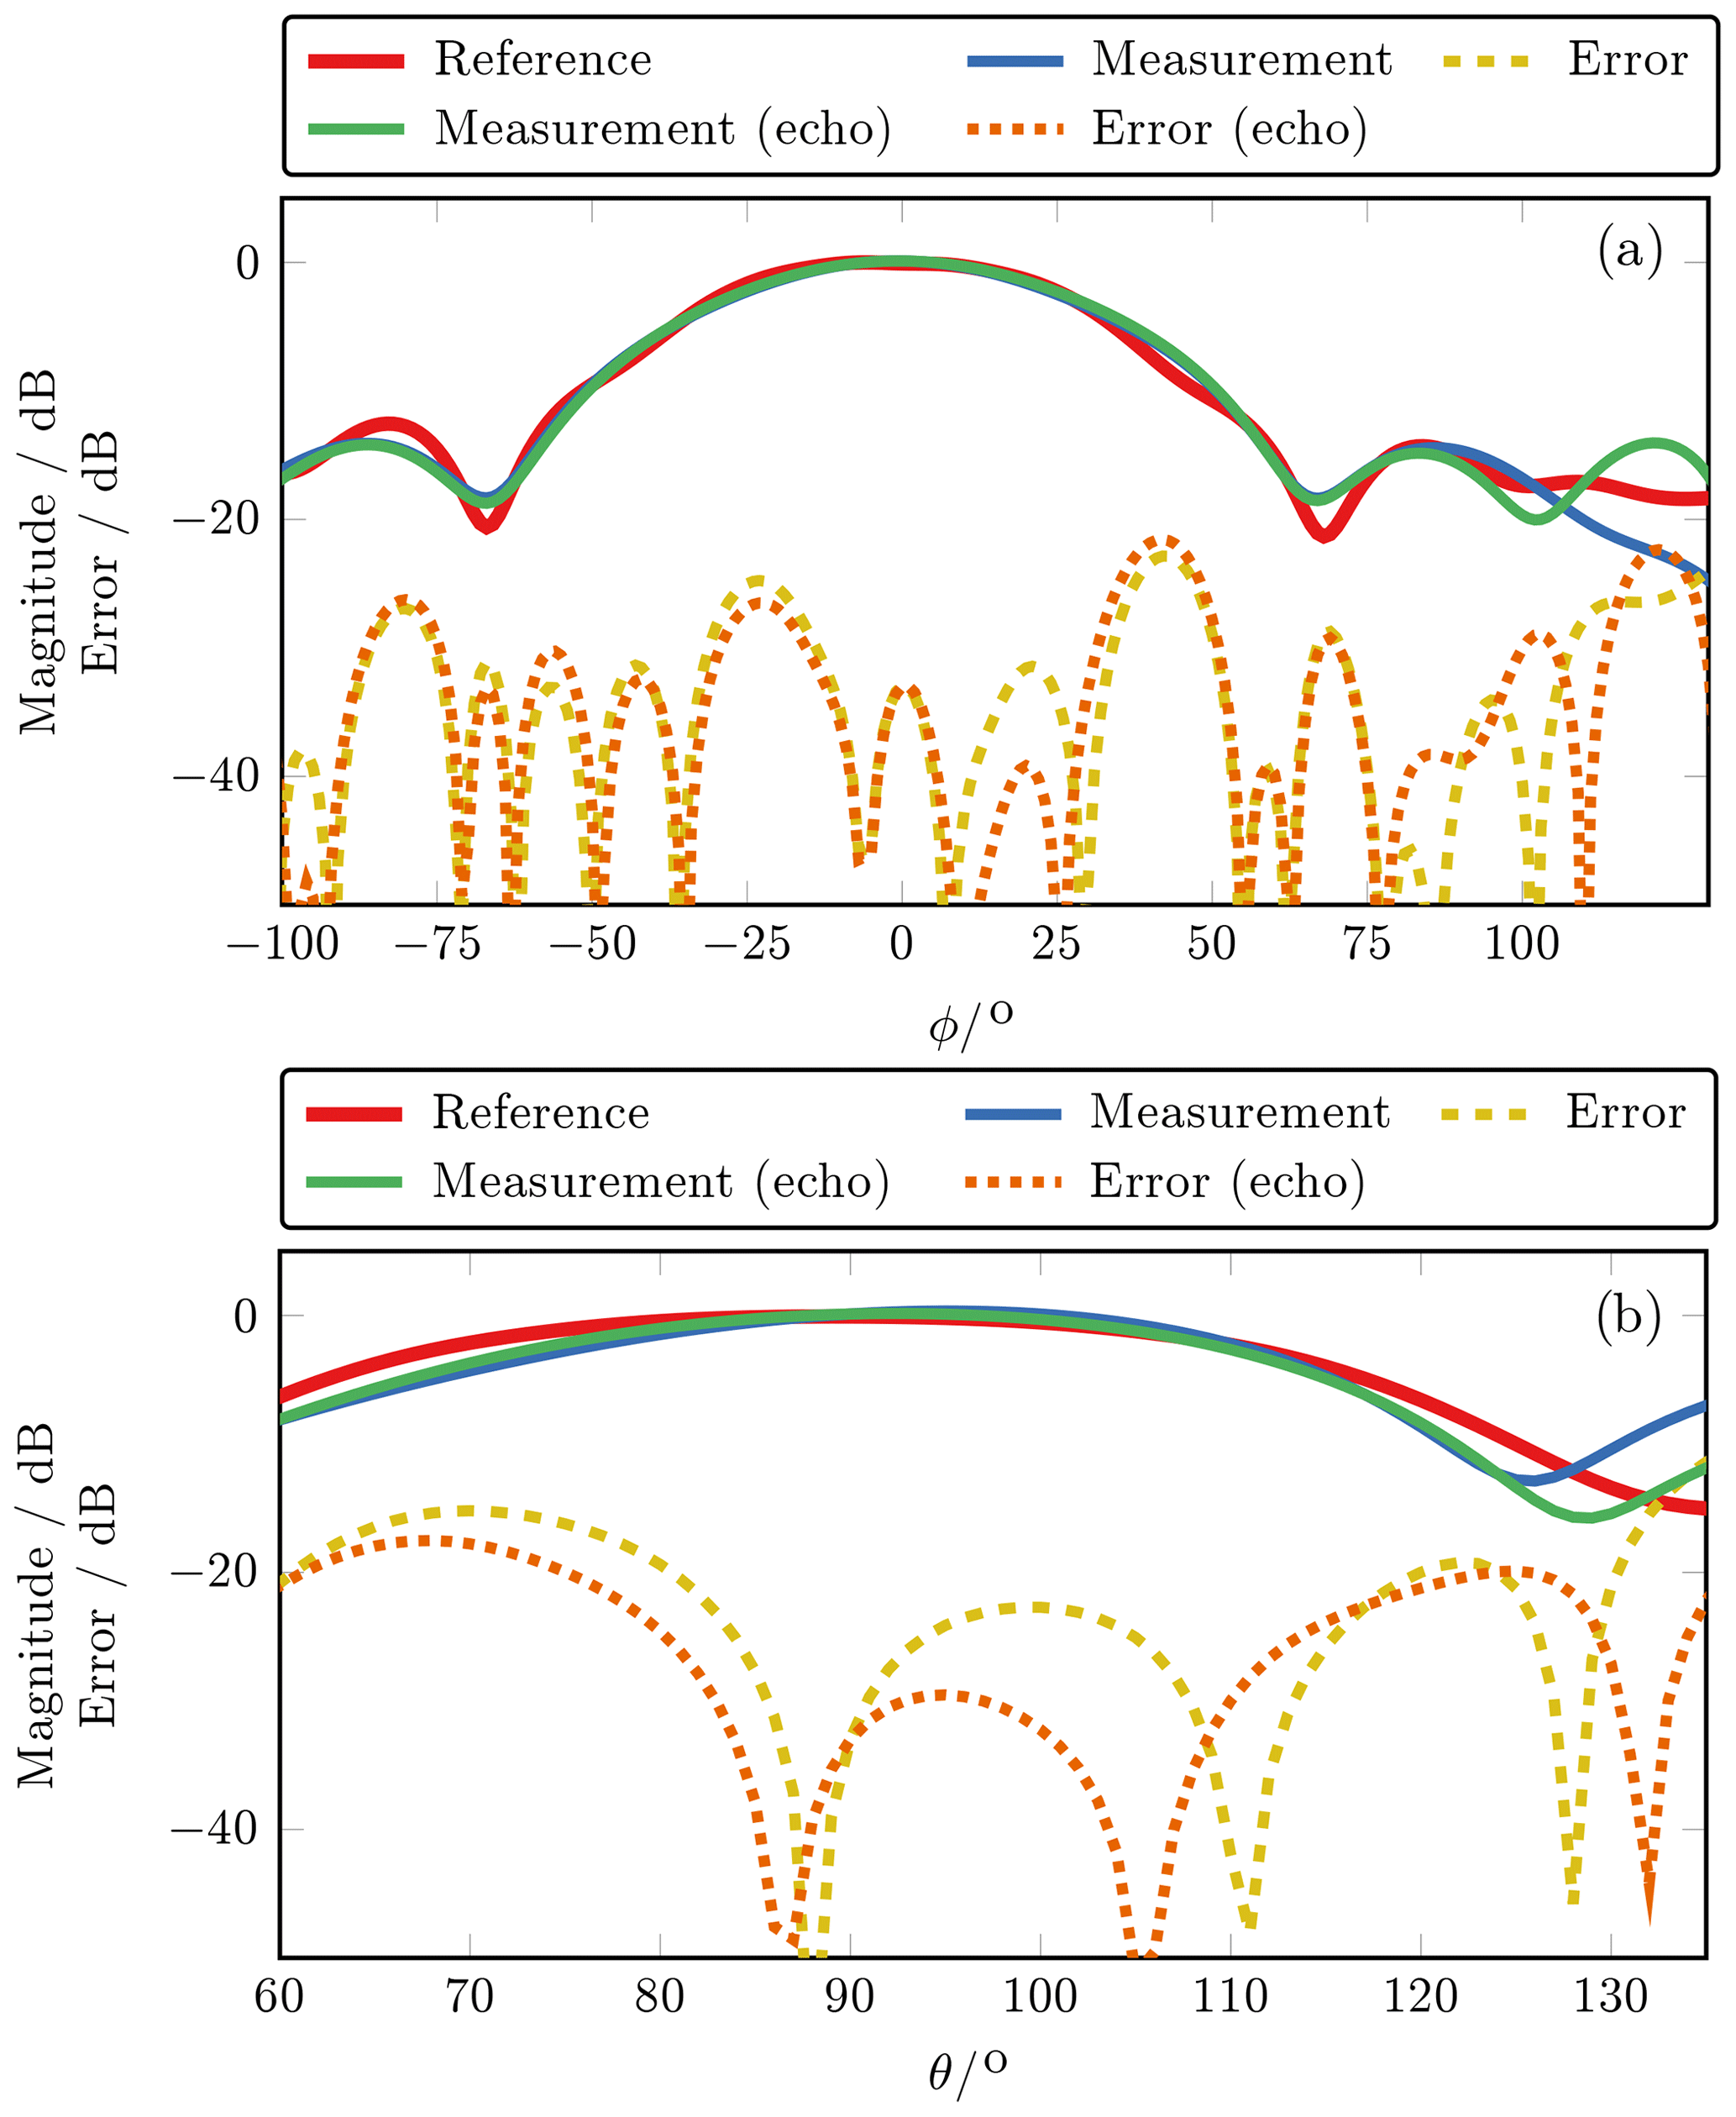
Figure 9Far-field main cuts in the valid angular range for (a) and (b). The transformation results are shown with and without the consideration of the laser tracker as an echo source.
Due to the close vicinity between AUT and laser tracker, some influence on the measured field in terms of scattered field contributions from the laser tracker is expected and should be considered in the NFFFT. For this, the laser tracker was modeled and included into the mesh file as depicted in Fig. 7b. The employed NFFFT algorithm, FIAFTA, computes the equivalent currents on the whole mesh while eventually only the AUT currents are used for the computation of the FF. The FF cuts in Fig. 9 show the transformation results with and without the modelling of the laser tracker as echo source. It can be seen that the error level is reduced in Fig. 9b when the laser tracker is considered.
A simple NF measurement setup for on-site testing of antennas has been presented. The operation performance was shown by two near-field measurements that have been transformed into the far-field by near-field far-field transformation. Even if the error level is higher in comparison with traditional near-field measurements in anechoic chambers, the system performs well for the principle validation of antennas. It was further shown that the measurement system is very powerful in particular in combination with appropriate near-field far-field transformation algorithms, which enable the consideration of ground effects and echo sources. The clear advantage of this setup over traditional near-field ranges is its mobility and flexibility that enables on-site antenna testing.
The underlying research data can be requested from the authors.
FTF, TFE and HJS worked out the concept of the measurement system. FTF built the setup and carried out the measurements. TFE supervised the measurements and helped with the post-processing of the data. All authors read and approved the final manuscript.
The authors declare that they have no conflict of interest.
This article is part of the special issue “Kleinheubacher Berichte 2019”. It is a result of the Kleinheubacher Tagung 2019, Miltenberg, Germany, 23–25 September 2019.
The authors thank Thomas Mittereder for his help during the on-site measurements.
This work was supported by the German Federal Ministry for Economic Affairs and Energy (grant no. 20E1711A).
This paper was edited by Romanus Dyczij-Edlinger and reviewed by Heyno Garbe and Adrian Amor-Martin.
Eibert, T., Fritzel, T., Schmidt, C., and Steiner, H.-J.: Method and device for measuring a radiation field, United States Patent No., US8 410 987 B2, 2013. a
Eibert, T. F. and Mauermayer, R. A. M.: Equivalent sources based near-field far-field transformation above dielectric half space, in: Proc. 40th Annual Meeting and Symposium of the Antenna Measurement Techniques Association (AMTA), Williamsburg, VA, 2018. a
Eibert, T. F., Ismatullah, Kaliyaperumal, E., and Schmidt, C. H.: Inverse equivalent surface current method with hierarchical higher order basis functions, full probe correction and multilevel fast multipole acceleration (invited paper), Prog. Electromagn. Res., 106, 377–394, https://doi.org/10.2528/PIER10061604, 2010. a
Eibert, T. F., Kilic, E., Lopez, C., Mauermayer, R. A. M., Neitz, O., and Schnattinger, G.: Electromagnetic field transformations for measurements and simulations (invited paper), Prog. Electromagn. Res., 151, 127–150, https://doi.org/10.2528/PIER14121105, 2015. a
FARO Technologies Inc.: FARO Laser Tracker Vantage Benutzerhandbuch, Rev. D, April 2016 (in German). a
Fritzel, T., Strauß, R., Steiner, H., Eisner, C., and Eibert, T. F.: Introduction into an UAV-based near-field system for in-situ and large-scale antenna measurements (invited paper), in: Proc. IEEE Conference on Antenna Measurements Applications (CAMA), Syracuse, NY, https://doi.org/10.1109/CAMA.2016.7815762, 2016. a
García-Fernández, M., Álvarez López, Y., Arboleya, A., González-Valdés, B., Rodríguez-Vaqueiro, Y., Gómez, M. E. D. C., and Andrés, F. L.-H.: Antenna diagnostics and characterization using unmanned aerial vehicles, IEEE Access, 5, 23563–23575, https://doi.org/10.1109/ACCESS.2017.2754985, 2017. a
Geise, A., Neitz, O., Migl, J., Steiner, H.-J., Fritzel, T., Hunscher, C., and Eibert, T. F.: A crane based portable antenna measurement system – system description and validation, IEEE T. Antenn. Propag., 67, 3346–3357, https://doi.org/10.1109/TAP.2019.2900373, 2019. a
Gregson, S., McCormick, J., and Parini, C.: Principles of Planar Near-field Antenna Measurements, IET, MPG Books Ltd., Bodmin, Cornwall, 2007. a
He, H., Maheshwari, P., and Pommerenke, D. J.: The development of an EM-field probing system for manual near-field scanning, IEEE T. Electromagn. C., 58, 356–363, https://doi.org/10.1109/TEMC.2015.2496376, 2016. a, b
Mauermayer, R. A. M. and Eibert, T. F.: Fast irregular antenna field transformation above perfectly conducting ground planes, in: European Conference on Antennas and Propagation (EUCAP), Davos, Switzerland, https://doi.org/10.1109/EuCAP.2016.7481231, 2016. a
Parini, C., Gregson, S. F., McCormick, J., and Rensburg, D. J. V.: Theory and Practice of Modern Antenna Range Measurements, The Institution of Engineering and Technology, London, UK, 2014. a
Paulus, A., Knapp, J., and Eibert, T. F.: Phaseless near-field far-field transformation utilizing combinations of probe signals, IEEE T. Antennas Prop., 65, 5492–5502, https://doi.org/10.1109/TAP.2017.2735463, 2017. a
Qureshi, M. A.: Near-Field Error Analysis and Efficient Sampling Techniques for the Fast Irregular Antenna Field Transformation Algorithm, Doctoral Dissertation,Technische Universität München, Fakultät fur Elektrotechnik und Informationstechnik, Munich, 2013. a
Rohde & Schwarz: R&S ZVL Vector Network Analyzers, available at: https://www.rohde-schwarz.com/de/produkt/zvl-produkt-startseite_63493-9014.html, last access: 17 January 2020. a
ViaLite Communications: ViaLiteHD Fibre Optic Link User Guide, version 2017, available at: https://www.vialite.com/wp-content/uploads/2017/10/ViaLiteHD-RF-Link-Handbook-HRx-HB-7.pdf, last access: 17 January 2020. a
Virone, G., Lingua, A. M., Piras, M., Cina, A., Perini, F., Monari, J., Paonessa, F., Peverini, O. A., Addamo, G., and Tascone, R.: Antenna pattern verification system based on a micro unmanned aerial vehicle (UAV), IEEE Antenn. Wirel. Pr., 13, 169–172, https://doi.org/10.1109/LAWP.2014.2298250, 2014. a
Yaghjian, A.: An overview of near-field antenna measurements, IEEE T. Antenn. Propag., 34, 30–45, https://doi.org/10.1109/tap.1986.1143727, 1986. a
Yinusa, K. A., Schmidt, C. H., and Eibert, T. F.: Modeling of unknown echoic measurement facilities with equivalent scattering centers, in: European Conference on Antennas and Propagation (EUCAP), Prague, Czech Republic, 2104–2108, https://doi.org/10.1109/EuCAP.2012.6205875, 2012. a
Álvarez-Narciandi, G., López-Portugués, M., Las-Heras, F., and Laviada, J.: Freehand, agile, and high-resolution imaging with compact mm-wave radar, IEEE Access, 7, 95516–95526, https://doi.org/10.1109/ACCESS.2019.2929522, 2019. a, b