| 17 Dec 2021
Compact Radar Cross-Section Measurement Setup and Performance Evaluation
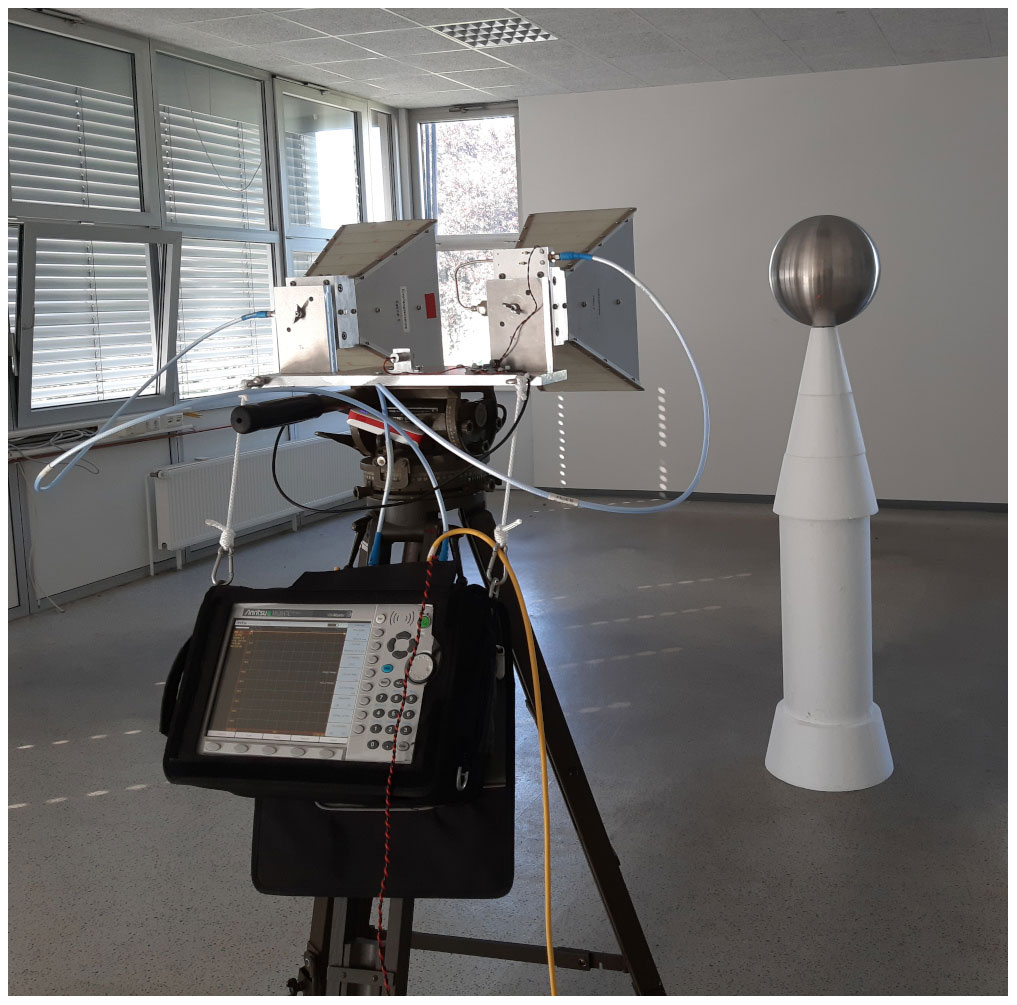
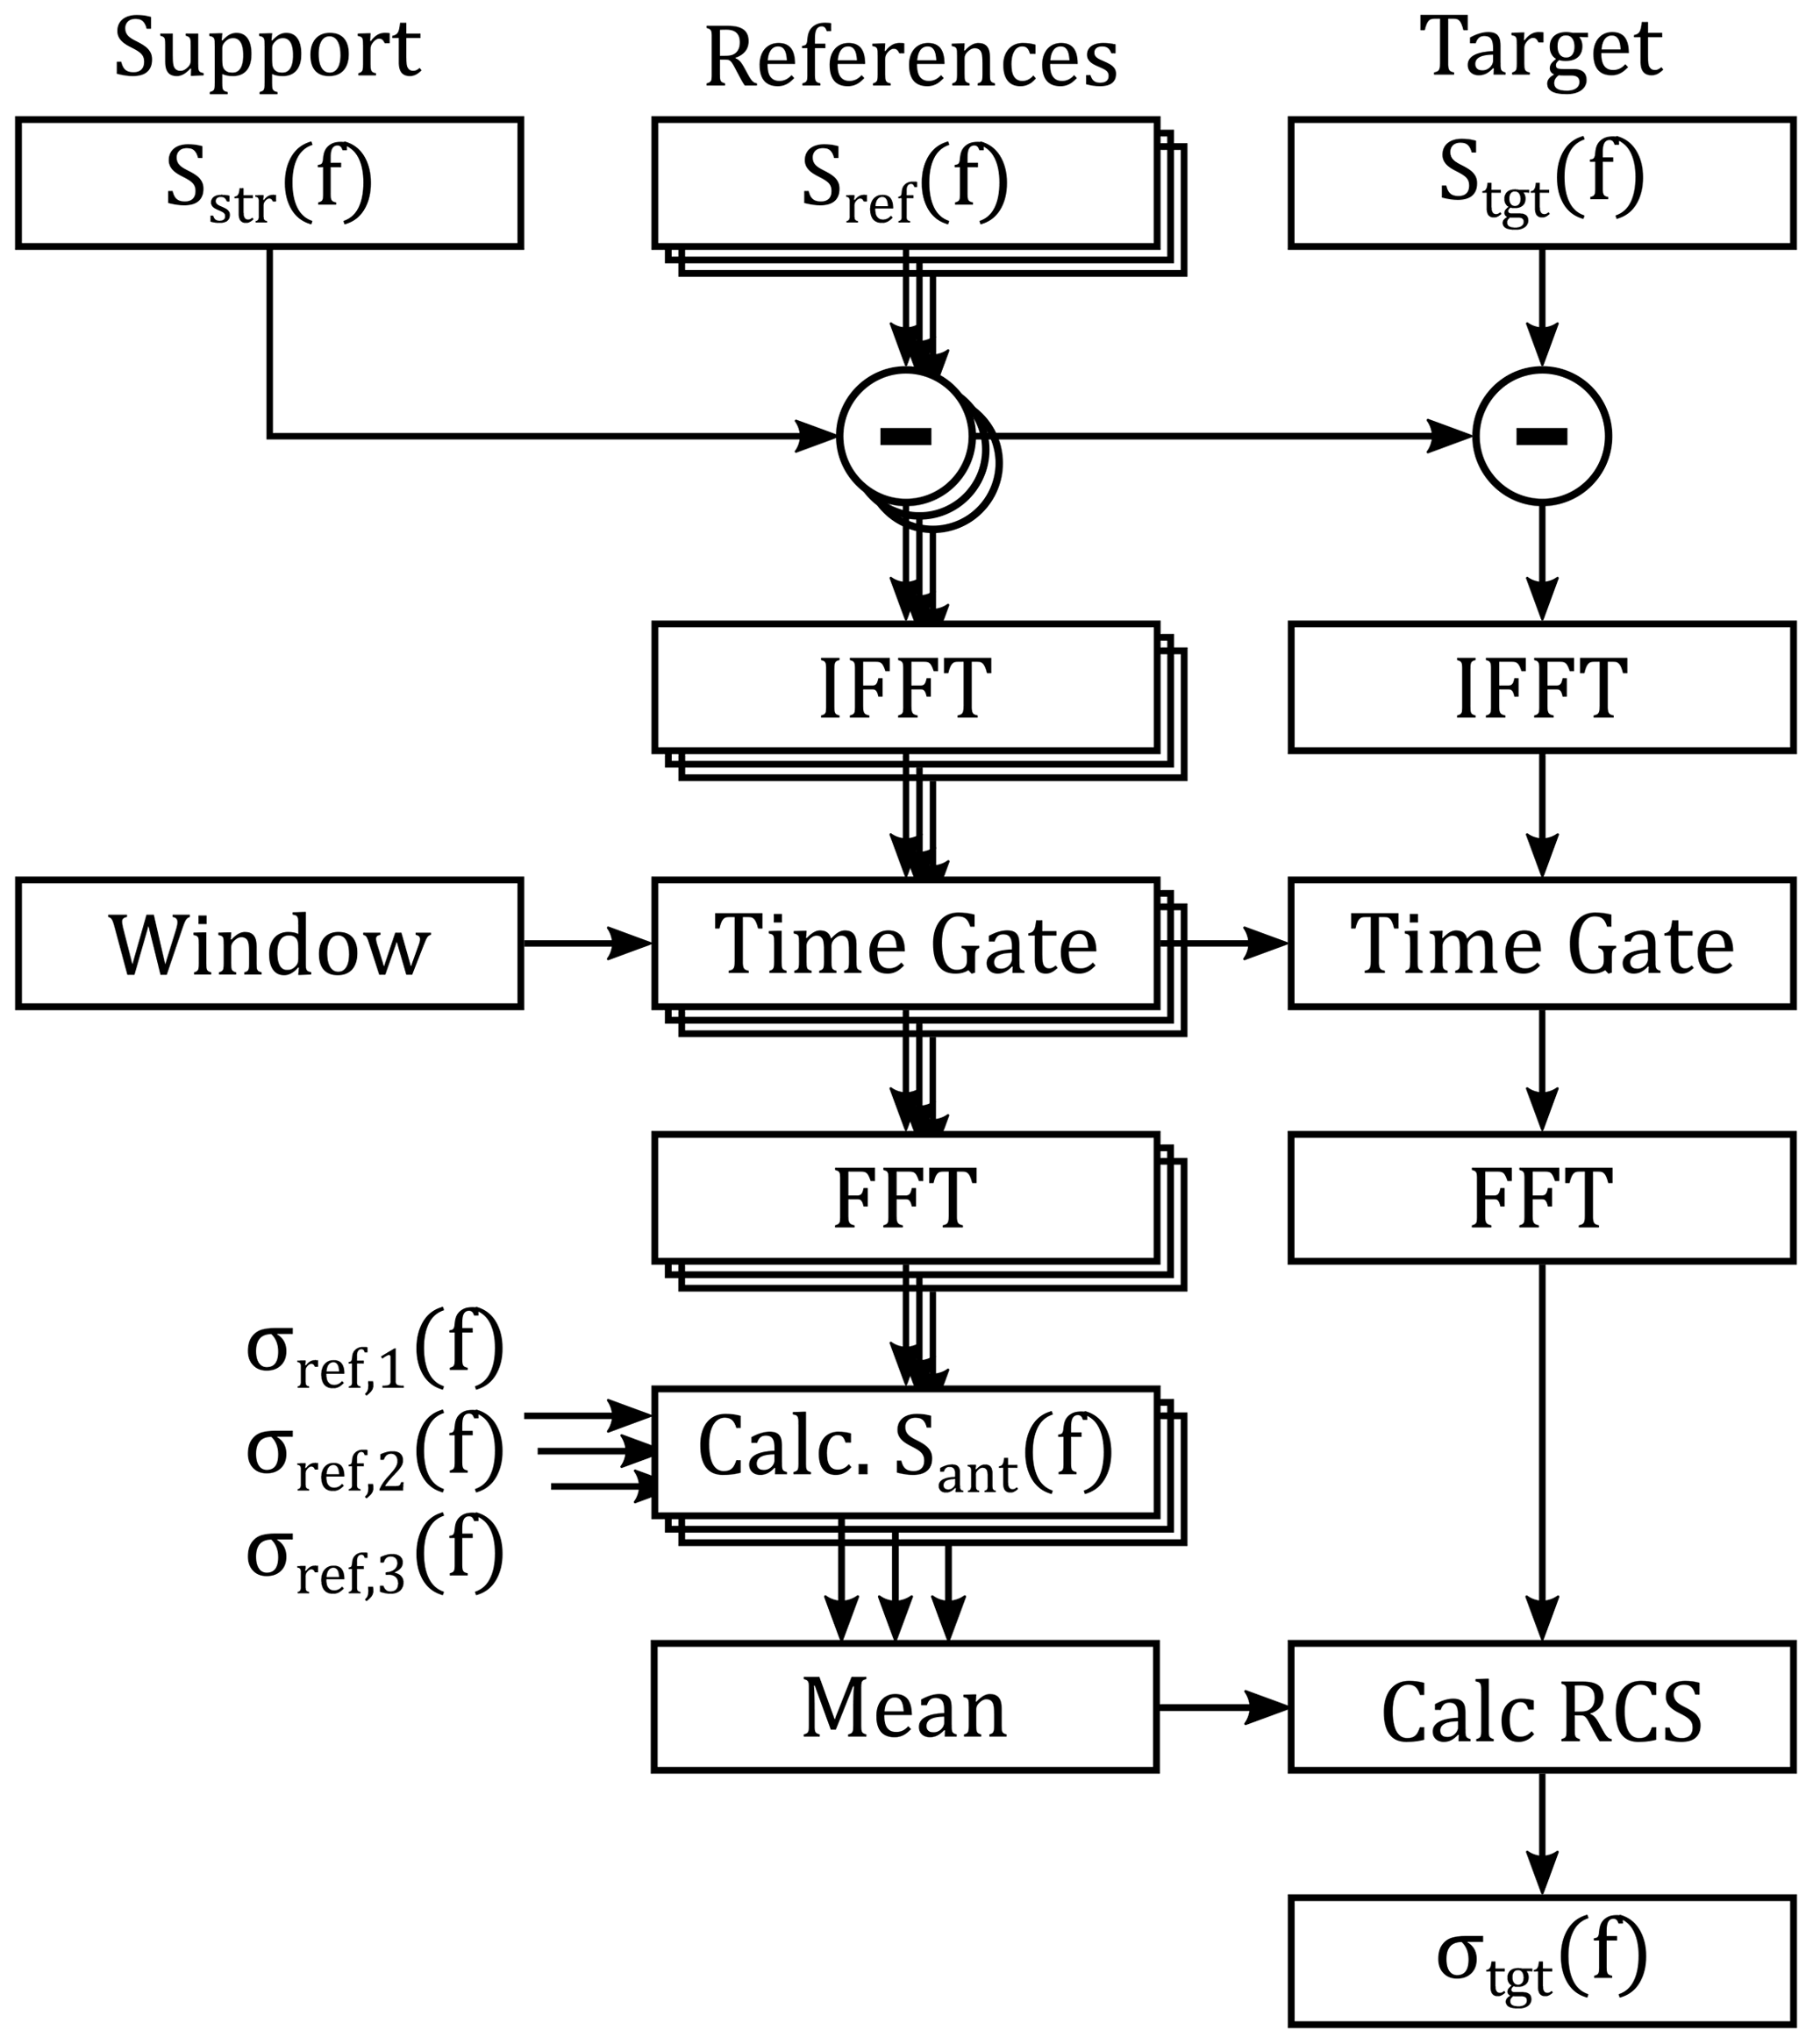
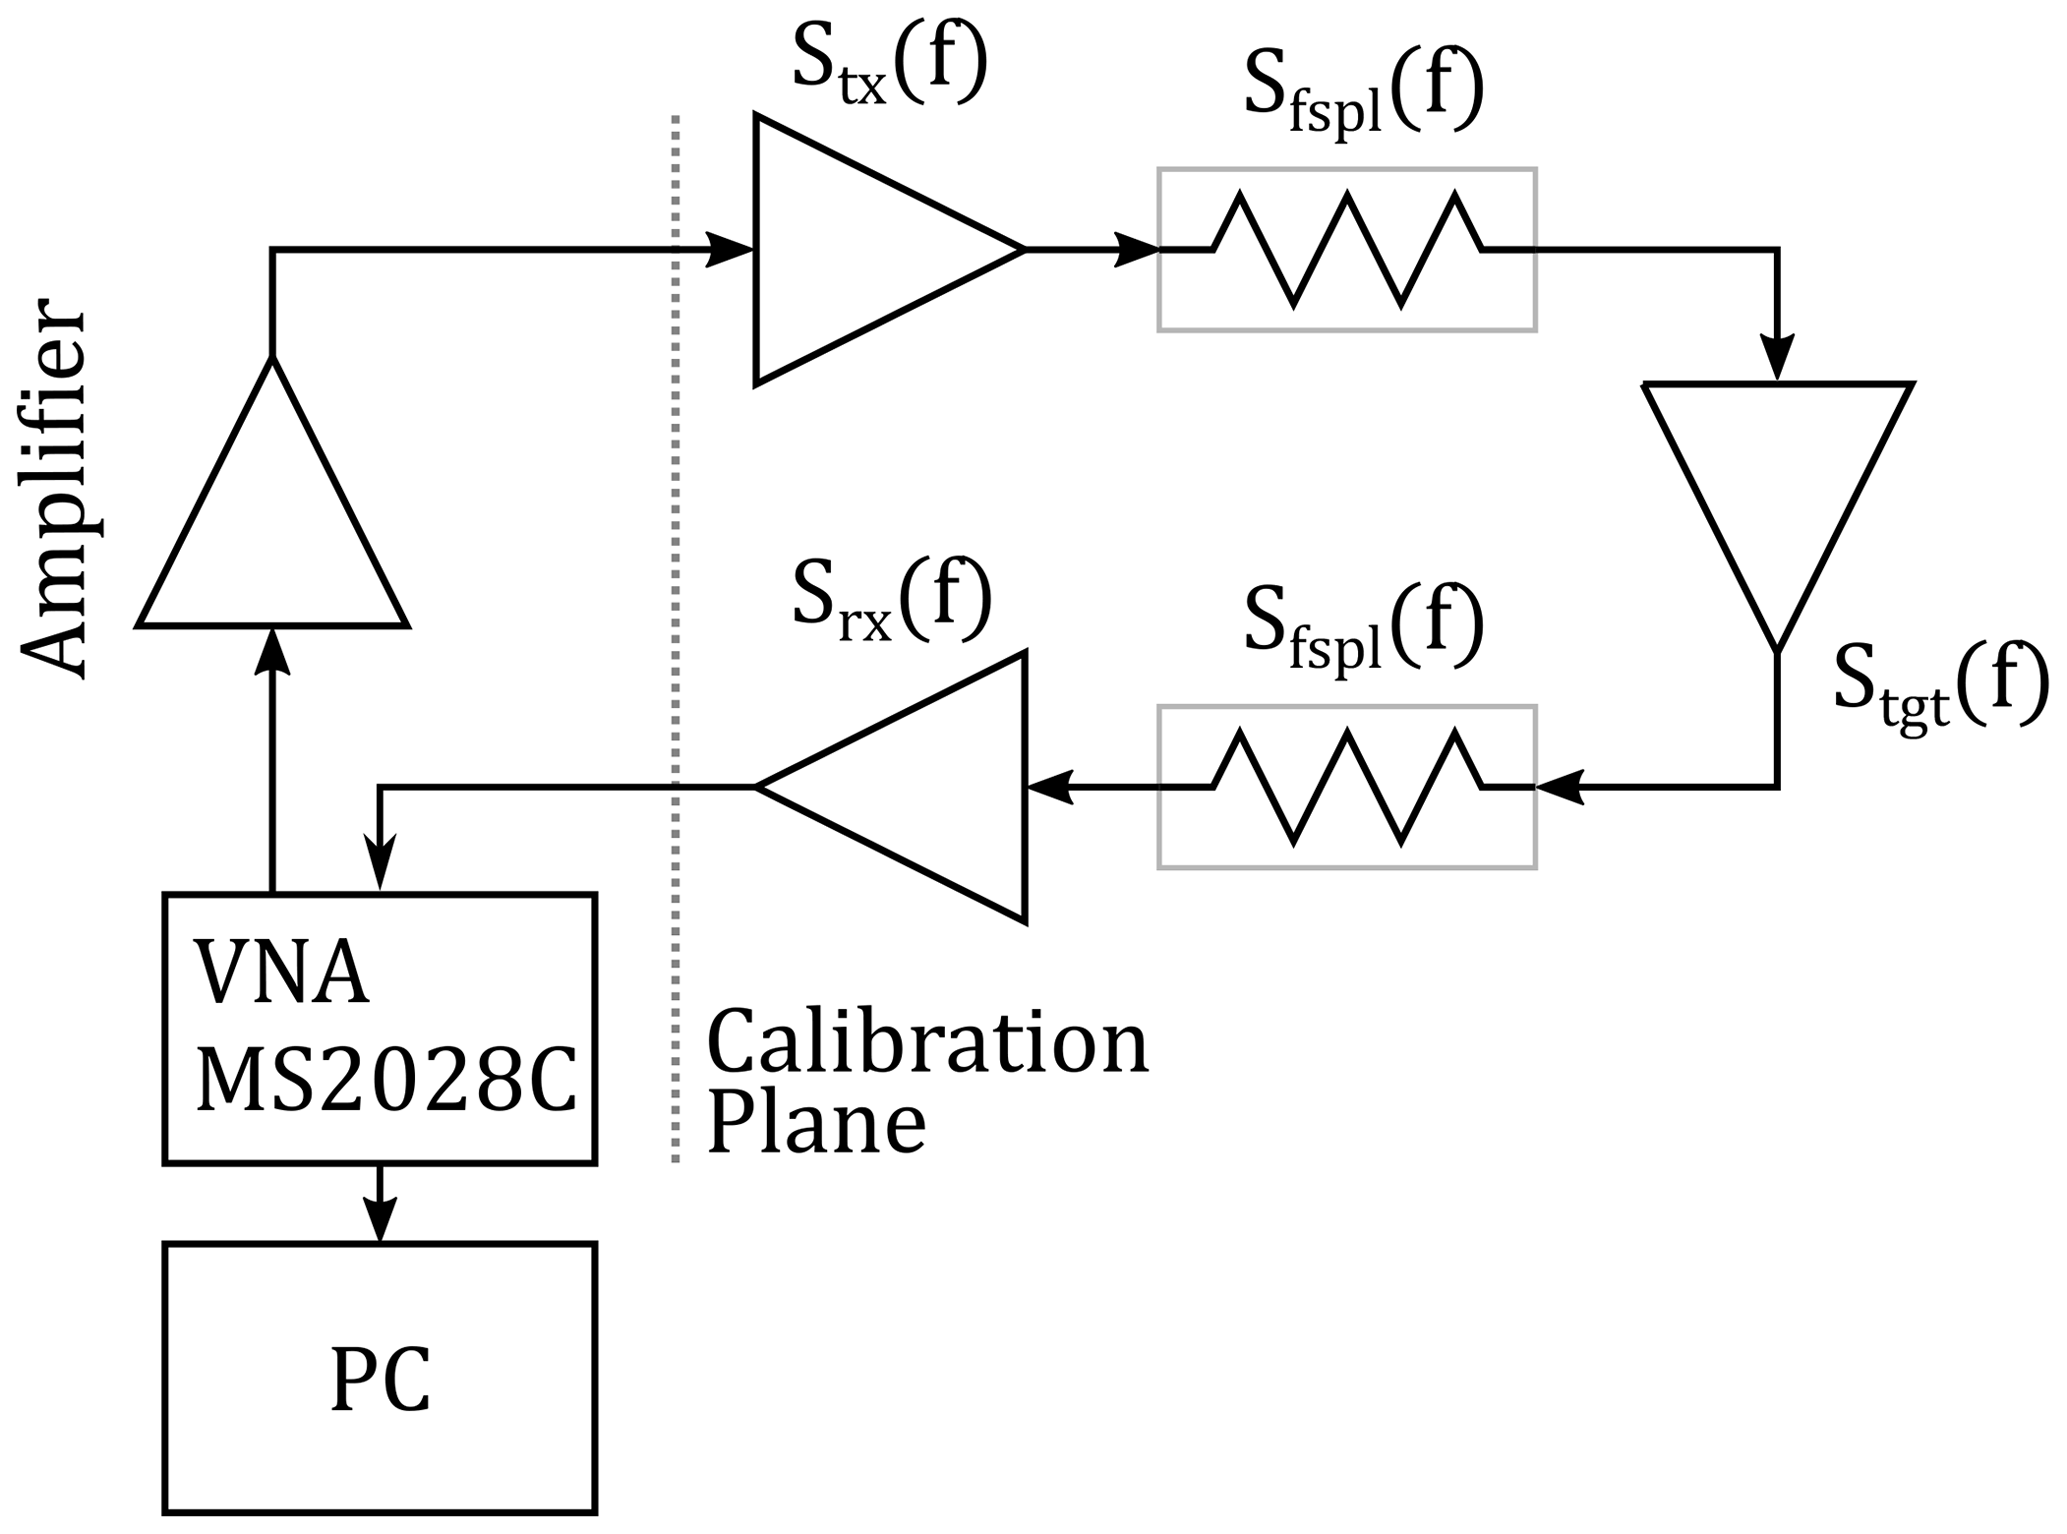
Radar cross-section measurements require the background reflections to be much lower than the reflections of the device under test. Although, anechoic chambers with special target holders meet this requirement, they are expensive and still have imperfections. To further reduce background reflections or to measure in environments where an anechoic chamber is not suitable, digital signal processing can be used to reduce background reflections. In this paper, a complete signal processing chain realized in Matlab is proposed, involving time gating of the measured target response and a background subtraction technique. Furthermore, the proposed signal processing includes a calibration procedure with either a single known calibration target or multiple known targets to improve measurement uncertainties. A compact measurement setup, consisting of a vector network analyzer and two horn antennas, is used to evaluate the overall performance and the advantages of a multiple known target calibration in a practical manner. The calibrated setup is able to measure the radar cross-section in a frequency range from 2 to 12 GHz with a mean error of less than 0.2 dB for both, VV and HH polarization combinations. It could also be shown, that a multi target calibration can result in an improvement of the measurement uncertainty by about 2.5 %.