Investigating Electromagnetic Interference Induced Risks for Autonomous Driving
Tim Brandt
Sven Fisahn
Martin Schaarschmidt
Unai Aizpurua
Erik Kampert
Stefan Dickmann
The results of immunity tests on components of self-driving automobiles to radiated high power electromagnetic (HPEM) pulses are presented in this work. It is of particular interest to investigate such automobiles' resilience towards deliberate attacks with electromagnetic interference (EMI). Different types of HPEM capabilities at the Bundeswehr Research Institute for Protective Technologies and CBRN Protection (WIS) in Munster are applied for this investigation. Two types of automotive components have been tested, a two-axis acceleration sensor and an electronic power steering unit. Statistics of errors from the devices under test (DUTs), as well as a characterization of the applied pulses are presented. A correlation can be drawn between the pulse repetition rate or the amplitude of the applied pulses and the severity of the effect on the DUTs.
- Article
(1403 KB) - Full-text XML
- BibTeX
- EndNote
The steady development in advanced driver-assistance systems (ADAS), enabling higher levels of autonomous driving (AD), implies a drastic increase in the quantity and density of electronic components for both civilian and military automobiles. Autonomous vehicles (AV) guarantee an extremely high safety level and hence they demand a vast number of sensors, actuators and controllers, as well as a high-speed data flow between them (Cesbron Lavau et al., 2023; Benz et al., 2019). As a consequence, assessing the impact of unintended and intentional electromagnetic interferences (EMI) in these electronic systems becomes of upmost importance (Ruddle and Martin, 2019; Kanyou Nana et al., 2009). The research presented here is focused on hostile attacks driven by the employment of IEMI. The devices-under-test (DUT) involved in these investigations are an off-the-shelf automotive peripheral acceleration sensor used in airbag and active suspension systems, and an electronic power steering unit. Evaluating their electromagnetic resilience (EMR) against (I)EMI is key for ensuring reliability and safety, because any derived malfunction could lead to wrong, delayed or lost data, which could have an influence in the decision-making behavior of the vehicle, thus ultimately leading to unintended actions or dangerous maneuver (Hamann et al., 2022). For the presented investigation, the DUTs have been subjected in an open TEM (transverse electromagnetic mode) waveguide to ultrawideband (UWB) pulses generated by pulse burst generators (PBG) with electric field amplitudes ranging in the double-digit kV m−1 range. Furthermore, the DUTs have been tested in an open area test site (OATS) with damped sinusoidal pulses (DSS). Both types of EMI signals and their corresponding generators were chosen as they cover possible realistic threat scenarios, and produce a broadband frequency effect on the victim as well (Sabath, 2022). Statistics of errors indicated by a proprietary software from the manufacturer, and measurements of the applied pulses are presented.
The electromagnetic pulses originating from the HPEM sources are measured with a free-field D-dot sensor. A free-field D-dot sensor has two asymptotic sensing elements positioned on opposite sides of a common ground plate. Therefore, a balun is used to convert these two unbalanced signals (of those two antennas) into a balanced one. The frequency responses of the D-dot sensor and the balun transformer must be considered for the intended measurement, which principally show the behavior of a first order high pass filter. Due to the fact that the spectral content of the measured signal is smaller than the cutoff frequency of the high pass filter representing the measurement chain consisting of the D-dot sensor and the balun, this type of E-field sensor generates an output voltage whose shape is the derivative of the time dependent electric flux density of the electromagnetic wave that passes through it. As the measured waveform could be of any shape, in order to reconstruct the signal, the voltage measured with the oscilloscope is integrated. The following parameters must be considered to reconstruct the waveform in its absolute figure: equivalent area of the D-dot sensor Aeq in m2, balun characteristic load impedance R in Ohms and attenuation of the measurement chain between D-dot sensor and oscilloscope (incl. balun insertion losses) att in dB. The voltage UDdot at the D-dot sensor is then derived from the voltage UOsci at the oscilloscope by compensating for path attenuation:
The differential electric field is then calculated by:
with ϵ0 being the vacuum permittivity of F m−1. The electric field is then obtained by integration of over time. A constant, small offset in the measured voltage needs to be compensated for mathematically, in order to remove its influence on the result of the integration.
The pulses to which the DUT is subjected to during the IEMI campaign have been characterized by free field measurement. The sources that generate the pulses are:
-
Kentech PBG5 and PBG7 (PBG stands for Pulse Burst Generator), which generate ultra-wideband pulses with double exponential shape and an output voltage of U=12 kV or U=45 kV peak, respectively. The pulse rise time is approximately 100 ps, while the pulse width is around 2.5 ns. Different operating modes can be selected, ranging from single pulse, here called “single shot”, to continuously pulsing with a pulse repetition rate of up to 500 Hz. The pulses are injected via a high voltage coaxial cable into an open TEM waveguide (OWG). The output signal of the PBG and the electromagnetic field propagating inside the OWG have approximately the same temporal shape.
-
HPEMcase, a mesoband source which generates a damped sine (Mora et al., 2014) with a fundamental frequency of 300 MHz and with an amplitude of about 6 kV m−1 at 20 m distance.
3.1 Measuring ultra-wideband pulse source
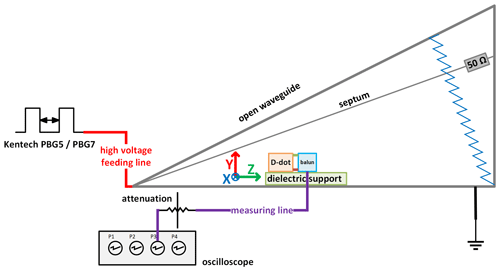
For characterizing the pulses of the PBGs, the D-dot sensor is positioned inside the OWG. A SMA cable transmits the measured signal towards an oscilloscope. An attenuator of 30 dB dampens the measured signal in order to protect the oscilloscope (Fig. 1). For the PBG5, the first measurements are carried out at a position with 1 m distance between the OWG's septum and ground plane. For this distance, the amplitude of the electric field component in V m−1 is equal to the amplitude of the generator's output signal in V. Due to the geometry of the open wave guide, it is expected that the vertical electric component of the EM field is the dominant component and the two other electric field components are assumed to be negligible in their strength relative to that. Thus, the vertical direction is of main interest and the D-dot sensor is oriented accordingly. The resulting electric field is presented in Fig. 2a. As expected, the number value of its peak is in the vicinity of the output signal peak in V. Next, the D-dot sensor is placed at a position inside the OWG where the height is 0.25 m. As one would expect, the peak value in V m−1 is four times higher, as shown in Fig. 2b. For the corresponding field generated by the PBG7 at a measurement position with 1 m septum height, the number-value of its peak is also close to the output signals peak in V (Fig. 2c).
3.2 Measuring mesoband pulse source
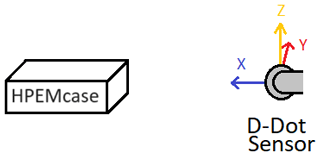
The electromagnetic field generated by the HPEMcase source is more complex, as it originates from a dipole source and its characteristics experience a transition from near field to far field over the distance of interest. At selected distances between DUT and source, each three measurements were taken. Each of these three measurements corresponds to one of the three orthogonal spatial components of the electric field. The D-dot sensor positions were located at a distance from the HPEMcase of 16, 8, 4, 2 and 1 m, respectively (Fig. 3). The definitions of the spatial components for the field measurement are shown in Fig. 4. An optical fiber line was used to electrically decouple the measurement system from the excited D-dot sensor.
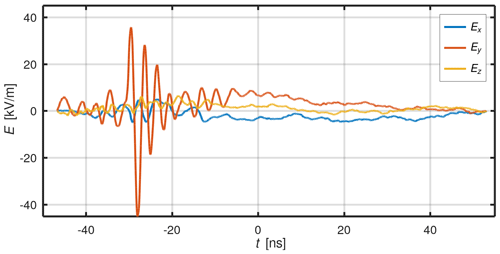
A second D-dot sensor was used as a reference field sensor at a fixed distance (16 m) to check whether there were major fluctuations in both the pulse strength and shape. A military communications shelter was used as a Faraday cage for the final stage of the measurement chain. There, a converter box transformed the two optical signals back into electrical signals. This box was controlled by a notebook, which also enables adjusting the attenuation of the converters on the sensor side. This was especially important for the sensor when varying its position. In this way it could be ensured that the signals did not saturate the oscilloscope channel upon decreasing the distance between the DUT and the HPEM-source. The selected attenuation values were taken into account during signal reconstruction. Finally, the two electrical signals were guided by SMA cables to an oscilloscope and saved as time series. Figure 5 shows as an example the three components of the E-field at a distance of 1 m. In this measurement, the radiating element of HPEMcase is orientated horizontally. Since the radiating element or antenna structure is essentially dipole-like, it posseses a torus-shaped radiation pattern. Thus, in this orientation, the y-component of the E-field is clearly dominating. In this signal the damped sine is recognizable, albeit it does not start as abrupt as an idealized, mathematical curve of this type.
Figure 6a shows the peak values for the three components of the electric field over the different distances. The y-component remains dominant. The value increases following a 1 distance dependence, as typical for far field conditions. A second series of measurements were taken with the HPEMcase reoriented by 90°. Consequently, the radiating element was reorientated, from the previous horizontal to a then vertical orientation. Figure 6b shows that this reorientation only changes which electric field component is dominant, now the z-component. When comparing Fig. 6a and b, the difference between the absolute values of the dominant components of the electric field can be explained by small typical variations of the intensity of the HPEMcase pulses.
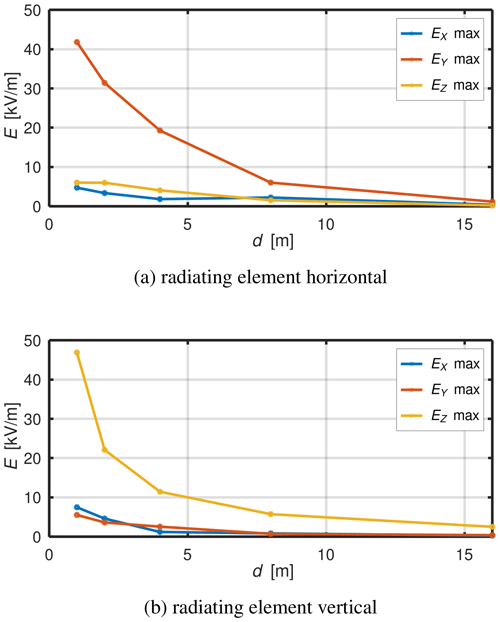
Figure 6Maximum electric field from the pulse, in dependence of distance d beetween the HPEMcase and D-dot sensor. X-component: blue, Y-component: red, Z-component: gold.
The measured amplitudes were lower than the maximal case in the device's specification/user manual. The amplitude is dependent on many factors, like external air humidity, internal gas pressure, additional antenna rods, and set frequency. The measurement campaign was focused on having a well characterized signal rather than achieving the maximum theoretical possible signal strength.
4.1 Acceleration sensor
The first DUT is a two axis acceleration sensor from an automotive supplier, used primarily for impact detection as a part of airbag systems, or for active suspension systems. The accelerometer contains a microelectromechanical system (MEMS) comprising fixed and moving finger structures and spring pins. The seismic mass with its comb-like electrodes is resiliently suspended in the metering cell. A linear acceleration in the sensing direction changes the distance between the moving and fixed structures, which alters the overall capacitance. The associated measured electronic signal is then transmitted to a line impedance stabilization network (LISN) and further to a fiber-optic transmitter. Since both the LISN and the transmitter are not DUTs, they are placed inside a Faraday cage. Because they are positioned either nearby or inside the OWG, it is essential that they are shielded. In several meters distance, the signal is converted back by a fiber-optic receiver. With another pair of insulated copper wires it is then transmitted to an electronic control unit (ECU), where it is digitized by an application specific integrated circuit (ASIC). Finally, that signal is sent via a USB cable to a notebook. Errors are indicated by a proprietary software from an automotive supplier which interprets the readings of the ECU.
The maximum electric field the sensor was subjected to was 180 kV m−1 with the PBGs, and 40 kV m−1 with the HPEMcase, which is 4.5 times lower. Neither with the PBGs, nor with the HPEMcase the sensor could be disturbed. It should be noted that the HPEMcase pulse is 5 times longer and therefore not necessarily transmits less energy than a pulse of the PBG7.
4.2 Electronic power steering unit
The second DUT is an electronic power steering from an automotive supplier. It could be influenced when subjected to pulsed electric fields from the PBG5, the PBG7, and the HPEMcase.
This device has a proprietary diagnosis software, which is running on a so called LabCar. The communication between the LabCar and the DUT is realized via a CAN bus. For decoupling the DUT and the LabCar, which was located outside the test environment in the control room, a CAN optical transceiver system was used, so that only the EM-interference effects on the sensor itself were observed.
With increasing field strength and/or increasing pulse repetition rate, the number and severity of the errors increased. However, it never went into a non recoverable state. Even at the strongest field strengths it was subjected to (90 kV m−1), it successfully went into a fail-safe mode, here called “limp home”, which allows rudimentary steering for the driver.
Classified in effects by duration (Sabath, 2008), “No Errors” means category “N”, no effect. “Errors” and “limp home” both are within category “H”: resistant until human intervention. It should be noted that the human intervention was just a manual reset of the system. No effects of type P – “permanent or until replacement” – appeared, since no repair or replacement of parts was necessary in order to restore the full functionality of the remote steering device.
Classified in effects by criticality (Sabath, 2008), “No Errors” again means category “N”, no effect. “Errors” mean category “1”: “The appearing disturbance does not influence the main mission”. “limp home” mean category “2”: “The appearing disturbance reduces the efficiency and capability of the system.”. No effects of type 3 – “loss of main function” – appeared, since the steering function was never completely disabled.
For the PBG-pulses within the OWG, two cases were investigated. One was placing the electronic power steering unit in an electrically floating state, isolated from the ground plane of the OWG by a polystyrene block. The other one was when grounding it by bridging that isolation with copper tape.
As the results for the electrically floating and the grounded state are the same, the disturbances due to different field strengths and pulse repetition rate from PGB5 and PGB7, for the floating case, are combined in Table 1.
Table 1Effects on an electronic power steering unit for different electric field strengths and pulse repetition rates (si.sh. = single shot) from PBGs.
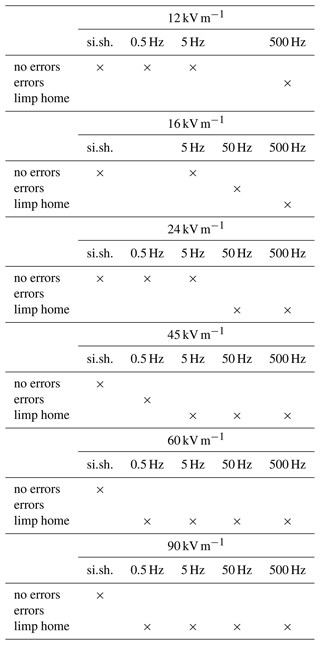
The disturbances due to the HPEMcase were registered at different distances. Since the HPEMcase is approximately a dipole source, this leads to different field strengths. Two different orientations were tested, one such that the HPEMcase's radiating element is horizontal and one where it is vertical. As the results for horizontal and vertical orientation are the same, they are combined and presented in Table 2. When reducing the distance to the disturbance source, the DUT changes directly from “No Errors” to “limp home” – mode.
Pulses from wideband and mesoband sources have been characterized to ensure a complete understanding of the conditions the DUTs are subjected to during the presented EMR test campaign. Obtained results of the immunity test of an acceleration sensor to broadband pulses indicate that this DUT is resistant to field strengths of up to 180 kV m−1 for this kind of IEMI signal. The same DUT is undisturbed up to field strengths of 40 kV m−1 of mesoband pulses which have a longer duration than the applied wideband pulses. An electronic power steering unit was subjected to the same wideband and mesoband pulses and is affected by these types of IEMI signals. The severity of the disturbance increases with increasing field strength. However, even under the stronger pulses it is subjected to, it successfully goes into a fail-save mode, where it retains minimum functionality. Furthermore, every time a pulse sequence finishes, the functionality of the DUT can be fully restored by resetting the system. The electronic power steering unit also displays a dependence on the pulse repetition rate of the broadband IEMI source, a higher pulse repetition rate constitutes more disturbance. Future resilience tests are intended to make use of smallband sources. Also additional DUTs may be tested.
The data presented in this article is available from the authors upon request.
The measurements and data processing including all graphical representations were carried out by TB. Editorial hints as well as mathematical and physical suggestions were given by UA, EK, MS, SF, and SD.
The contact author has declared that none of the authors has any competing interests.
Publisher's note: Copernicus Publications remains neutral with regard to jurisdictional claims made in the text, published maps, institutional affiliations, or any other geographical representation in this paper. While Copernicus Publications makes every effort to include appropriate place names, the final responsibility lies with the authors.
This article is part of the special issue “Kleinheubacher Berichte 2023”. It is a result of the Kleinheubacher Tagung 2023, Miltenberg, Germany, 26–28 September 2023.
The authors would like to thank the laboratory and workshop staff of the HPEM and Electromagnetic Effects branch at the Bundeswehr Research Institute for Protective Technologies and CBRN Protection in Munster, Germany.
This paper is funded by dtec.bw – Digitalization and Technology Research Center of the Bundeswehr (project ESAS – Elektromagnetische Störfestigkeit autonomer Systeme). dtec.bw is funded by the European Union – NextGenerationEU.
This paper was edited by Frank Gronwald and reviewed by two anonymous referees.
Benz, J., Klaedtke, A., Hansen, J., and Frei, S.: Analysis of Immunity Failures and Optimization Measures in Automotive Sensors, 2019 International Symposium on Electromagnetic Compatibility – EMC EUROPE, 2–6 September 2019, Barcelona, Spain, 1014–1019, https://doi.org/10.1109/EMCEurope.2019.8871989, 2019. a
Cesbron Lavau, L., Suhrke, M., and Knott, P.: Susceptibility of Commercial-Off-The-Shelf Sensors to IEMI using Pulse Modulated Signals, Adv. Radio Sci., 20, 37–45, https://doi.org/10.5194/ars-20-37-2023, 2023. a
Hamann, D., Doering, O., and Koj, S.: EMV in der Kfz-Technik, ser. GMM Fachberichte, Chap. 12 – Elektromagnetische Resilienz autonomer Fahrfunktionen, Society of Microelectronics, Microsystems and Precision Engineering (VDE/VDI GMM), 72–76, ISBN 978-3-8007-5698-8, 2022. a
Kanyou Nana, R., Korte, S., Dickmann, S., Garbe, H., and Sabath, F.: Estimation of the threat of IEMI to complex electronic systems, Adv. Radio Sci., 7, 249–253, https://doi.org/10.5194/ars-7-249-2009, 2009. a
Mora, N., Vega, F., Lugrin, G., Rachidi, F., and Rubinstein, M.: Study and classification of potential IEMI sources, System Design and Assessment Notes, Note 41, Infoscience EPFL, https://ece-research.unm.edu/summa/notes/SDAN/0041.pdf (last access: 25 October 2024), 2014. a
Ruddle, A. R. and Martin, A. J. M.: Adapting automotive EMC to meet the needs of the 21st century, IEEE Electromagnetic Compatibility Magazine, 8, 75–85, 2019. a
Sabath, F.: Classification of electromagnetic effects at system level, 2008 International Symposium on Electromagnetic Compatibility – EMC Europe, 8–12 September 2008, Hamburg, Germany, 1–5, Hamburg University of Technology in Hamburg, Germany, ISBN 9781424440979, 2008. a, b
Sabath, F.: Modellierung von Szenarien vorsatzlicher elektromagnetischer Beeinflussung, Habilitation, Fakultaet fuer Elektrotechnik und Informatik der Gottfried Wilhelm Leibniz Universitaet Hannover, https://www.repo.uni-hannover.de/handle/123456789/10467 (last access: 1 September 2022), 2020 a


