 | 04 Sep 2018
IRI the International Standard for the Ionosphere
This paper gives a brief overview over the International Reference Ionosphere (IRI) project and model. IRI is recognized as the official standard for the ionosphere by the International Standardization Organization (ISO), the International Union of Radio Science (URSI), the Committee on Space Research (COSPAR), and the European Cooperation for Space Standardization (ECCS). Of great importance are the external drivers of the model that help IRI to represent ionospheric conditions as realistically as possible. The paper discusses the drivers currently used presents recent improvements and changes. Besides the standard solar, magnetic, and ionospheric indices the paper also reports on the adjustment of the model with data and equivalent indices and on the progress towards a Real-Time IRI using data assimilation. IRI has been widely validated with many different data sources and has fared very well in community wide assessment studies. We present some of these studies and document the wide usages of the model in the scientific literature. Finally, we present an outlook on things to come in IRI-2018 and thereafter.
- Article
(1747 KB) - Full-text XML
- BibTeX
- EndNote


Figure 1Brief history of the IRI project with the most important milestones. Note: IRI-79 is also described in Rawer et al. (1978b).
The International Reference Ionosphere (IRI) project started in the late sixties when the Committee on Space Research (COSPAR) and the International Union of Radio Science (URSI) recognizing the need for an international standard set up an Inter-Union Working Group with the goal of developing an international standard ionosphere. The charter given to the group was as follows:
-
IRI is an international project jointly sponsored by the Committee on Space Research (COSPAR) and the International Union of Radioscience (URSI) to develop and improve a reference model for the most important plasma parameters in the Earth ionosphere
-
COSPAR's prime interest is in a general description of the ionosphere as part of the terrestrial environment for the evaluation of environmental effects on spacecraft and experiments in space.
-
URSI's prime interest is in a reference model for defining the background ionosphere for radiowave propagation studies and applications.
-
The model should be primarily based on experimental evidence using all available ground and space data sources and should not depend on the evolving theoretical understanding of ionospheric processes.
-
As new data become available and as older data sources are fully evaluated and exploited, the model should be revised in accordance with these new results.
-
Where discrepancies exist between different data sources the IRI team should facilitate critical review and discussions to determine the reliability of the different data sets and to establish guidelines on which data should be used for IRI modelling.
Figure 1 gives a brief overview of the most important highlights and milestones of the IRI project from the beginning in 1968 to becoming the international ISO standard for the ionosphere in 2014, and the most recent publication of the latest version of the IRI model (Bilitza et al., 2017). New versions were released as new data became available and as old data were fully exploited for the modelling process. Better mathematical techniques and appropriate functional representation also contributed to the steady increase in accuracy of the model. From early on IRI was made openly available and was distributed first on magnetic tape, then punched tape, then punched cards, and from 1995 onward online. Figure 1 also tracks the steps from originally just a set of tables for specific conditions to a fully analytical global model and lists the data used for each step. All information about the model can be found at irimodel.org including the FORTRAN model code, links to IRI applications, and access to an online interface for computing IRI parameters.
IRI is the synthesis of almost all available and reliable ionospheric data. The IRI Working Group's (60+ experts) global distribution has helped to gain access to the global data base. The different data sources that have contributed to the built-up of IRI are depicted in Fig. 2 including data from ground-based observatories as well as spacecraft instruments. Combining the global picture recorded by satellites for different local times and levels of solar activity with the 24∕7 365 analysis provided by ground stations is one of the core principle of the IRI development. An important first step here is to confirm that both techniques (from the ground and from space) get the same result when observing the same volume in space at the same time. IRI helped to resolve conflicting measurements by bringing together the ionospheric ground and space communities during biannual IRI workshops. Two examples of still existing conflicts are shown in Figs. 3 and 4. The data points in Fig. 3 show simultaneous ground and space measurements of the electron temperature at 840 km altitude. These measurements were acquired while one of the DMSP satellites flew over the Incoherent Scatter Radar (ISR) station at Millstone Hill. Large discrepancies are found at very low and very high temperatures. This may be due to data analysis problems both techniques encounter at the very low electron densities in the topside ionosphere. In Fig. 4 we compare different models for the F-peak height hmF2, that were developed with different data sources. All three model options are included in the latest version of IRI, IRI-2016. The IRI-M(3000)F2, IRI-AMTB, and IRI-Shubin models were developed with ionosonde data for the propagation factor M(3000)F2 (CCIR, 1967; Bilitza et al., 1979), with ionosonde data for hmF2 (Altadill et al., 2013), and with COSMIC radio occultation data (Shubin et al., 2013; Shubin, 2015), respectively. Figure 4 shows the variation of these three models from 1958 to 2015 during winter noon conditions at mid-latitudes. While the three models agree well during the solar cycle minimum, large and consistent discrepancies are found at high solar activities, pointing to potential discrepancies between these different techniques.
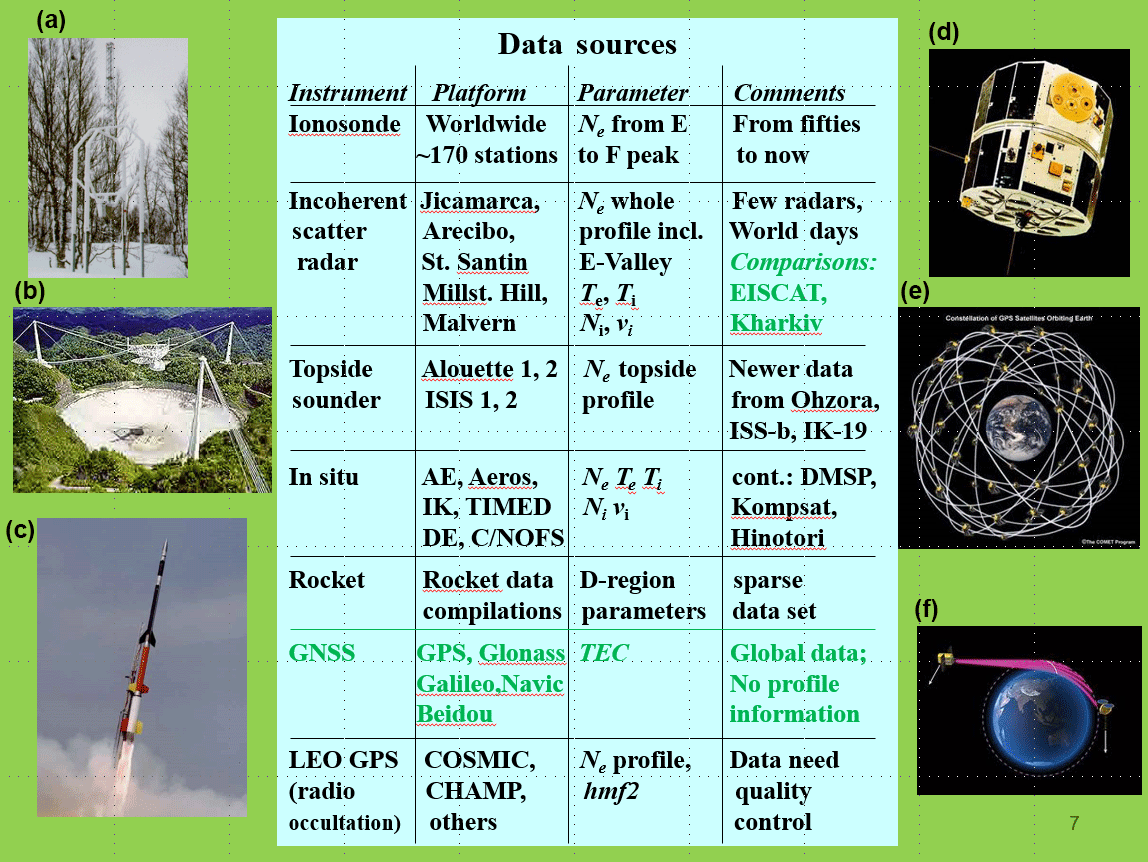
Figure 2The data sources used for the development of IRI with depictions of the instruments that accumulated these data sources: ionosondes (a), incoherent scatter radars (b), rockets (c), topside sounder and in situ satellites (d), Global Navigation Satellite Systems (e), and radio occultation (f). Data sources highlighted in green have been used for validation but not yet for model development.
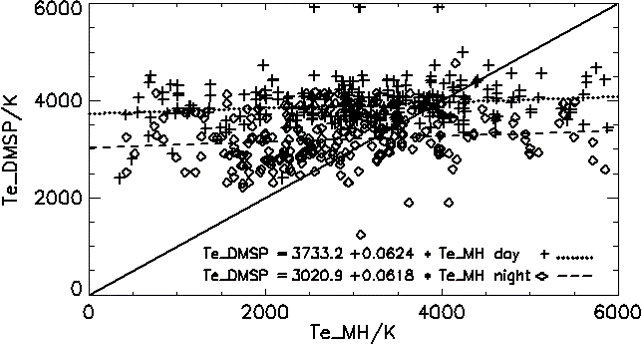
Figure 3Comparison of simultaneous measurements of electron temperature over Millstone Hill at 840 km with the Millstone Hill incoherent scatter radar (Te_MH) and with the DMSP Langmuir Probe instrument (Te_DMSP) separated into daytime and night-time values. Also show is the Te_MH = Te_DMSP line (solid line) and the least-square fits to the day (dotted lines) and night values (dashed lines).
IRI describes monthly averages of electron density, electron temperature, ion temperature and ion composition (, Cluster ions) in the altitude range 50–2000 km on the whole globe. Being a data-based model IRI's reliability depends on the spatial and temporal coverage provided by the underlying data base. High data density at northern mid-latitudes guarantees good accuracy whereas the performance is not as good in data sparse regions like the high (auroral and polar) and low (equatorial) latitudes. IRI uses a modular approach which allows to replace a specific sub-model without affecting the other model parts, e.g., global models at profile anchor points are connected with profile functions. In the case of the electron density these anchor points are the E and F-peaks while in the case of the electron temperature the anchor points are at fixed heights (300, 400, 600, 1400, and 3000 km). 44 switches allow the user to customize their application of IRI, e.g., turn certain features (storm model) on/off or choose between different model options for a specific parameter in a specific altitude range. Allowing different options for the same parameter simplifies the phasing in of new models with validation help from the users.
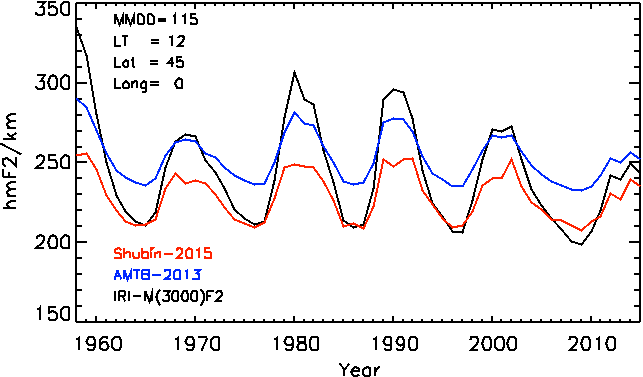
Figure 4Comparison of the three model options for the F-peak height hmF2 in IRI for the years 1958 to 2015 in the month of January, local time = 12 noon, and the latitude/longitude = 45∕0∘. IRI-M(3000)F2 is based on ionosonde measurements of propagation factor M(3000)F2 and the relationship between hmF2 and M(3000)F2 (Bilitza et al., 1979); AMTB-2013 is based on digisonde measurements of hmF2 (Altadill et al., 2013); Subin-2015 is the model developed by Shubin et al. (2013) and Shubin (2015) based primarily on COSMIC radio occultation data.
The improvements implemented with the latest version of the IRI model, IRI-2016, were introduced and discussed by Bilitza et al. (2017) and will not be repeated here. In the next chapter we will discuss the drivers that are being used in IRI including indices as well as actual measurements. The third chapter highlights some of the IRI successes and we close with an outlook at future improvements that are expected from ongoing projects.
There are a number of different ways in which measurements are being used to drive IRI towards describing conditions as realistically as possible: (1) solar, magnetic, and ionospheric indices that are deduced from solar, magnetic, and ionospheric measurements; (2) equivalent solar or ionospheric indices obtained by adjusting the model to ionospheric measurements; (3) direct updates locally if measurements of characteristic parameters are available; (4) assimilation of available data into the IRI background model.
2.1 Solar and ionospheric indices
The traditional method is to use indices which are themselves deduced from measurements. In IRI we use solar, magnetic, and ionospheric indices. Table 1 lists the solar and ionospheric indices applied in the different IRI sub-models.
Table 1Indices used in the different IRI sub-models.
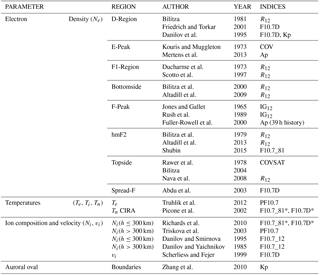
R = “old” sunspot number, R12 = 12-month running mean of sunspot number, F10.7D = daily solar radio flux at 10.7 cm wavelength, F10.7_12 = 12-month running mean of F10.7, F10.7_81 = 81-day running mean of F10.7, PF10.7 = (F10.7_81 + F10.7D)∕2, COV = 63.75 + ), COVSAT = COV if COV > 188.then COVSAT = 188, IG = Global Ionospheric index, IG12 = 12-month running mean of IG, Kp, Ap = 3-hourly indices based on auroral magnetometer measurements, * Index of prior day

Figure 5F10.7 solar radio flux index variation from 2015 to 2017. Shown are the daily index (black curve), the 81-day (3 solar rotations) average (green curve) and the 365-day average (blue curve).
Sunspot number R, which is related to the number of spots and spot groups observed on the sun, was the index of choice for many of the early ionospheric models and is still being used by some of the older IRI sub-models. Most often the models depend on the 12-month running mean of R (denoted R12). Statistical studies had found much higher correlation between R12 and ionosonde-measured foF2 (the F2 peak plasmas frequency) than between the daily value or the monthly average of R and foF2. This is understandable because daily and monthly variation of ionospheric parameters are not only affected by the solar input but also by the forcing from below (atmosphere) and above (magnetosphere). R is obtained and distributed by the Solar Influences Data analysis Center (SIDC, http://sidc.oma.be/, last access: 20 July 2018) in Brussels, Belgium. A recent review of the way R is determined from observations of spots and groups of spots on the Sun resulted in a recalibration of the R computation (Clette et al., 2014). The new method is now internationally accepted and the new sunspot number is distributed by SIDC. The new index exceeds the old one by about a factor of 1.4. Models like IRI that were developed with the old R index need to account for this transition to a new index. In the case of IRI this is done by using the new index with a scaling factor of 0.7. Gulyaeva (2014) has shown that 0.7 is a very good estimate for the ratio of the 12 month running mean of these two indices. Future modelling efforts are strongly encouraged to use the solar radio flux F10.7 instead of the sunspot number for the representation of variations with solar activity.
F10.7 is the solar radio flux at 10.7 cm wavelength that has been measured consistently since 1947, first at Ottawa, Ontario and then at the Penticton Radio Observatory in British Columbia both in Canada. Besides the daily F10.7 index IRI uses the 81-day (3 solar rotations) and the 365-day running mean of F10.7 as indicated in Table 1. For the topside electron temperature and ion composition a combination of daily and 81-day indices, PF10.7 = (F10.7_daily + F10.7_81)∕2, generated the best results. Figure 5 illustrates the differences between these indices. Only the daily index follows the 27-day solar rotation. With the 365-day smoothing the dominant pattern is the 11-year cycle. The IRI indices file APF107.DAT includes the F10.7 index adjusted to 1 AU. This is the index consistently provided by the distribution sites. In IRI-2016 the adjusted flux is back-ward corrected for the changing Earth-Sun distance to obtain the F10.7 index observed at the ground. It is not always clear which F10.7 indices (“adjusted” or “observed”) were used in developing a specific IRI sub-model. In IRI-2016 the observed flux is used for NRLMSIS00 (computation of neutral temperature) and IRI-FLIP (computation of ion composition in the bottomside ionosphere). The difference of observed minus adjusted flux varies from −7 flux units in December to +7 units in June.
The Ionosonde Global (IG) index is obtained by adjusting the solar cycle variation of the CCIR (1967) foF2 model to ionosonde measurements of foF2. IG was introduced by Liu et al. (1983) and is being produced and distributed by the UK Solar System Data Centre (https://www.ukssdc.ac.uk/) with values going back to 1932. The CCIR model provides monthly averages of foF2 and accordingly IG is a monthly index and not a daily index. Indices are calculated at each ionosonde station and then IG is obtained as the global median. Originally 13 stations were used but the current index is obtained with only 4 stations (Chilton/U.K., Port Stanley/U.K., Kokubunji/Japan, and Canberra/Australia). IG has the advantage over solar indices that it is obtained from a ionospheric measurement and so includes dynamic effects not covered by a solar index. Disadvantages are (i) the averaging over several globally distributed station thereby smoothing out any regional differences; (ii) the change in number of stations over time affecting regional representation; (iii) only noontime data are used to produce the index; (iv) should be only used with the CCIR (1967) foF2 model not with other foF2 models. Because the global index smooths out regional differences it was found that foF2 is more closely correlated to the 12-month running mean of IG (IG12)than to the monthly IG and therefore IG12 is used with CCIR-foF2 in IRI. Brown et al. (2018) found that with hemispheric IG indices the monthly indices perform better than the 12-month running means. They showed that use of these monthly hemispheric indices improves IRI model performance by almost a factor of 2. This is largely due to the fact that there are significant hemispheric differences between the station-specific IG values that are smoothed out with a global index. Themens and Jayachandran (2016) underscore this point in their study of IRI performance in the polar cap and subauroral region noting that the use of a monthly IG index, in place of the IRI's standard IG12 index, leads to an improvement in TEC specification by up to 6 TECU.
In IRI these indices can be obtained from an internal file based on the date or the user can enter his/her own indices values for R12, IG12, F10.7_daily, and/or F10.7_81. Following user request starting with IRI-2016 the code now automatically adjusts IG12 if only R12 is provided by the user and vice versa using the approximate functional relationship between the two indices IG. For F10.7 all F107 indices (F10.7_daily, F10.7_81, and F10.7_365) are set to the same user-specified value if only one of them is specified. This was done to facilitate solar activity studies because a user may not always know which solar index affects which parameter.
2.2 Equivalent indices
An equivalent index is obtained by varying the model-driving index or indices until agreement is achieved between data and model. This is a method widely used for station-specific modelling. For regional or global modelling an averaging or interpolation process has to be applied to cover the region in between stations. Different data sources have been used for this purpose in conjunction with IRI. Most efforts have concentrated on obtaining equivalent R12 or IG12 indices because of the dominant role these two indices play in determining the F2 peak height and density, respectively. Bilitza et al. (1997) used worldwide ionosonde data from 1986 to 1989 to obtain equivalent IG indices with the goal of improving IRI ionospheric corrections for the altimeter measurements aboard the Geosat satellite. Komjathy et al. (1998) described a method of updating IRI with GPS total electron content (TEC) maps based on the grid of equivalent IG values corresponding to the TEC grid. Hernandez-Pajares et al. (2002) illustrated how the equivalent IG method can be applied directly to GPS slant TEC measurements. More recently this method has been expanded by using several data sources and/or by applying it iteratively to the IG and R indices. Migoya-Orué et al. (2015) adjusted the F2 peak parameter with ionosonde data and the topside profile with GPS data and Habarulema and Ssessanga (2016) used Global Navigation Satellite System (GNSS) data to determine equivalent indices for both IG12 as well as R12 in an iterative process. The equivalent index technique has been successfully applied not only to IRI but also to other models. Nava et al. (2011) obtained a significant improvement of the performance of the NeQuick model by adjusting the F10.7 variation of the model with GPS TEC maps in a similar fashion as Komjathy et al. (1998) did for the IG12 variation in IRI. The results show that this is a very promising direction and future improvements are expected for IRI with the fine-tuning of these methods.
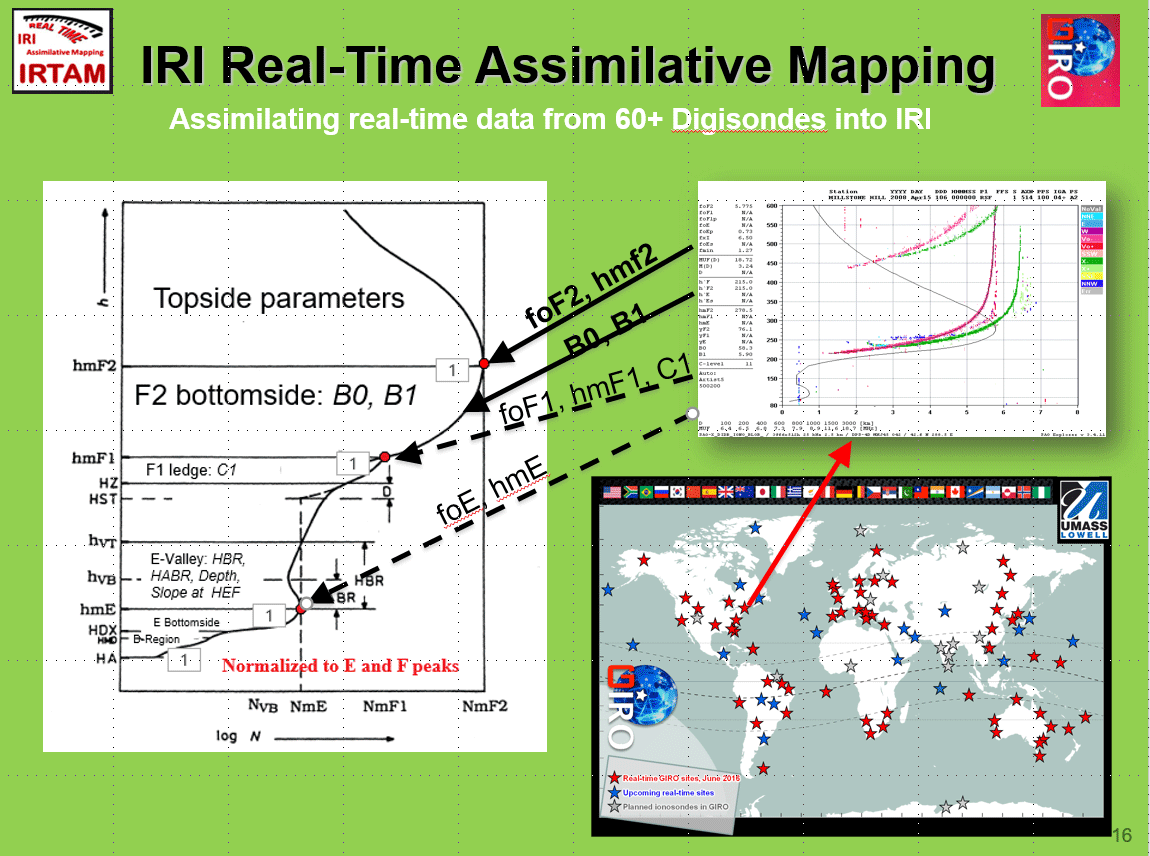
Figure 6Illustration of the data flow in the IRI Real-Time Assimilative Mapping (IRTAM) system from the Global Ionospheric Radio Observatory (GIRO) network of digisondes to the assimilation into the IRI electron density profile every 15 min (http://giro.uml.edu/RTAM, last access: 20 July 2018).
2.3 Local Updates with measured characteristic parameters
A direct update of IRI with measurements is possible if a user has data for the location in which s/he is interested in. The IRI electron density profile is normalized to the F2, F1, and E peak parameters, so updating the IRI model with the input of these parameters is straight forward and includes the peak densities NmF2, NmF1, and NmE and the peak heights hmF2 and hmE. Instead of the F2, F1, and E peak densities (NmF2, NmF1, and NmE) a user can provide the corresponding plasma frequencies (foF2, foF1, and foE) and instead of the F2 peak height hmF2 one can enter the propagation factor M(3000)F2 that is inversely correlated to hmF2. This updating method has been widely used because routine ionosonde measurements of foF2 and M(3000)F2 can with the help of IRI predict the whole electron density profile for the ionosonde location.
New with IRI-2016 a user now has the option to also enter the parameters B0 and B1, if measurements for these parameters are available. B0 determines the thickness of the IRI bottomside electron density profile and B1 the shape of the bottomside profile. This new capability is of particular interest for Digisonde users because the Automatic Real-Time Ionogram Scaler with True height (ARTIST) ionogram autoscaling software also determines B0 and B1 from the measured ionogram. In fact, the IRI Real-Time Assimilative Mapping (IRTAM) IRTAM makes use of this new option to assimilate measured B0 and B1 values into the background IRI (see next chapter). It should be pointed out that because of the special character of these parameters and to avoid unrealistic profiles B1 is constrained to the range 0.6–6 and B1 input is only accepted in conjunction with B0 input.
2.4 Data assimilation into IRI
Data assimilation into IRI and the development of a Real-Time IRI were discussed during several dedicated IRI Task Force meetings: 2009 Air Force Academy, Colorado Springs, Colorado, USA; 2012 Institute for Atmospheric Physics, Prague, Czech Republic; 2014 University of Massachusetts, Lowell, USA. A wide range of data assimilation techniques have been applied to IRI with many different data sources both in real-time and in retrospective mode. Schmidt et al. (2008) and Wenjing et al. (2015) represent the difference between GPS data and IRI with a multidimensional expansion in B-spline functions and have applied their technique successfully with GPS data from the South-American sector. Other examples are the GPS Ionospheric Inversion (GPSII) model of Fridman et al. (2006) using a Tikhonov methodology and the Electron Density Assimilative Model (EDAM) approach of Angling et al. (2009) based on a weighted, damped least mean squares estimation with IRI and GPS data. One of the most extensive efforts was undertaken by Yue et al. (2012) using a Kalman filter technique to assimilate GPS data, radio occultation data (CHAMP, GRACE, COSMIC, SAC-C, Metop-A, and TerraSAR-X), and Jason-1 and 2 altimeter TEC measurements into IRI. They did this for the time period 2002–2011 thus creating a valuable data source for space weather studies. Great progress towards a Real-Time IRI was achieved by Galkin et al. (2012) with the IRI Real-Time Assimilative Mapping (IRTAM, http://giro.uml.edu/RTAM, last access: 20 July 2018). IRTAM is based on foF2 measurements from the worldwide network of Digisonde stations (the Global Ionospheric Radio Observatory – GIRO) and uses the CCIR (1967) model functions to represent the difference between data and model. A neural network interpolator is used for regions not covered by the GIRO network and IRTAM model coefficients for foF2 are generated every 15 min. The IRTAM data flow is illustrated in Fig. 6. The IRTAM project has made good progress and the foF2 modelling approach is now also applied to the F2 peak height hmF2 and the bottomside profile parameters B0 and B1, parameters that are routinely measured by the GIRO Digisondes. For these parameters the first step was the development of a CCIR-type model because CCIR (1967) only provides foF2. For hmF2 this work had been done already by Brunini et al. (2013). Another recent improvement is the inclusion of a linear trend term so the model parameter does not have to return to the same value after 24 h.
The latest version of IRI now also includes the necessary subroutines and changes to the computer code to facilitate the use of the IRTAM coefficients in the standard IRI code.
IRI is recognized and recommended as the standard for the ionosphere by almost all of the international bodies that in one way or other deal with the ionosphere. COSPAR and URSI, the two international unions that had initiated the IRI project, have both recognized IRI as the international standard for the ionosphere and recommended its usage to its member states. The European Cooperation for Space Standardization (ECSS) has elected IRI as its model of choice for the ionosphere. But the most important endorsement came with the election of IRI to become the ISO standard for the ionosphere in April 2014 (ISO 16457, 2014). ISO is the International Standardization Organization and ISO standards undergo a long vetting process whereby each country asks its ionospheric experts to review the standard proposal and to comment regarding the adoptions of the proposed standard. Final voting by country then decides about the acceptance or rejection of a standard.
IRI did very well in model assessment studies performed by independent/impartial assessors. Shim et al. (2011, 2012) undertook such an independent assessment of different models in the framework of the CEDAR Electrodynamics Thermosphere Ionosphere (ETI) Challenge for systematic assessment of ionosphere/thermosphere models; the Coupling, Energetics, and Dynamics of Atmospheric Regions (CEDAR) Program is sponsored by the National Science Foundation (NSF). Of the 8 models included in the study, IRI was the only empirical model. The others were theoretical models and two of them involved assimilation of event data. The data included NmF2 and hmF2 from ionosondes and COSMIC radio occultation and electron density along the CHAMP orbit. The assessment was done for 9 event periods: 2 strong, 4 moderate storm events, and 3 quiet periods. Metrics used included RMS, and the model-data ratio of maximum and minimum values and maximum-minimum range. IRI was the clear overall winner. It was, if not first than second or third for almost all events and metrics parameters. Shim et al. (2017) continued their model assessment effort with the study “CEDAR-GEM Challenge for Systematic Assessment of Ionosphere/Thermosphere Models in Predicting TEC during the 2006 December Storm Event”. The event was the storm on 14–15 December 2006 (AGU storm event) and the data used in this case were GPS total electron content (TEC) measurements in eight selected longitude sectors. The result show IRI on par with the best theoretical models.
IRI is highly cited in a wide range of scientific journals. Since 1990 the most important IRI papers have been cited 4236 times in 25 different journals including Advances in Space Research, Journal of Asian Earth Science, Advances in Radio Science, Journal of Atmospheric and Solar-Terrestrial Physics, Annales Geophysicae, Applied Optics, Journal of Geodesy, Astrophysics and Space Science, Journal of Geophysical Research, Chinese Journal of Aeronautica, Journal Space Weather & Space Climate, Computer Physics Communications, Planetary and Space Science, Computers & Geosciences, Plasma Science and Technology, Cosmic Research, Radio Science, Geochimica et Cosmochimica Acta, Solar Physics, Geodesy and Geodynamics, Space Science Review, Geophysical Research Letters, Space Weather, GPS Solutions, and Surveys in Geophysics.
Table 2Percentage of papers per year that acknowledge usage of the IRI model in the AGU journals Journal of Geophysical Research (JGR), Geophysical Research Letters (GRL), Space Weather (SW), and Radio Science (RS) for the years 2009 to 2017.
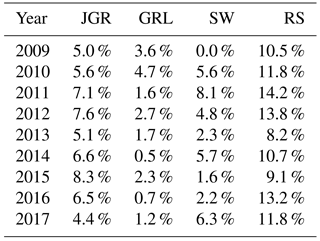
Table 2 shows the statistics regarding the usage of IRI in papers published in the most prominent science journals covering ionospheric physics including the Journal of Geophysical Research (JGR), the Geophysical Research Letter, the Space Weather journal, and the journal Radio Science (RS). We first search for citations of IRI papers and then determine if IRI actually contributed to the paper or was just referenced. Please note that this extends and corrects a similar table shown as Table 1 in Bilitza et al. (2017). The numbers speak for themselves, per year IRI contributes to 5 %–8 % of JGR papers and even more impressive to 10 %–14 % of RS papers made use of IRI for their study. Figure 7, finally, displays the monthly accesses to the IRIweb online system for calculating IRI parameters. Accesses reached the 1 000 000 mark in 2014 and have continued to increase since then.
The International Reference Ionosphere (IRI) is the international standard for Earth's ionosphere and is recognized as such by COSPAR and URSI and most importantly by the organization in charge of international standards the International Standardization Organization (ISO). In April 2014 IRI was elected to become the ISO standard 16457 by unanimous vote by the ISO member states. This article focusses on the external drivers of the IRI model and discusses some of the changes introduced with IRI-2016. Besides the traditional solar, magnetic, and ionospheric indices, IRI can be also driven by characteristic profile parameters either by direct input if data are available locally or by model adjustment and data assimilation for regional or global modelling. Significant progress has been achieved in the area of data assimilation. Yue et al. (2012) have produced a valuable data set for the years 2002–2011 by assimilating a large amount of GNSS and altimeter data into IRI. Galkin et al. (2012) continue to improve their IRI Real-Time Assimilative Mapping (IRTAM) now including the parameters foF2, hmF2, B0, and B1.
IRI has been widely used as documented by the large number of citations (4236) since 1990 in a wide range of journals (25) and the significant percentage of papers each year in the Journal of Geophysical Research (5 %–8 %) and Radio Science (10 %–14 %) that have used the IRI model in their scientific studies. Usage of the online IRI interface has now reached the level of 8 000 000 accesses per month.
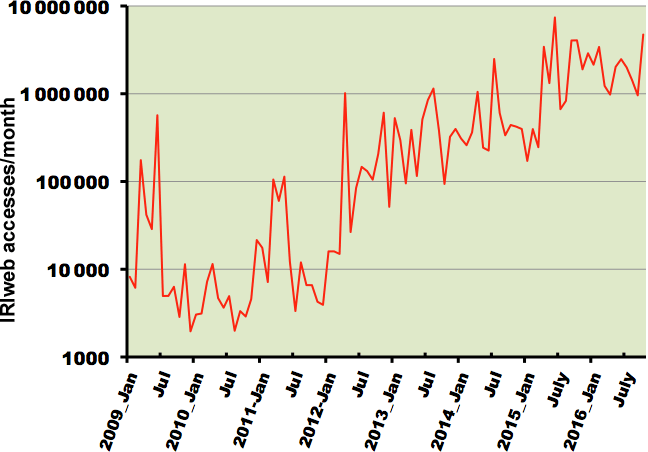
Figure 7Accesses per month to the IRIweb online system (https://ccmc.gsfc.nasa.gov/modelweb/models/iri2016_vitmo.php, last access: 10 June 2018) for computing IRI parameters from January 2009 to January 2018. Accesses to the copy of the interface at the Coordinated Community Modelling Center (CCMC; https://ccmc.gsfc.nasa.gov/, last access: 20 July 2018) are included in this statistics.
Future improvements of the IRI model are expected in a number of areas. Several new models are already scheduled for inclusion in the next release of the IRI model. This includes a description of storm effects on hmF2 (Blanch and Altadill, 2012), a scintillation occurrence probability model (Chen et al., 2017). Other efforts are close to completion including an updated model for the D-region electron density based on a simple ion-chemical model that is corrected with rocket radio propagation data (Martin Friedrich, Graz University of Technology, Austria) and the Vary-Chap formalism for the representation of the topside electron density profile using Alouette and ISIS topside sounder data and the TOPIST software (Bodo Reinisch, Ivan Galkin, and Osman Mohamed, University of Massachusetts Lowell, Lowell, USA). Of special importance is a better description of IRI densities and temperatures at very low solar activities in view of the discrepancies found during the last unusually low and extended solar minimum (2007–2009) and because the current solar cycle may reach again very low solar activities. The topside electron density, in particular, has been shown to be overestimated by IRI in comparisons with C/NOFS, CHAMP, and GRACE satellite measurements (Lühr and Xiong, 2010; Bilitza et al., 2012). An effort to correct this problem is nearing completion using also Swarm in situ measurements and Alouette and ISIS topside sounder data (Dieter Bilitza with Chao Xiong, Geo Research Centre, GFZ, Potsdam, Germany). Intense efforts are underway to enable the use of GNSS data in the Real-Time IRI (Ivan Galkin, University Massachusetts Lowell, Lowell, USA and Andrzej Krankowski, University of Warmia and Mazury, Olsztyn, Poland). As pointed out in this article the use of monthly hemispheric ionospheric indices may lead to a significant performance increase for foF2 model predictions. This will require setting up a routine computation of these indices. A model for the occurrence probability of sporadic E based on COSMIC radio occultation data is in the very early stages of development (Dieter Bilitza with Christina Arras, Geo Research Centre, GFZ, Potsdam, Germany). These are just a few examples of studies that are ongoing with the goal of making the IRI model an even better standard for the Earth's ionosphere.
The DMSP data were obtained from http://cindispace.utdallas.edu/DMSP/ (last access: 15 July 2015) and the Millstone Hill data from the Mardigal archive at http://madrigal.haystack.mit.edu/madrigal/ (last access: 25 July 2018). The F10.7 indices are available at https://omniweb.gsfc.nasa.gov/form/dx1.html (last access: 25 July 2018).
The author declares that there is no conflict of interest.
This article is part of the special issue “Kleinheubacher Berichte 2017”. It is a result of the Kleinheubacher Tagung 2017, Miltenberg, Germany, 25–27 September 2017.
As the recipient of the International Union of Radio Science (URSI) Rawer Gold Medal 2017,
the author thankfully acknowledges the support and recognition by the German National
URSI Committee. This paper is a shortened version of the Rawer Gold Medal lecture
given at the Kleinheubach Tagung 2017. The success of the IRI model is the result
of collaborations with the team of international experts that constitutes the IRI Working Group.
Their efforts are greatly appreciated and have helped to make IRI the international
standard for Earth's ionosphere.
Edited by: Ralph Latteck
Reviewed by: two anonymous referees
Abdu, M., Souza, J., Batista, I., and Sobral, J.: Equatorial spread F statistics and empirical representation for IRI: a regional model for the Brazilian longitude sector, Adv. Space Res., 31, 703–716, https://doi.org/10.1016/S0273-1177(03)00031-0, 2003.
Altadill, D., Torta, J. M., and Blanch, E.: Proposal of new models of the bottom-side B0 and B1 parameters for IRI, Adv. Space Res., 43, 1825–1834, https://doi.org/10.1016/j.asr.2008.08.0144, 2009.
Altadill, D., Magdaleno, S., Torta, J. M., and Blanch, E.: Global empirical models of the density peak height and of the equivalent scale height for quiet conditions, Adv. Space Res., 52, 1756–1769, https://doi.org/10.1016/j.asr.2012.11.018, 2013.
Angling, M. J., Shaw, J., Shukla, A. K., and Cannon, P. S.: Development of an HF selection tool based on the Electron Density Assimilative Model near-real-time ionosphere, Radio Sci., 44, RS0A13, https://doi.org/10.1029/2008RS004022, 2009.
Bilitza, D.: Electron density in the D-region as given by the International Reference Ionosphere: World Data Center A for Solar-Terrestrial Physics, Report UAG-82, 7–11, 1981.
Bilitza, D.: Electron density in the equatorial topside, Adv. Space Res., 5, 15–19, https://doi.org/10.1016/0273-1177(85)90174-7, 1985.
Bilitza, D.: International Reference Ionosphere: Recent Developments, Radio Sci., 21, 343–346, https://doi.org/10.1029/RS021i003p00343, 1986.
Bilitza, D.: International Reference Ionosphere 1990, National Space Science Data Center, Report 90-22, Greenbelt, Maryland, USA, 1990.
Bilitza, D.: International Reference ionosphere – Status 1995/96, Adv. Space Res., 20, 1751–1754, 1997.
Bilitza, D.: International Reference Ionosphere 2000, Radio Sci., 36, 261–275, https://doi.org/10.1029/2000RS002432, 2001.
Bilitza, D. and Reinisch, B. W.: International Reference Ionosphere 2007: Improvements and new parameters, Adv. Space Res., 42, 599–609, https://doi.org/10.1016/j.asr.2007.07.048, 2008.
Bilitza, D., Sheik, N., and Eyfrig, R.: A global model for the height of the F2-peak using M3000 values from the CCIR numerical map, Telecomm. J., 46, 549–553, 1979.
Bilitza, D., Bhardwaj, S., and Koblinsky, C.: Improved IRI predictions for the GEOSAT time period, Adv. Space. Res., 20, 1755–1760, https://doi.org/10.1016/S0273-1177(97)00585-1, 1997.
Bilitza, D., Radicella, S., Reinisch, B., Adeniyi, J., Mosert, M., Zhang, S., and Obrou, O.: New B0 and B1 models for IRI, Adv. Space. Res. 25, 89–95, https://doi.org/10.1016/S0273-1177(99)00902-3, 2000.
Bilitza, D., Brown, S. A., Wang, M. Y., Souza, J. R., and Roddy, P. A.: Measurements and IRI Model Predictions during the Recent Solar Minimum, J. Atmos. Sol.-Terr. Phy., 86, 99–106, https://doi.org/10.1016/j.jastp.2012.06.010, 2012
Bilitza, D., Altadill, D., Zhang, Y., Mertens, C., Truhlik, V., Richards, P., McKinnell, L.-A., and Reinisch, B.: The International Reference Ionosphere 2012 – a model of international collaboration, J. Space Weather Space Climate, 4, 1–12, https://doi.org/10.1051/swsc/2014004, 2014.
Bilitza, D., Altadill, D., Truhlik, V., Shubin, V., Galkin, I., Reinisch, B., and Huang, X.: International Reference Ionosphere 2016: From ionospheric climate to real-time weather predictions, Space Weather, 15, 418–429, https://doi.org/10.1002/2016SW001593, 2017.
Blanch, E. and Altadill, D.: Midlatitude F region peak height changes in response to interplanetary magnetic field conditions and modelling results, J. Geophys. Res., 117, A12311, https://doi.org/10.1029/2012JA018009, 2012.
Brown, S., Bilitza, D., and Yiğit, E.: Ionosonde-Based Indices for Improved Representation of Solar Cycle Variation in the International Reference Ionosphere Model, J. Atmos. Sol.-Terr. Phy., 171, 137–146, https://doi.org/10.1016/j.jastp.2017.08.022, 2018.
Brunini, C., Conte, J. F., Azpilicueta, F., and Bilitza, D.: A different method to determine the height of the F2 peak, Adv. Space Res., 51, 2322–2332, https://doi.org/10.1016/j.asr.2013.01.027, 2013.
CCIR (Consultative Committee on International Radio): Atlas of Ionospheric Characteristics, Report 340, International telecommunication Union, Geneva, Switzerland, 1967.
Chen, S.-P., Bilitza, D., Liu, J.-Y., Caton, R., Chang L. C. W., and Yeh, W.-H.: An Empirical Model of L-band Scintillation S4 index Constructed by Using FORMOSAT-3/COSMIC Data, Adv. Space Res., 60, 1015–1028, https://doi.org/10.1016/j.asr.2017.05.031, 2017.
Clette, F., Svalgaard, L., Vaquero, J. M., and Cliver, E. W.: Revisiting the sunspot number- A 400-year perspective on the solar cycle, Space Sci. Rev., 186, 35–103, https://doi.org/10.1007/s11214-014-0074-2, 2014.
Danilov, A. and Yaichnikov, A.: A new model of the ion composition at 75 km to 1000 km for IRI, Adv. Space Res., 5, 75–79, https://doi.org/10.1016/0273-1177(85)90360-6, 1985.
Danilov, A. and Smirnova, N.: Improving the 75 km to 300 km ion composition model of the IRI, Adv. Space Res., 15, 171–177, https://doi.org/10.1016/S0273-1177(99)80044-1, 1995.
Danilov, A., Rodevich, A., and Smirnova, N.: Problems with incorporating a new D-region model into the IRI, Adv. Space Res., 15, 165–169, https://doi.org/10.1016/S0273-1177(99)80042-8, 1995.
Ducharme, E. D., Petrie, L. E., and Eyfrig, R.: A method for predicting the Fllayer critical frequency based on Zurich smoothed sunspot number, Radio Sci., 8, 837–839, https://doi.org/10.1029/RS008i010p00837, 1973.
Fridman, S. V., Nickisch, L. J., Aiello, M., and Hausman, M.: Real-time reconstruction of the three dimensional ionosphere using data from a network of GPS receivers, Radio Sci., 41, RS5S12, https://doi.org/10.1029/2005RS003341, 2006.
Friedrich, M. and Torkar, K.: FIRI: a semiempirical model of the lower ionosphere, J. Geophys. Res., 106, 21409–21418, https://doi.org/10.1029/2001JA900070, 2001.
Fuller-Rowell, T. J., Araujo-Pradere, E., and Codrescu, M. V.: An empirical ionospheric storm-time correction model, Adv. Space Res., 25, 139–146, https://doi.org/10.1016/S0273-1177(99)00911-4, 2000.
Galkin, I. A., Reinisch, B. W., Huang, X., and Bilitza, D.: Assimilation of GIRO data into a real-time IRI, Radio Sci., 47, RS0L07, https://doi.org/10.1029/2011RS004952, 2012.
Gulyaeva, T. L.: Modification of solar activity indices in the International Reference Ionosphere IRI and IRI-Plas models due to recent revision of sunspot number time series, Solar-Terr. Phys., 2, 59–66, https://doi.org/10.12737/20872, 2014.
Habarulema, J. B. and Ssessanga, N.: Adapting a climatology model to improve estimation of ionosphere parameters and subsequent validation with radio occultation and ionosonde data, Space Weather, 15, 84–98, https://doi.org/10.1002/2016SW001549, 2016.
Hernandez-Pajares, M., Juan, J., Sanz, J., and Bilitza, D.: Combining GPS measurements and IRI model values for Space Weather specification, Adv. Space Res., 29, 949–958, https://doi.org/10.1016/S0273-1177(02)00051-0, 2002.
ISO 26457: Space systems – Space Environment (natural and artificial) – The Earth's ionosphere model: international reference ionosphere (IRI) model and extension to the plasmasphere, http://www.iso.org/iso/home/store/catalogue_tc/catalogue_detail.htm?csnumber=61556, last access: 20 July 2018, International Standardization Organization, 2014.
Jones, W. B. and Gallet, R. M.: The representation of diurnal and geographic variations of ionospheric data by numerical methods, Telecomm. J., 32, 18–28, 1965.
Komjathy A., Langley, R., and Bilitza, D.: Ingesting GPS-Derived TEC Data into the International Reference Ionosphere for single Frequency Radar Altimeter Ionospheric Delay Corrections, Adv. Space Res., 22, 793–802, https://doi.org/10.1016/S0273-1177(98)00100-8, 1998.
Kouris, S. S. and Muggleton, L. M.: Diurnal variation in the E-layer ionization, J. Atmos. Terr. Phys., 35, 133–139, https://doi.org/10.1016/0021-9169(73)90221-3, 1973.
Liu, R., Smith, P., and King, J.: A new solar index which leads to improved foF2 predictions using the CCIR atlas, Telecomm. J., 50, 408–414, 1983.
Lühr, H. and Xiong, C.: The IRI2007 model overestimates electron density during the 23/24 solar minimum, Geophys. Res. Lett., 37, L23101, https://doi.org/10.1029/2010GL045430, 2010.
Nava, B., Coïsson, P., and Radicella, S. M.: A new version of the NeQuick ionosphere electron density model, J. Atmos. Sol.-Terr. Phy., 70, 1856–1862, https://doi.org/10.1016/j.jastp.2008.01.015, 2008.
Nava, B., Radicella, S. M., and Azpilicueta, F.: Data ingestion into NeQuick 2, Radio Sci., 46, RS0D17, https://doi.org/10.1029/2010RS004635, 2011.
Mertens, C. J., Xiaojing Xu, Bilitza, D., Mlynczak, M. G., and Russell III, J. M.: Empirical STORM-E Model: I. Theoretical and Observational Basis, Adv. Space Res., 51, 554–574, https://doi.org/10.1016/j.asr.2012.09.009, 2013a.
Mertens, C. J., Xiaojing Xu, Bilitza, D., Mlynczak, M. G., and Russell III, J. M.: Empirical STORM-E Model: II. Geomagnetic Corrections to Nighttime Ionospheric E-Region Electron Densities, Adv. Space Res., 51, 575–598, https://doi.org/10.1016/j.asr.2012.09.014, 2013b.
Migoya-Orué, Y., Nava, B., Radicella, S., and Alazo-Cuartas, K.: GNSS derived TEC data ingestion into IRI 2012, Adv. Space Res., 55, 1994–2002, https://doi.org/10.1016/j.asr.2014.12.033, 2015.
Picone, J. M., Hedin, A. E., Drob, D. P., and Aikin, A. C.: NRLMSISE-00 empirical model of the atmosphere: statistical comparisons and scientific issues, J. Geophys. Res., 107, 1468, https://doi.org/10.1029/2002JA009430, 2002.
Rawer, K., Ramakrishnan, S., and Bilitza, D.: Preliminary reference profiles for electron and ion densities and temperatures proposed for the International Reference Ionosphere, Institut für physikalische Weltraumforschung, Scientific Report W.B. 2, Freiburg, Germany, 1975.
Rawer, K., Bilitza, D., and Ramakrishnan, S.: International Reference Ionosphere 1978, International Union of Radio Science (URSI), Brussels, Belgium, 1978a.
Rawer, K., Bilitza, D., and Ramakrishnan, S.: Goals and status of the International Reference Ionosphere, Rev. Geophys., 16, 177–181, 1978b.
Rawer, K., Lincoln, V., and Conkright, R. (Eds.): International Reference Ionosphere – IRI 79, World Data Center A for Solar-Terrestrial Physics, Report UAG-82, Boulder, Colorado, USA, 1981.
Richards, P. G., Bilitza, D., and Voglozin, D.: Ion density calculator (IDC): A new efficient model of ionospheric ion densities, Radio Sci., 45, RS5007, https://doi.org/10.1029/2009RS004332, 2010.
Rush C., Fox, M., Bilitza, D., Davies, K., McNamara, L., Stewart, F., and PoKempner, M.: Ionospheric mapping – an update of foF2 coefficients, Telecomm. J., 56, 179–182, 1989.
Scherliess, L. and Fejer, B.: Radar and satellite global equatorial Fl region vertical drift model, J. Geophys. Res., 104, 6829–6842, 1999.
Schmidt, M., Bilitza, D., Shum, C. K., and Zeilhofer, C.: Regional 4-D modeling of the ionospheric electron density, Adv. Space Res., 42, 782–790, https://doi.org/10.1016/j.asr.2007.02.050, 2008.
Scotto, C., Mosert de Gonzalez, M., Radicella, S., and Zolesi, B.: On the prediction of the F1-ledge occurrence and critical frequency, Adv. Space Res., 20, 1773–1776, https://doi.org/10.1016/S0273-1177(97)00589-9, 1997.
Shim, J. S., Kuznetsova, M., Rastätter, L., Hesse, M., Bilitza, D., Codrescu, M., Emery, B., Foster, B., FullerRowell, T., Huba, J., Mannucci, A. J., Ridley, A., Scherliess, L., Schunk, R. W., Stephens, P., Thompson, D. C., Zhu, L., Anderson, D., Chau, J. L., Sojka, J. J., and Rideout, B.: CEDAR Electrodynamics Thermosphere Ionosphere 1 (ETI) Challenge for Systematic Assessment of Ionosphere/Thermosphere Models 1: NmF2, hmF2, and Vertical Drift Using Ground Based Observations, Space Weather, 9, S12003, https://doi.org/10.1029/2011SW000727, 2011.
Shim J. S., Kuznetsova, M., Rastätter, L., Hesse, M., Bilitza, D., Butala, M., Codrescu, M., Emery, B. A., Foster, B., Fuller-Rowell, T. J., Huba, J., Mannucci, A. J., Pi, X., Ridley, A., Scherliess, L., Schunk, R. W., Sojka, J. J., Stephens, P., Thompson, D. C., Weimer, D., Zhu, L., and Sutton, E.: CEDAR Electrodynamics Thermosphere Ionosphere (ETI) Challenge for systematic assessment of ionosphere/thermosphere models: Electron density, neutral density, NmF2, and hmF2 using space based observations, Space Weather, 10, S10004, https://doi.org/10.1029/2012SW000851, 2012.
Shim, J. S., Rastätter, L., Kuznetsova, M., Bilitza, D., Codrescu, M., Coster, A. J., Emery, B. A., Fedrizzi, M., Förster, M., Fuller-Rowell, T. J., Gardner, L. C., Goncharenko, L., Huba, J., McDonald, S. E., Mannucci, A. J., Namgaladze, A. A., Pi, X., Prokhorov, B. E., Ridley, A. J., Scherliess, L., Schunk, R. W., Sojka, J. J., and Zhu, L.: CEDAR-GEM challenge for systematic assessment of Ionosphere/thermosphere models in predicting TEC during the 2006 December storm event, Space Weather, 15, 1238–1256, https://doi.org/10.1002/2017SW001649, 2017.
Shubin V. N.: Global median model of the F2-layer peak height based on ionospheric radio-occultation and ground-based digisonde observations, Adv. Space Res., 56, 916–928, https://doi.org/10.1016/j.asr.2015.05.029, 2015.
Shubin, V. N., Karpachev, A. T., and Tsybulya, K. G.: Global model of the F2 layer peak height for low solar activity based on GPS radio-occultation data, J. Atmos. Sol.-Terr. Phy., 104, 106–115, https://doi.org/10.1016/j.jastp.2013.08.024, 2013.
Themens, D. R. and Jayachandran, P. T.: Solar activity variability in the IRI at high latitudes: Comparisons with GPS total electron content, J. Geophys. Res.-Space, 121, 3793–3807, https://doi.org/10.1002/2016JA022664, 2016.
Triskova, L., Truhlik, V., and Smilauer, J.: An empirical model of ion composition in the outer ionosphere, Adv. Space Res., 31, 653–663, https://doi.org/10.1016/S0273-1177(03)00040-1, 2003.
Truhlik, V., Bilitza, D., and Triskova, L.: A new global empirical model of the electron temperature with inclusion of the solar activity variations for IRI, Earth Planets and Space, 64, 531–543, https://doi.org/10.5047/eps.2011.10.016, 2012.
Wenjing, L., Limberger, M., Schmidt, M., Dettmering, D., Hugentobler, U., Bilitza, D., Jakowski, N., Hoque, M. M., Wilken, V., and Gerzen, T.: Regional modeling of ionospheric peak parameters using GNSS data: an update for IRI, Adv. Space Res., 55, 1981–1993, https://doi.org/10.1016/j.asr.2014.12.006, 2015.
Xinan, Y., Schreiner, W. S., Kuo, Y.-H., Hunt, D. C., Wang, W., Solomon, S. C., Burns, A. G., Bilitza, D., Liu, J.-Y., Wan, W., and Wickert, J.: Global 3-D ionospheric electron density reanalysis based on multi-source data assimilation, J. Geophys. Res., 117, A09325, https://doi.org/10.1029/2012JA017968, 2012.
Zhang, Y.-L., Paxton, L. J., and Bilitza, D.: Near real-time assimilation of auroral peak E-region density and equatorward boundary in IRI, Adv. Space Res., 8, 1055–1063, https://doi.org/10.1016/j.asr.2010.06.029, 2010.