 | 10 Dec 2020
Towards 3D Simulation for Disaster Intervention Robot Behaviour Assessment
Matteo Bertolino
Tullio J. Tanzi
When a disaster strikes, response teams can nowadays rely on recent advances in technology. This approach improves the definition of a disaster management strategy. The use of autonomous systems during rescue operations allows, for example, to reach places that may be inaccessible or dangerous to human rescuers. In this context, both the design and the configuration of an autonomous system, including its embedded instruments (e.g. sensors), play a very important role in the overall outcome of the rescue mission. An incorrect configuration can lead to the acquisition of inaccurate or erroneous data and may result in incorrect information provided to rescuers. How can we ensure that the configuration of the autonomous systems is correct for a target mission? We propose to validate this configuration by testing the behaviour of the autonomous systems and their equipment in a virtual environment. To do this, system, sensors, space environment (geometry, etc.), prevailing conditions at the intervention site (weather, etc.) and mission scenario must be modelled in a 3D simulation system. The results of these simulations allow to apply in real time the modifications required to better adapt the configuration to the objectives of the mission. These simulations must be performed prior to the deployment of rescue teams to speed the development of a rescue management strategy. In this contribution, we propose a protocol to enhance an existing simulation environment to make it adapt to support disaster management. Then, we validate it through a case study in which we show the approach to correctly configure a LIDAR for a realistic mission. Such simulations allowed us to quantitatively configure the parameters of the LIDAR mounted on an existing disaster management rover, in order to keep the energy consumption limited while guaranteeing a correct functioning of the system. Resuming, the expected results are: (i) the assessment of the suitability of system for the mission, (ii) the choice of the quantitative features which characterize such equipment, (iii) the expectation of mission success and (iv) the probability which the system survives and completes the mission.
- Article
(1649 KB) - Full-text XML
- BibTeX
- EndNote


The context of this work is a disaster environment. A disaster environment is chaotic, dangerous and it is necessary to act rapidly in order to increase the chances of survival. In this regard, relying on Autonomous Systems (A.S.) brings benefits. However, mission-specific configuration is an essential condition for effective response. By configuration we mean the architectural choices such as the most appropriate set of sensors to be mounted on the A.S. as well as their positioning and balancing. It is necessary to assess their impact with respect to the external environment. For example, there could be limitations in their usage (e.g., LIDAR could suffer by perturbation given by light-sources in a certain time range or in a certain position). Wrong architectural choices make the A.S. not only useless, but also potentially harmful and error-prone for rescuers. The rest of this section shows the context of the work, the use of A.S. and the purpose of our approach to simulation. Section 2 describes the simulation system used. Section 3 is devoted to modelling. Section 4 shows an illustration about the correct configuration of a LIDAR sensor with regard to realistic mission requirements. Finally, future work and conclusions are illustrated in Sect. 5.
1.1 Disaster Management
Disaster recovery management strategy can now be enhanced thanks to recent progress in modern technology. More precisely, these techniques shall help in settling plans, processes and techniques in order to save life, find survivors or restore life conditions as they were before the disaster (Mukhopadhay and Bhattacherjee, 2015). After a disaster, the impacted area could have suffered from huge mutations (e.g., ground alterations, presence of rubbles). Disaster environments are chaotic and dangerous, not only for victims but also for rescuers. Some information can obviously be obtained only after in-site reconnaissance, but this is not always easy to perform. Communications with the local inhabitants may be hindered by physical constraints or by people abandonment of the hit zone. Even a local inspection actually has strong limitations. For example, the poor visibility range can result in erroneous decisions based on incomplete or erroneous data. However, the completeness and the correctness of this information are necessary for the decision-making process required by emergency intervention (Tanzi and Isnard, 2019). Depending on the circumstances of each event, it is important to quickly select the suitable means to respond to the emergency.
1.2 Usage of Autonomous Systems
In this regard, the usage of Autonomous Systems (A.S.), such as Rovers or Drones, can assist the recovering operations for many tasks. For instance, A.S. can be used for Rapid-Mapping or to scan the affected area to find survivors, among others. The need for measurement systems operating in total autonomy has existed for a long time, but accurate enough measurement technologies were not yet available. In the past, acquired data were not frequently updated, probably because previous technologies were only producing environment snapshot rather than a permanent monitoring. Nowadays, wired and mobile communication networks allow us to easily gather distributed measurements as well as acquisition systems dedicated to data collection in real-time (Stormont and Allan, 2009; Tanzi and Isnard, 2015). However, these systems require the deployment of a fixed infrastructure that must be well-maintained so that they can operate. The advent of autonomous vehicles incorporating modern technology sensors (LIDAR, Radar, Ground Penetration Radar, Camera, etc.) (Tanzi and Chandra, 2017; Chandra and Tanzi, 2016) offers new opportunities in this field. These facilities provide more sophisticated ways to acquire information of heterogeneous types and to explore a given environment. This approach allows operations to overcome the constraints given by the existence of a fixed infrastructure. Moreover, it tolerates communication difficulties (Tanzi et al., 2015), e.g. in case an existing infrastructure is down or destroyed because of accidents or disasters.
In order to integrate the capabilities of modern sensors, it is necessary to define new approaches. Capturing information helps to (i) understand and thus model the environment (in real-time) for a successful accomplishment of the mission, (ii) reusing the same information for settling decision-making processes for intervention teams (Apvrille et al., 2017; Tanzi et al., 2016). Data are produced by a set of heterogeneous sensors deployed for real-time collection: distance values are computed through ultrasonic, micro-waves and LIDAR sensors, location and attitude values are obtained through Inertial Measurement Units (IMUs), control data by odometers (Thrun et al., 2005), etc. The usage of Radar for Ground Penetration (GPR) enables new sensing such as detection of victims buried after an earthquake (Chandra and Tanzi, 2015; Li et.al., 2005; Chandra and Tanzi, 2018, 2017) thus increasing the probability to locate survivors. The usage of Doppler Radar sensors for the detection of survivors under debris has been widely explored in Thi Phuoc Van et al. (2019) and in Li et al. (2016). Authors propose to locate humans in a non-invasive way, detecting the breath frequency and the heartbeat. In Lee et al. (2016), authors propose an approach based on the fusion of data coming from a LIDAR and an IR camera. Authors state that their approach allows to overcome some problems such as the sensitivity due to illumination changes.
The precise definition of architecture and configuration of the A.S depends not only on sensors but also on:
-
The configuration of the devastated area,
-
The main objectives of the SaR (Search and Rescue) mission such as damage assessment, people research and location, etc.
1.3 Objective of the simulation
In this critical context, inappropriate A.S. configuration can lead to imprecise or erroneous data. Consequently, erroneous decisions could result from them. The choice of the most adapted set of sensors to be equipped for specific situations as well as their physical placement is a non-trivial task. The same for the mechanical configuration: for instance, the diameter of the wheels mounted on a Rover can be unsuitable for the roughness of a target terrain. A bad choice in this step may make the A.S. not reliable enough or useless for target missions.
In this regard, we propose a new approach, based on a 3D simulation of the real world, which speeds-up the definition of a recovery management strategy. Our research aims to set the goals immediately after a disaster arises, e.g. during the deployment of rescue teams. The goal is to acquire up-to-date information on the area and its alterations due to the event. Once rescue teams are deployed in zone, A.S. can start producing data, thus helping to define complex strategies or modifying run-time an existing plan (Tanzi and Isnard, 2019; Stormont and Allan, 2009).
In our previous work, we validated the mechanical architecture of a rover designed to locate survivors after an earthquake (Bertolino and Tanzi, 2019). In this article, we address the validation of the set of sensors mounted on an A.S. with respect to the mission. Through simulation, we can use the same approach to discover the best parametrization of the set. This allows the “ideal” instrument for the mission to be found and the most similar one among real devices to be chosen.
The schema of the selected simulation system is shown in Fig. 1. It consists in a network of computational blocks which communicate through high-level messages. Each block is responsible for a specific operation (i.e., black continuous-line shape blocks) or modelling aspect (i.e., red dashed-line shape blocks). We start from an existing simulation environment named Gazebo (Koenig and Howard, 2004). It includes a large set of physics engines (i.e., Open Dynamics Engine – ODE for dynamics simulations) (Russ, 2006) and Open Gestures Recognition Engine – OGRE to provide a realistic rendering of the scenario (Dias et al., 2004).
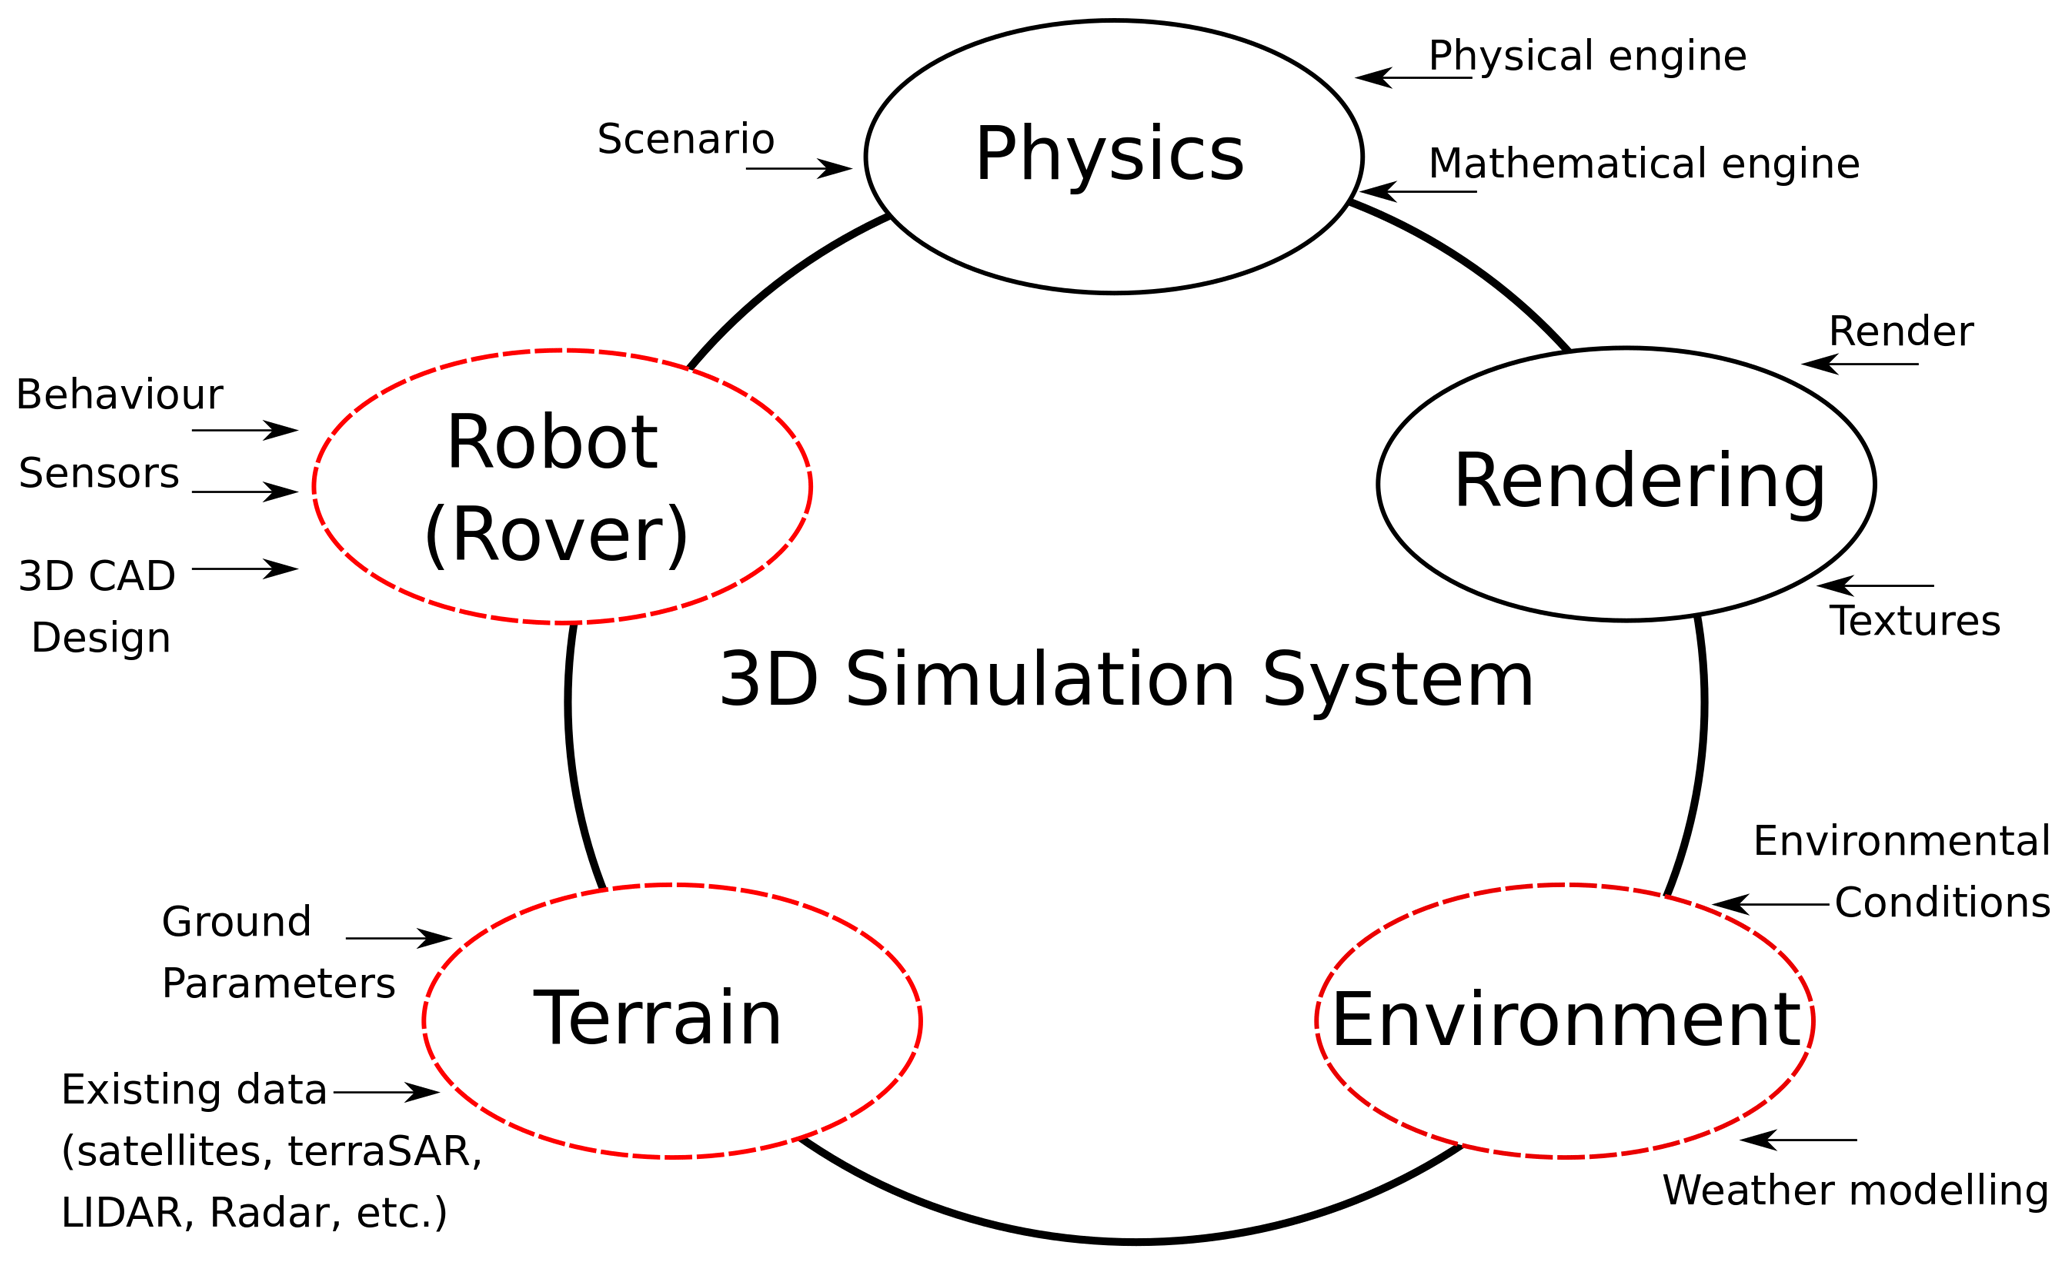
We use Gazebo-3D to the adequacy assessment of robots in realistic scenarios, because we aim to increase knowledge on the A.S expected mission. The input requirements are realistic and rigorous models of the different elements of the mission. In this regard, terrain, environmental conditions, A.S. architecture and behaviour, the set of sensors must be modelled. If we consider Fig. 1, computational blocks characterized by a continuous-line shape provide a complete support with respect to simulation for disaster management. Some integrations are required for blocks addressing modelling aspects (i.e., dashed-line shape blocks) though. These are part of our contribution and they will be listed and explained in Sect. 3. Some of them have been addressed in this paper; the rest is part of our future work.
The modelling of each element of the scenario must be expressed by specifying its physical characteristics in an accurate way. Modelling means abstraction, namely capturing the behaviour of a system only through the parameters which are relevant for a certain target (i.e., physics simulation in this contribution). As we will see, the choice of the most appropriate set of parameters differs according to the sub-system which is modelled. For instance, a precise modelling of the shape of the subsystem is more meaningful while representing mechanical items such as wheels rather than sensors. In other words, the geometrical 3D representation of a LIDAR plays a minor role rather than other parameters such as the noise while acquiring data.
3.1 Ground
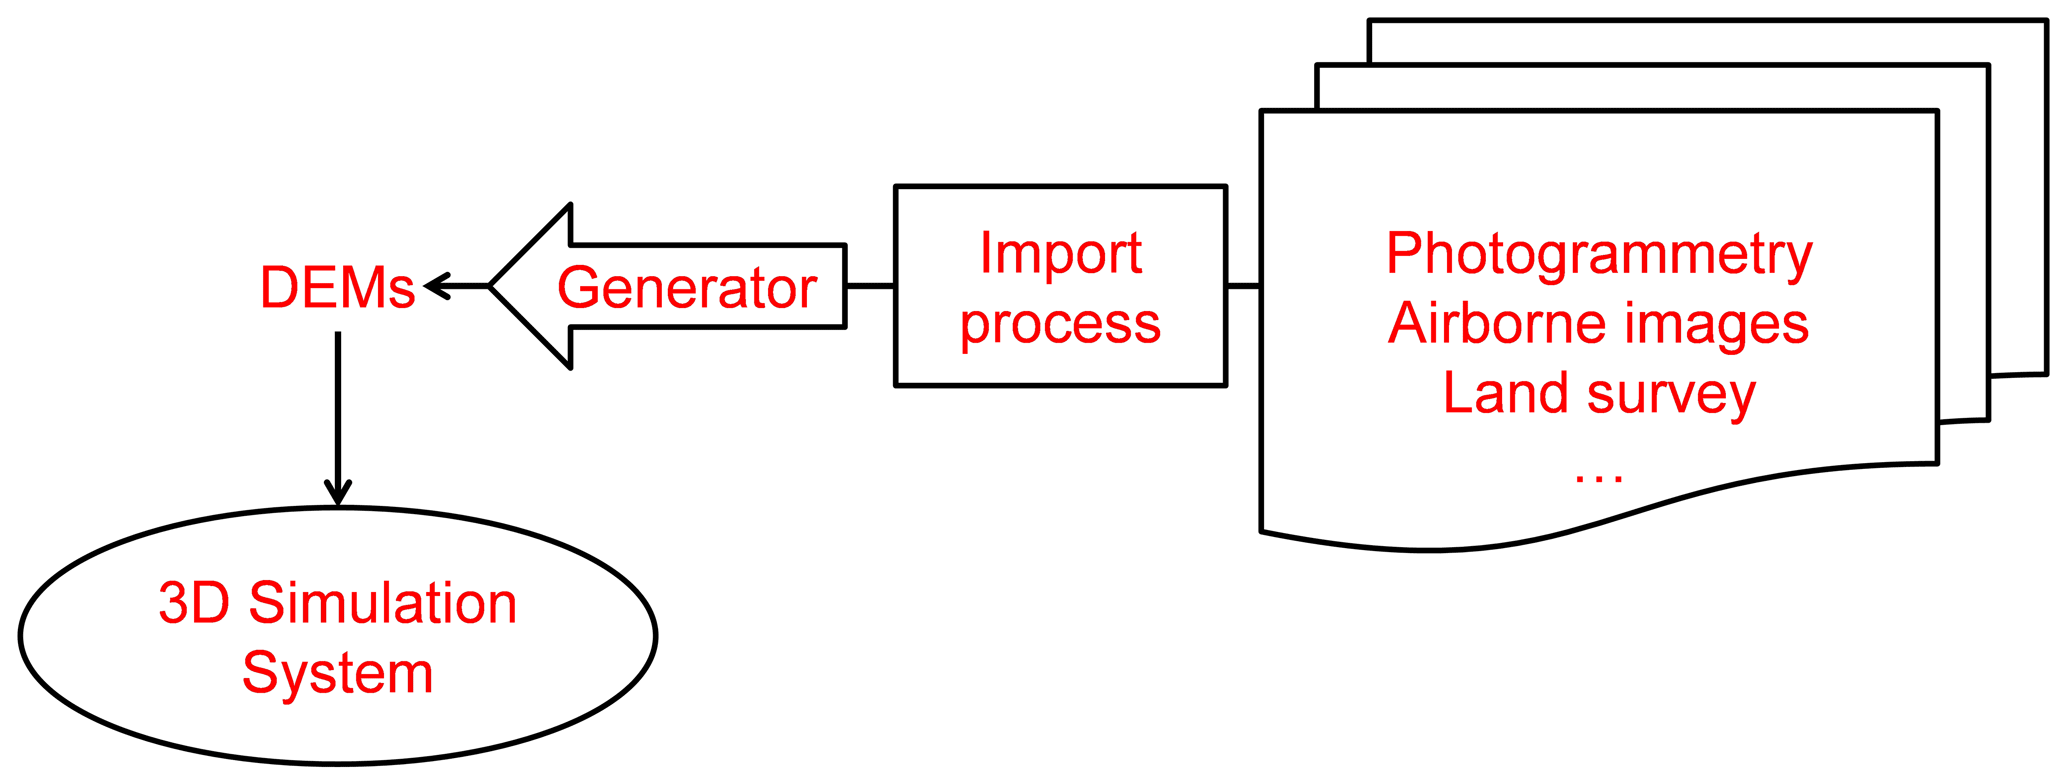
World modelling, especially ground modelling, plays a crucial role in our work. In this respect, there is a strong interest in testing the configuration of an A.S. in a simulated environment able to reproduce the behaviour of the A.S. and which corresponds to the real world as much as possible. Figure 2 provides an overview of the terrain generation process. We start from existing data sources in order to have a realistic simulation ground surface of the impacted area. They can come from satellites (e.g., optical/micro-waves, TerraSAR, photogrammetry, etc.), airborne images produced by drones, images produced by LIDAR or Radar, Geographical Information System (GIS) data and so on (Chandra and Tanzi, 2014). The input terrain is thus provided to the simulation system by processing these existing input data. Starting from pairs of remote sensing data such as satellite images, overlapping aerial photographs or UAV acquired imagery, we have used a standard GIS software (Shean et al., 2016) to generate a Digital Elevation Model (DEM), which is the real input of the simulation system, based on the principles of Photogrammetry.
This allows to perform some preliminary physical analysis (e.g., probability of a Rover to overcome all terrain depressions) but the presence of external obstacles in the terrain is a key-point in simulation for disaster management.
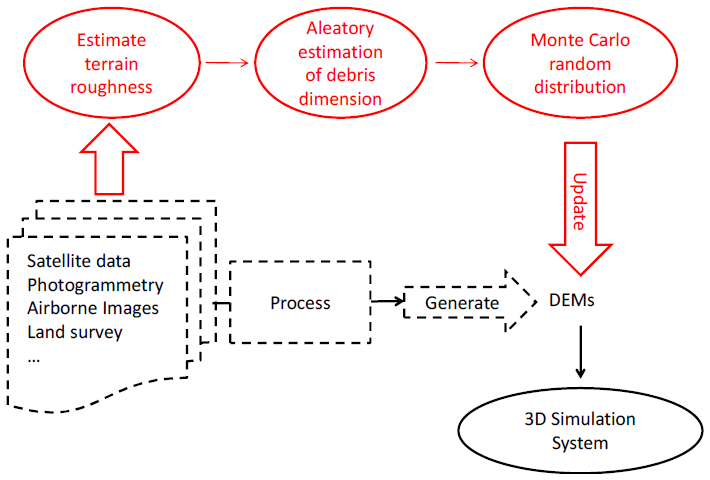
We have addressed this issue by integrating simulated punctual objects (such as rocks, debris, fails, etc.) after the generation of the main DEM. This approach allows to enhance the realism in terrain representation. We can add obstacles from low-altitude Drone flight or generate them in a random manner. The latter method is illustrated in Fig. 3. We use mathematical functions, classical in remote sensing, to estimate the roughness of the terrain. Let us consider a photogrammetry produced by a LIDAR. As explained in Bennett and Porteus (1961), roughness of a plane surface is related to its specular reflectance at normal incidence. The variation of the cosine of the illumination angle is representative of the roughness of the terrain. For instance, a constant cosine determines a relief which is almost null. After roughness estimation, ranges of values for physical parameters of obstacles (e.g., density, hardness, etc.) must be defined according to the mission specifications. Monte Carlo function can then be used to generate a random sampling of these obstacles which are distributed over the generated terrain.
3.2 Autonomous system
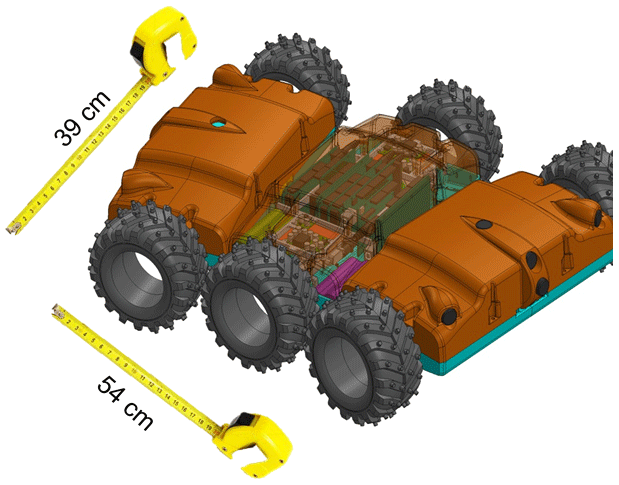
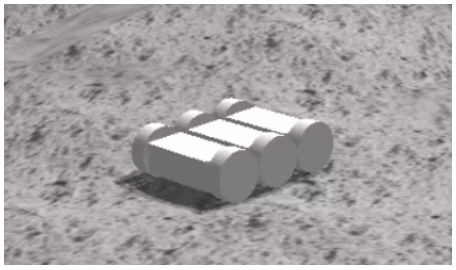
In order to realize such missions, our laboratory has designed ArcTurius Rover (Tanzi and Chandra, 2019), which is illustrated in Fig. 4. ArcTurius is an autonomous rolling system which aims to precisely locate buried people after an earthquake. Its design derives from its operations (i.e., progressing under debris or in very tight spaces) and the length of the mission (i.e., up to a week in complete autonomy).
ArcTurius is equipped with different sensors belonging to two categories:
-
Sensors that are necessary for its basic operations (location, navigation, obstacle avoidance, etc.)
-
Sensors that are customized according to the mission to be carried out. For instance, for Search & Rescue missions, sensors which are dedicated to detection of people (or bodies) are embedded, such as the Ground Penetrating Radar or even thermal camera.
Power consumption is an important challenge for ArcTurius. It must work for several consecutive days with no remote control. Moreover, it has been created for passing through holes and debris. In this regard, it is necessary to keep its dimensions small (Fig. 4). Thus, its reduced size does not enable the equipment of large batteries. Therefore, power consumption strongly influences its design. For this reason, components must be adapted to the mission and must meet energy requirements. This section explores how to model an A.S. in Gazebo (specifically ArcTurius). Firstly we will quickly recap how to validate the mechanical configuration of the rover, which is part of our previous work (Bertolino and Tanzi, 2019). We will then focus on sensor validation, specifically LIDAR.
3.2.1 Modelling of physical components
From the simulation system point of view, A.S. can be seen as a set of rigid bodies, named links, that are connected through junctions, named joints. With respect to A.S. modelling, it is important to realistically model both links and joints. For each link (such as the Rover chassis or wheels), it is necessary to explicit at least its geometry, its pose with respect to the surrounding environment and its inertia. More fine-grained models also consider physical parameters that better regulate the contact between two links.
Joints connect a father link to a child link. While modelling joints, it is necessary to explicit their type. For instance, a wheel is connected to a chassis through a continuous joint which is a continuous hinge rotating on a single axis without upper or lower spatial limits. Bodies are connected each other through a spherical joint characterized by 6 degrees of freedom. From the simulation point of view, the setting of joint safety limits (e.g., maximum effort as well as maximum velocity) is important with respect to real situations.
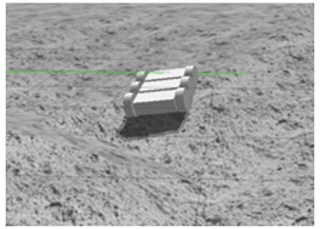
Figure 5 shows a simple representation of ArcTurius model. ArcTurius chassis has been modelled with a chain of 3 boxes, interconnected by a custom joint which enables flexibility to each body of the chain. Wheels are cylinders that are connected to each body through a revolute joint. In our previous work, we have validated the mechanical configuration of the rover testing its crossing capabilities on the landing site of Apollo 15. In this experiment, we have tried to integrate an open-source 3D terrain model provided by NASA resources (NASA 3D resources, 2015). In addition, landing site of Apollo 15 terrain has been chosen because it represents an environment whose several characteristics are still unknown and this is a common situation in disaster management. In our previous works we have performed simulations in the reconstruction of existing places in which natural disaster are occurred. For instance, in Tanzi and Bertolino (2020), we have generated a DEM representing a terrain in south-west of Haiti by merging data from ASTER survey (ASTER, 2004), USGS-NED (USGS-NED, 2016) and SRTM30+ (National Oceanic and Atmospheric Administration, 2020).
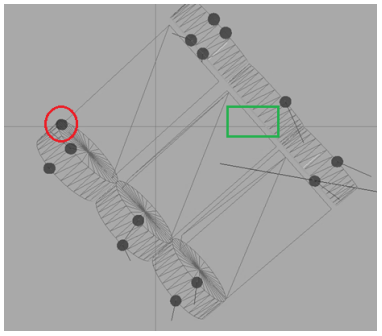
We have evaluated how the physical architecture can be set in order to avoid starving situations such as Fig. 6. The chassis of the rover touches the ground (red circle in Fig. 7) whereas a wheel is raised from the ground itself (the absence of contact points in the green square in Fig. 7).
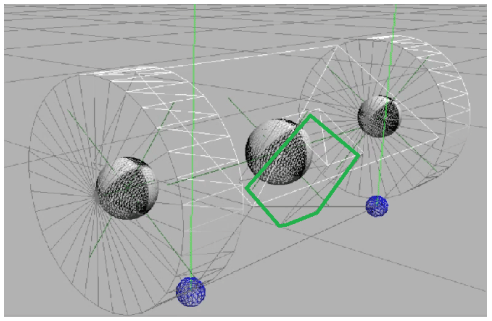
We have also evaluated how the introduction of a component (such as a sensor) has an impact on the balancing of the system. We have simulated the injection of a component which causes a parasitic sway of the system. This is illustrated in Fig. 8 where we can notice the centres of mass of wheels (right and left side) and of the central body after the integration of a component which is located in correspondence of the green box. At the bottom of the image, we can notice the contact points of the body to the ground, a behaviour that must be avoided in real contexts.
3.2.2 Modelling of sensors
Sensors are active components of the rover and they must be carefully modelled in the simulation system. Physical modelling of a sensor (e.g., shape, mass, balancing, etc.) follows the specifications listed in Sect. 3.2.1. The target of this section is the validation of a sensor from a behavioural point of view. Through 3D simulation, we aim to build the ideal instrument that is adapted to a target mission.
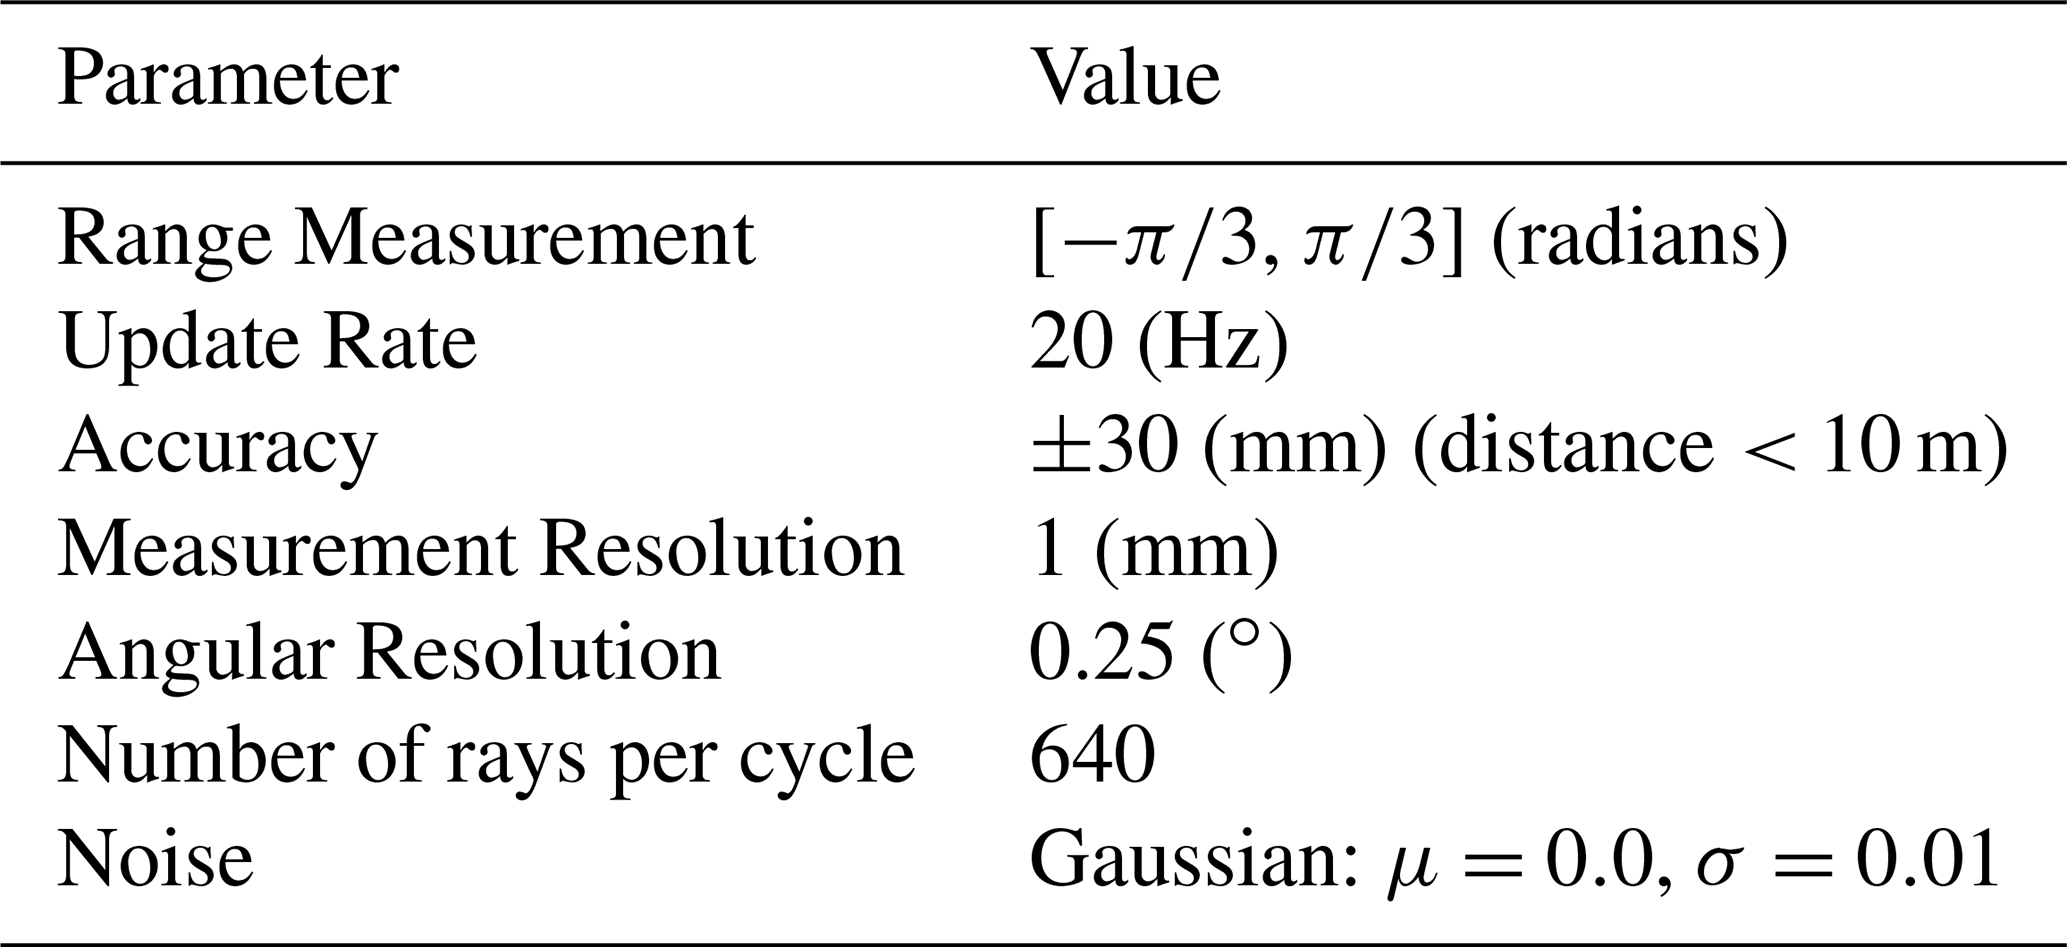
In this example, we take as a reference a Hokuyo LIDAR, the same used by Lee et al. (2016). We start with the modelling of LIDAR from the datasheet of the real Hokuyo UTM-30LX Scanning Laser Rangefinder (Hokuyo UTM-30LX, not dated). Starting from its maximum and minimum specifications, we have customized Hokuyo LIDAR model thus obtaining the values in Table 1. Sensors are noisy components and we must consider the noise in order to enhance the realism of the simulation. Currently it is possible to model the inferences which affect them through a Gaussian distribution with a moment parametrization (i.e., providing mean and standard deviation of the distribution) (Thrun et al., 2005). According to ArcTurius mission, we can assume to work within 10-distance meters. In this way, it is possible to simulate an accuracy of 30 mm by assuming that 99.7 % of the measurements are correct. This is achieved by modelling the noise with a Gaussian distribution whose mean is 0 and standard deviation is 0.01.
Table 1Possible set of parameters used to model a Hokuyo LIDAR mounted on ArcTurius rover.
In the following section, we wonder whether these parameters can be adapted according to ArcTurius energy requirements. In other words, we aim to establish how much the energy consumption can be limited while keeping the system adapted to the mission.
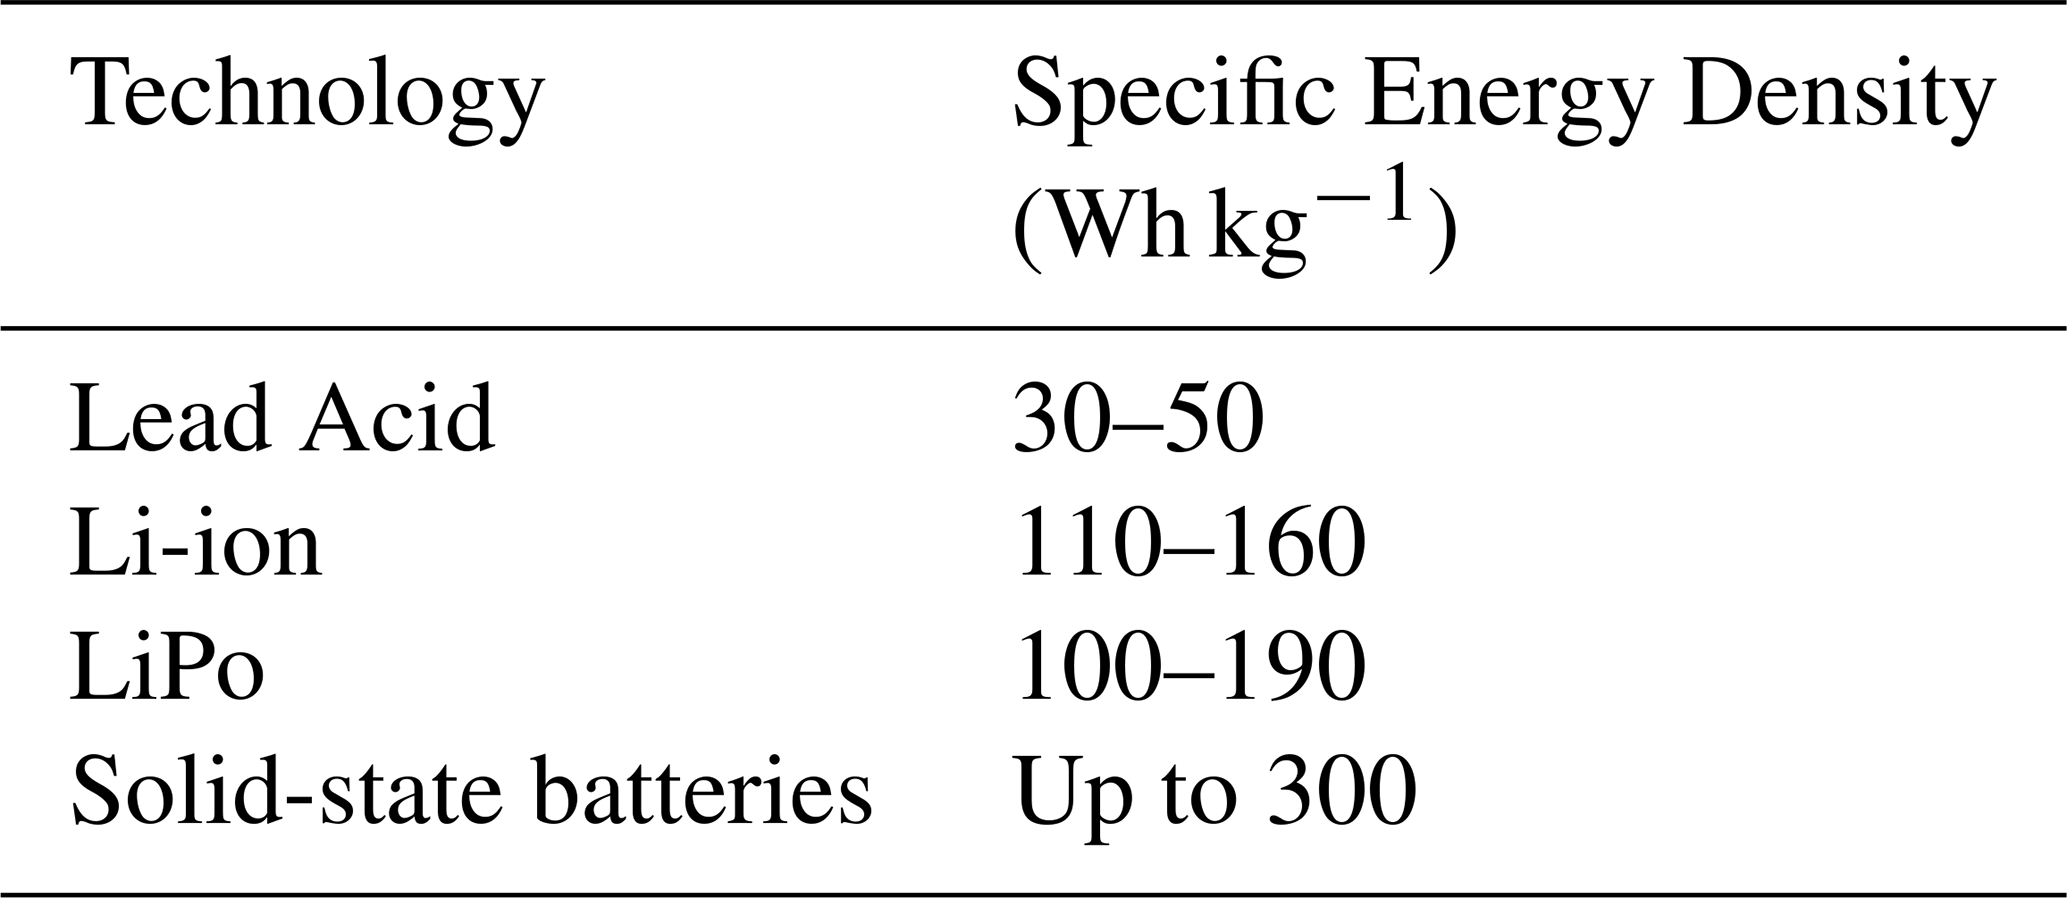
The following case study has only a pedagogical purpose. As we have stated in Sect. 3, the purpose of ArcTurius rover (taken as a reference) is the precise location of survivors and bodies in post-disaster environment. Its mission can last several days and we have already highlighted that the power consumption is an issue. We currently have mounted on the rover Lithium-ion Polymer batteries (LiPo), characterized by an energy density of about 100–130 Wh (watt-hour) kg−1, depending on the material (e.g., cobalt, manganese, phosphate). Table 2 shows an overview of the energy density associated to different technologies. It includes the above mentioned LiPo batteries, lithium-ion batteries and lead acid batteries (classical in traditional car engines). In addition, we can notice the experimental solid-state batteries, whose electrolyte candidate set includes ceramics, glass and aluminium, among others. They allow for higher densities (up to 300 Wh kg−1). When such technologies will be available in commerce, the energetic balance of ArcTurius will be easier to be satisfied. We will probably have to re-consider our design choices.
Table 2Some example of energy density in function of technology.
4.1 LIDAR energy considerations
When ArcTurius rover faces an obstacle or a hole, it stops for a brief computation in order to take its next decision. Then, it restarts at the end of the computation. The reason for this is that the operating speed of the rover is limited(about 2 km h−1). The stop before a computation helps to prevent some electromagnetic problems. The fact that the processing units used for computation are not the best available in terms of performance is not a big deal, because the rover can stop and take some time to do the computation. The geometry to be analysed could be complex though. This can require a more powerful processor even though the power consumption will increase. At this stage of the project and in this illustration, we will only do energetic considerations and about how the power consumption impacts on the mission duration.
We start by modelling a Hokuyo UTM-30LX LIDAR to perform some considerations from an energy point of view. In particular, we want to validate parameters in Tables 1 and 3 to assess:
-
Their adequacy with respect to the mission
-
The energy consumption of the instrument
The energy consumption can be easily evaluated starting from the information present on the sensor datasheet. If the computed energy consumption is below a certain threshold, we will need to verify that the instrument is adapted to the mission. In order to do that, we model the LIDAR in the simulation system and we can reconstruct the images captured in a simulated but realistic environment. If the consumption calculus overcomes the threshold set for the mission (and consequently the mission duration is going to last less than required), we will need to reduce the parameters that have an influence on the energy (e.g., the range measurement or the number of rays per-cycle) or to increment the batteries size. However, we have already seen that the latter situation can lead to an architectural variation, whose consequences have been explored in Sect. 3.2.1.
Table 3Another possible set of parameters used to model a Hokuyo LIDAR mounted on ArcTurius rover. In this second set, the number of rays per cycle is incredibly lower compared to Table 1. This reduces the power consumption.
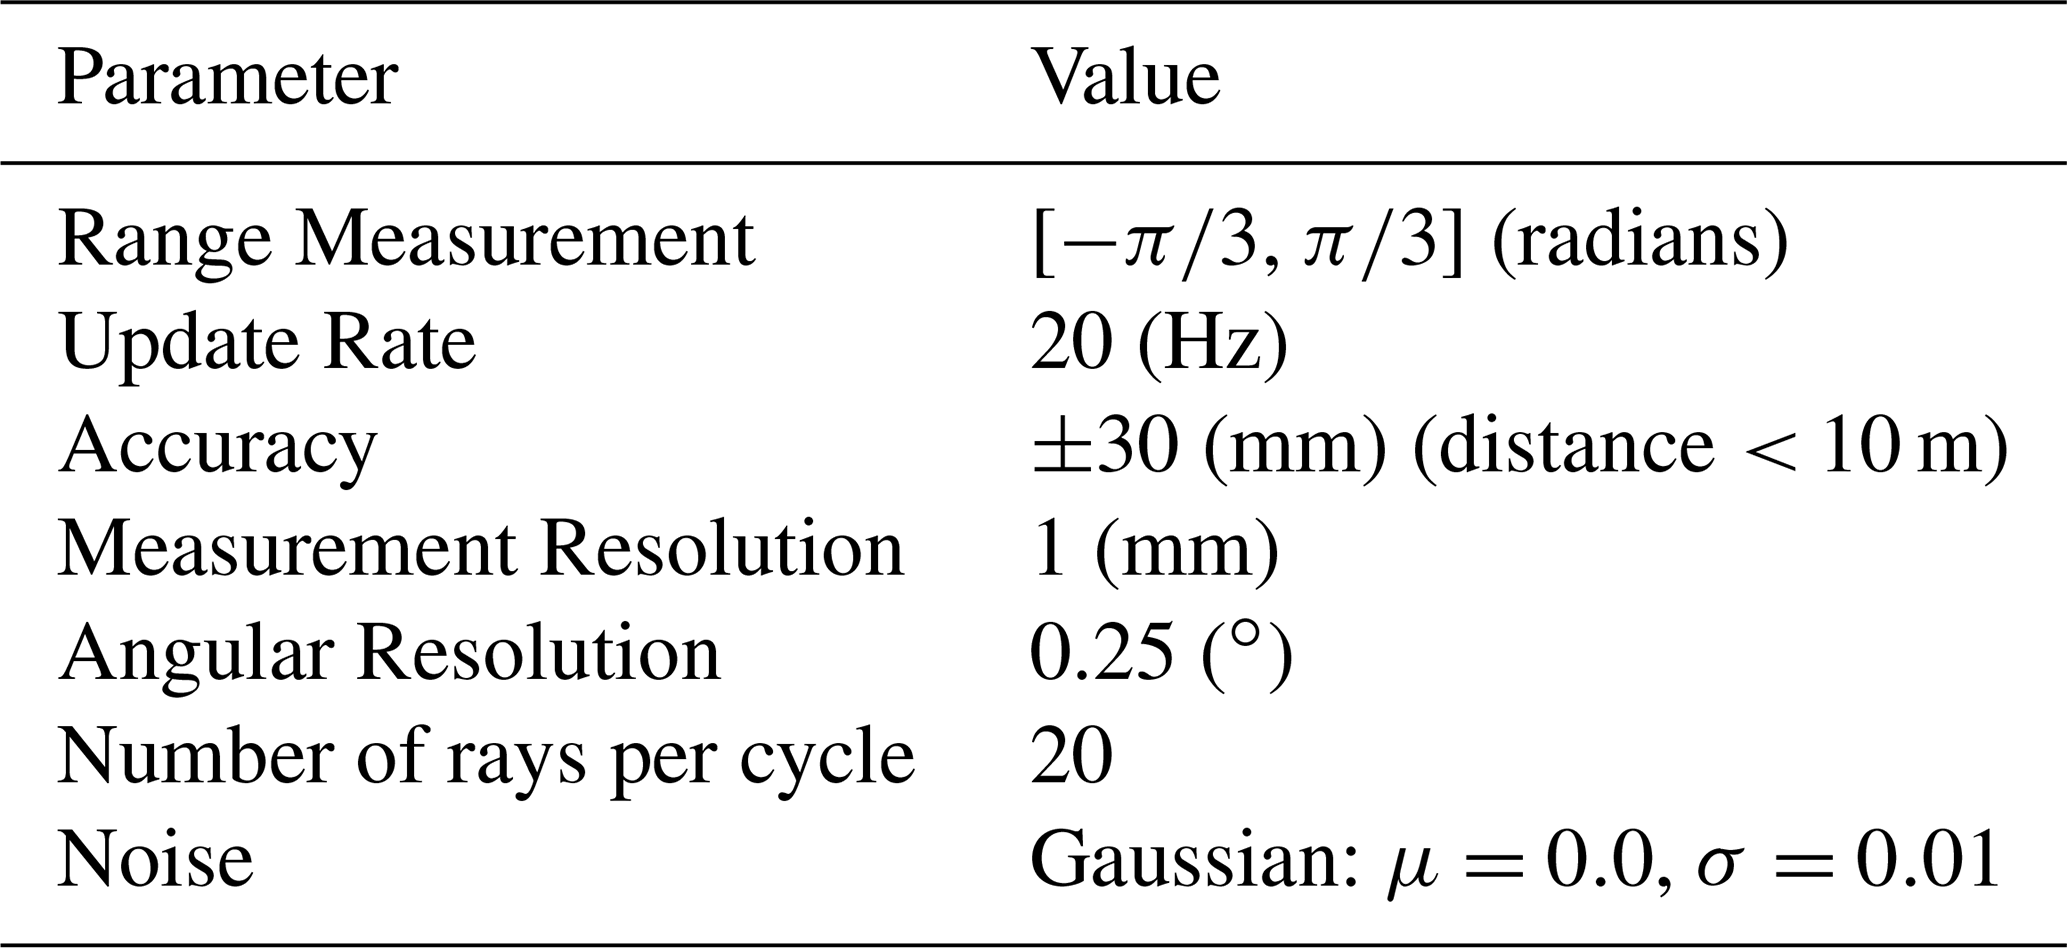
In order to keep the illustration simple, in this example we take into consideration only the number of rays per cycle while keeping the other parameters of Table 1 fixed. Our goal is to find the ideal instrument, i.e. a LIDAR whose acquired data have enough quality to allow the rover to act properly while keeping the energy consumption limited. Hokuyo LIDAR UTM-30LX consumes up to 8 W for each capture(Hokuyo UTM-30LX, not dated). By fixing the range measurement to 120∘ (from to , in radians), an update rate of 20 Hz and a time window for the analysis of 20 min, we have evaluated the behaviour of LIDAR in two case studies:
In the first case, we favour a precise reconstruction of the image by fixing the number of rays per cycle to 640 (Table 1). Figure 9 shows the simulation of the LIDAR, by using a dense beam of rays. Figure 10 shows the reconstruction, almost perfect, by using RViz (Kam et al., 2015).
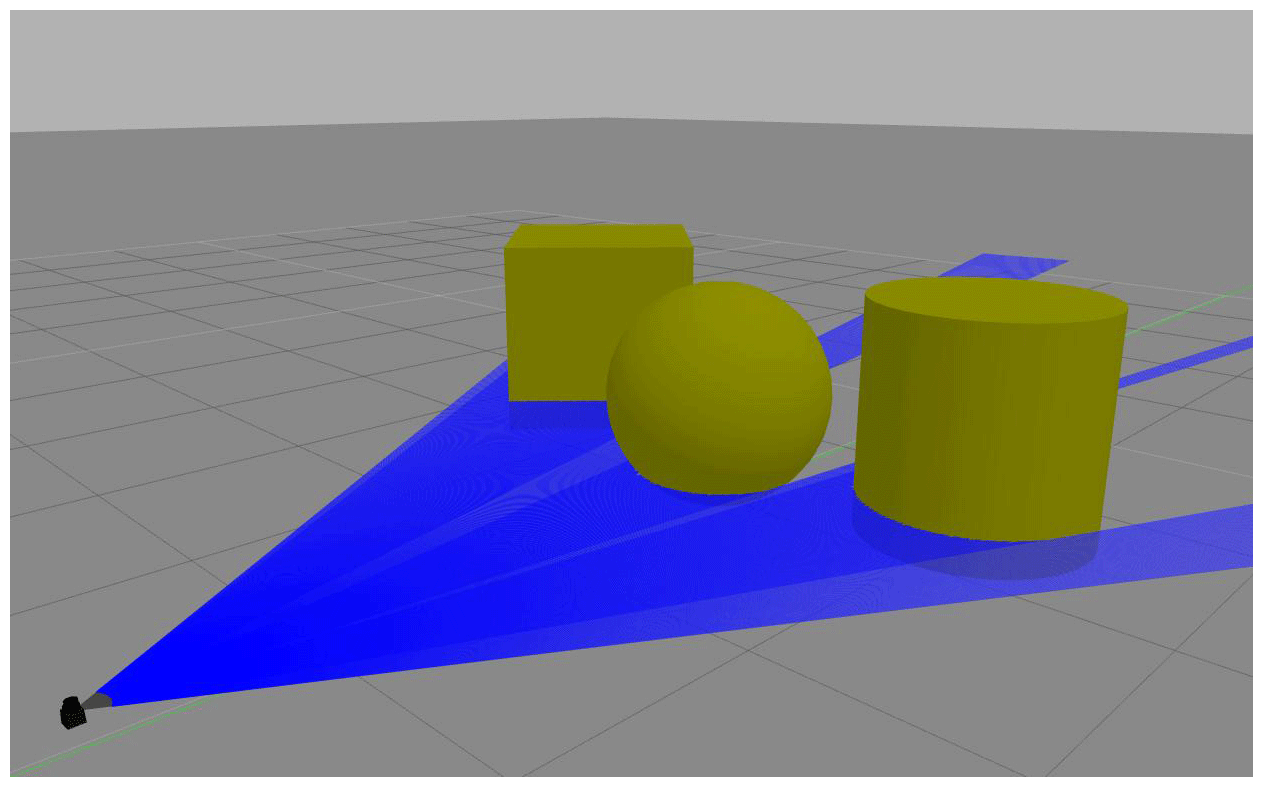
Figure 9Modelling of Hokuyo LIDAR UTM-30LX by using the parameters of Table 1. The beam of rays is dense (e.g., we cannot graphically distinguish one ray from another one).
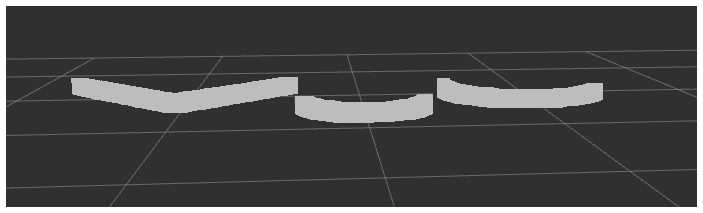
Figure 10Reconstruction of the obstacles captured by the Hokuyo LIDAR UTM-30LX of Fig. 9, modelled with parameters of Table 1. The graphical reconstruction is precise.
In the second case we have built a sparse and more economic (from energy point of view) reconstruction of the image by fixing the number of rays per cycle to 20 (Table 3). Figure 11 shows the simulation of the LIDAR, by using a less dense beam of rays with regard to the previous case. Figure 12 shows the reconstruction, which is rougher compared to the previous case.
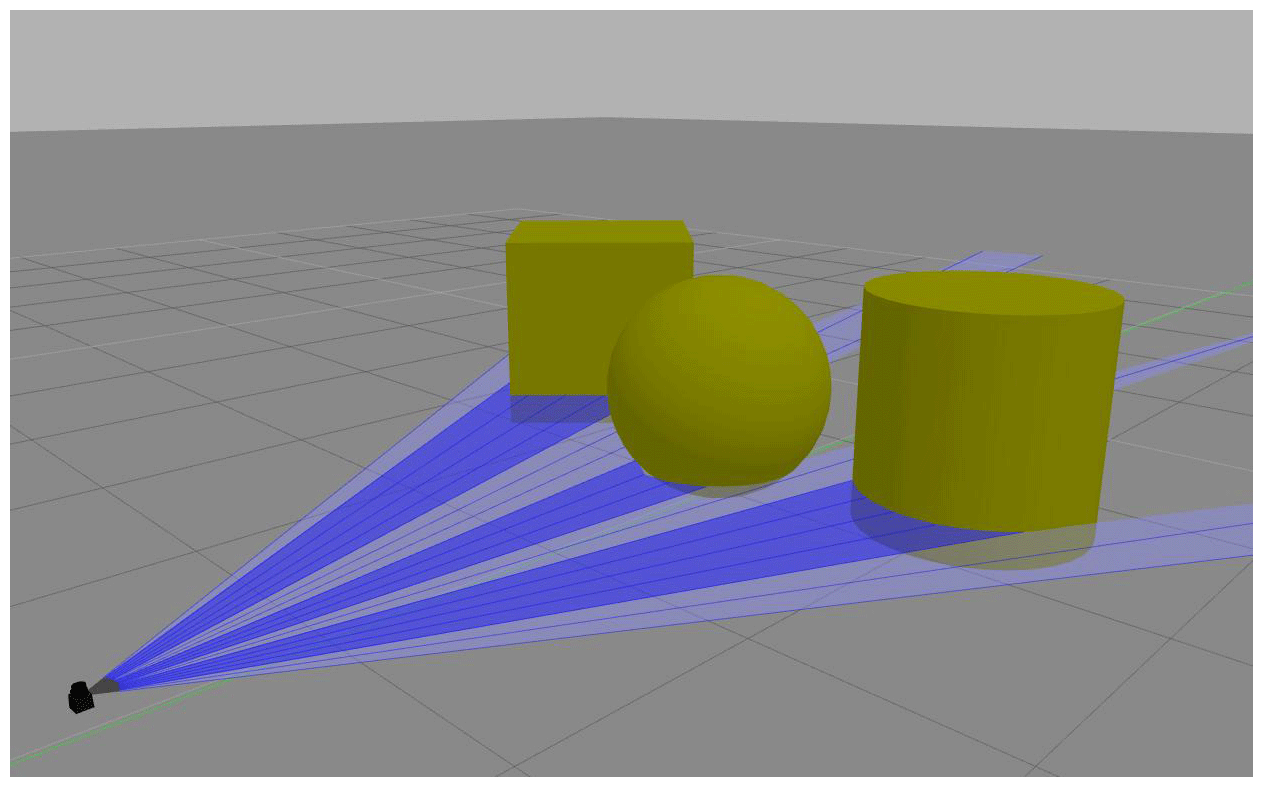
Figure 11Modelling of Hokuyo LIDAR UTM-30LX using the parameters of Table 3. The beam of rays is sparser with respect of Fig. 9. The number of rays per cycle is fixed at 20 in this experiment, instead of 640 of Fig. 9.
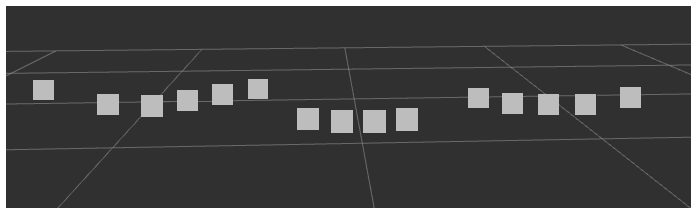
Figure 12Reconstruction of the obstacles captured by the Hokuyo LIDAR UTM-30LX of Fig. 10, modelled with parameters of Table 3. The reconstruction is rougher than the one in Fig. 10. The purpose of our approach is to understand the maximum LIDAR degradation that we can allow for a mission in order to save as much energy as possible.
In the last case the image is obviously not reconstructed correctly because of the low number of samples. In the context of ArcTurius mission, the blank spaces in Fig. 12 can give the misleading impression which there is enough space to get through. The question that we aim to answer is: which is the maximum degradation of the reconstructed image that we can accept starting from mission requirements? Through this approach, it is possible to find a compromise between adequacy of the instrument and power consumption. In this way, the most suitable device for the autonomous system is allowed to be found. We start from real parameters taken by the data-sheet of a real instrument. Then, we calculate new parameters that allow to reduce the energy consumption while verifying its adequacy in a realistic environment. From these experiments, we have decided to use a LIDAR configuration such as the one illustrated in Table 3 during the normal navigation of the rover ArcTurius. This allows a rough detection of the obstacles while keeping the energy consumption limited. Once ArcTurius rover gets close to an obstacle, the configuration is dynamically switched to the one illustrated in Table 1. This is done in order to avoid to take an erroneous decision caused by an incomplete reconstruction (such as the situation in Fig. 12).
4.2 Other optimizations
The previous was a simple pedagogical example. During a real assessment, we must compare different set of sensors characterized by different parameters in various environment situations. There are several possible scenarios. For example, we can introduce a perturbation such as an intense light source placed in front of LIDAR source of rays. This can be representative of sunlight contamination, especially in situations where surface albedos are high, such as land and snow surfaces. In such cases, the scattered sunlight contribution to noise is higher than nominal situations (Sun et al., 2016).
The expected results from these simulations must enable a better handling of unknown situations and situations disturbed by any perturbation or signal noise. We can predict annoying situations and to mount and to configure an adequate set of sensors that can mitigate a possible perturbation. The purpose is must be prepared, in advance, against all the possible problems that we can encounter in an almost unknown environment. What we would like to prevent in this contribution is to begin an intervention with an autonomous system and to realize run-time that it is not useful because the architecture has been badly considered.
The use of autonomous vehicles incorporating modern technology sensors (LIDAR, Radar, video, etc.) opens up new perspectives for disasters management (Chandra and Tanzi, 2016; Servigne et al., 2016). This equipment is an increasingly sophisticated mean to acquire all kinds of information in order to explore a given environment. In this regard, the use of sensors coupled to an autonomous system allows a mission to be carried out without external intervention.
This approach allows the constraints of existing infrastructure or communication difficulties to be overcome (Tanzi et al., 2015), such as environments with broken, down or destroyed infrastructure following accidents or disasters. The information collected will have a dual purpose. The first aim is to understand and model the environment for a successful mission. The second one is to reuse this modelling in a broader decision-making framework by rescue teams (Apvrille et al., 2017; Tanzi et al., 2016). The processed data will be produced by a variety of sensors and deployed in networks for real-time collection (Liu, 2000; Berger, 2002; Shukla, 2016). The data produced are of various types: distance data obtained by two ultrasonic sensors (flight time), distance data obtained by optical laser sensors (LIDAR), position and attitude data produced by inertial systems (accelerometers, magnetometers, gyroscopes, etc.), odometer data, environmental data such as temperature, pressure, etc. This data will be combined to detect different elements of the environment.
The usage of autonomous flying systems (e.g., Drones), or autonomous rolling systems(e.g., Rovers) for post-disaster intervention in a devastated area enables: (i) time savings, (ii) the increase in the efficiency of the intervention and (iii) reduction of the risk to the rescue teams. These systems are able to reach places which are inaccessible and/or dangerous for human rescuers. In addition, autonomous systems are less sensitive to environmental conditions (such as meteorology) and to situations that can be stressful for humans (fatigue, danger, etc.). However, there are still difficulties which must be solved before achieving the expected autonomy. An important question remains: how to ensure that the design and configuration of the system that we will use for this mission are well suited to the terrain, conditions and overall to the mission?
One way to solve them is to increase our knowledge of the devastated area and take countermeasures in advance against possible unknown and annoying situations. At the origin of the mission such knowledge is relatively weak. In this paper, we have proposed a way to increase it even before arriving at the intervention site relying on simulation. We have defined a set of steps that allow to validate the behaviour of an autonomous system (movement, data acquisition, etc.) in a hostile environment as well as we define and validate the adaptation of the configuration of the payload sensors for the target mission. We have finally determined through simulations the quantitative parameters which characterize a LIDAR, mounted on the rover ArcTurius which we used as a reference in this paper, in order to keep the energy consumption low while keeping the sensor adapted to the mission.
Our future work aims to enhance the existing instruments to make them adapted with respect to disaster management. We will work to better support simulations by considering the evolution of physical phenomena during the disaster. For example, we will work on the reaction of the terrain in response to an external event such as rain. This mutates the soil coefficient of absorption of water as well as its saturation over time. Consequently, the motion of a rover may strongly suffer from these changes. To best of our knowledge, nobody addressed this case study in the context of robotics simulation in support to disaster management. Beyond the modelling point of view, these several functionalities require a particular IT development to be integrated into the current system. To sum up, disaster scenarios are chaotic: lives are in danger and time is precious. Chances of survival decrease sharply after the first 72 h. Once correctly configured and validated by 3D simulations, the use of these autonomous systems enables real time savings during the first hours after a disaster upon the arrival of rescue teams on site.
Our research is still at an exploratory level. We do not yet have sufficient reliable data to make them available. However, we are available to communicate the most relevant information by request.
TT contributed in the mechanical evaluations as well as the physical interpretation of the results. Moreover, he has supervised the modelling of the system and of the environment. MB worked on the 3D simulations with his knowledge of Gazebo environment and of Robot Operating System (ROS).
The authors declare that they have no conflict of interest.
This article is part of the special issue “Kleinheubacher Berichte 2019”. It is a result of the Kleinheubacher Berichte 2019, Miltenberg, Germany, 23–25 September 2019.
We thank the German URSI for allowing us to present this work during Kleinheubacher Berichte 2019, Miltenberg, Germany, 23–25 September 2019 and for the publication of this paper in Advances in Radio Science journal.
This paper was edited by Madhu Chandra and reviewed by Emre Colak and Madhu Chandra.
Apvrille, L., Tanzi, T., Roudier, Y., and Dugelay, J. L.: Drone humanitaire: état de l'art et réflexions, Revue Française de Photogrammétrie et de Télédétection no. 213-214, 63–71, ISSN 1768-9791, 2017.
ASTER: Global Digital Elevation Map, NASA Jet Propulsion Laboratory, California Institute of Technology, available at: https://asterweb.jpl.nasa.gov/gdem.asp (last access: 9 December 2020), 2004.
Bennett, H. E. and Porteus, J. O.: Relation Between Surface Roughness and Specular Reflectance at Normal Incidence, J. Opt. Soc. Am., 51, 123–129, 1961.
Berger, A. S.: Embedded Systems Design: An Introduction to Processes, Tools, and Techniques, CMP Books, Berkeley, CA, USA, 237 pp., ISBN 1578200733, 2002.
Bertolino, M. and Tanzi, T.: Advanced Robot 3D Simulation Interface for Disaster Management, Kleinheubach Conference, 23–25 September 2019, Miltenberg, Germany, 1–4, 2019.
Chandra, M. and Tanzi, T.: Wave Propagation and Radar System. Aspects for Designing a “Drone borne” GPR for Humanitarian Application, IEEE Conference on Antenna Measurements and Applications, 16–19 November 2014, Antibes, France, 2014.
Chandra, M. and Tanzi, T.: Feasibility Assessment of a Drone borne Ground Penetrating Radar Sensor for Humanitarian Applications in the context of Disaster Management, 1st URSI Atlantic Radio Science Conference (URSI AT RASC), 16–24 May 2015, Gran Canaria, Spain, 2015.
Chandra, M. and Tanzi, T.: Propagation Issues Relevant to the Design of a Drone Borne GPR (Ground Penetrating Radars), Kleinheubacher Tagung 2016 (KHB 2016), 26–28 September 2016, Miltenberg, Germany, 2016.
Chandra, M. and Tanzi, T.: Drone-Borne GPR Design: Propagation Issues, in: Journées scientifiques de l'URSI-France (JS'17), 1–3 February 2007, Sophia Antipolis, France, 2017.
Chandra, M. and Tanzi, T.: Drone-borne GPR design: Propagation issues, C. R. Phys., 19, 72–84, https://doi.org/10.1016/j.crhy.2018.01.002, 2018.
Dias, J. M. S., Nande, P., Barata, N., and Correia, A.: OGRE-open gestures recognition engine, Proceedings. 17th Brazilian Symposium on Computer Graphics and Image Processing, 17–20 October 2004, Curitiba, Brazil, 33–40, https://doi.org/10.1109/SIBGRA.2004.1352940, 2004.
Hokuyo UTM-30LX Scanning Laser Rangefinder: https://www.hokuyo-aut.jp/search/single.php?serial=169 (last access: 9 December 2020), 2019.
Kam, H. R., Lee, S., Park, T., and Kim, C.: RViz: a toolkit for real domain data visualization, Telecommun. Syst., 60, 1–9, https://doi.org/10.1007/s11235-015-0034-5, 2015.
Koenig, N. and Howard, A.: Design and use paradigms for Gazebo, an open-source multi-robot simulator, 2004 IEEE/RSJ International Conference on Intelligent Robots and Systems (IROS), 28 September–2 October 2004, Sendai, Japan, IEEE Cat. No.04CH37566, vol. 3, 2149–2154, 2004.
Lee, S., Har, D., and Kum, D.: Drone-Assisted Disaster Management: Finding Victims via Infrared Camera and Lidar Sensor Fusion, 2016 3rd Asia-Pacific World Congress on Computer Science and Engineering (APWC on CSE), 5–6 December 2016, Nadi, Fiji, 84–89, https://doi.org/10.1109/APWC-on-CSE.2016.025, 2016.
Li, C., Chen, F., Qi, F., Liu, M., Li, Z., Liang, F., Jing, X., Lu, G., and Wang, J.: Searching for Survivors through Random Human-Body Movement Outdoors by Continuous-Wave Radar Array, PloS one, 11, e0152201, https://doi.org/10.1371/journal.pone.0152201, 2016.
Li, Z., Zhu, Q., and Gold, C.: Digital terrain modeling: principles and methodology, CRC Press, Boca Raton, USA, 2005.
Liu, J. W. S.: Real-time Systems, 1st edn., Prentice Hall, Upper Saddle River, NJ, USA, available at: https://dl.acm.org/doi/book/10.5555/518501 (last access: 9 December 2020), 2000.
Mukhopadhay, B. and Bhattacherjee, B.: Use of Information Technology in Emergency and Disaster Management, American Journal for Environmental Protection, 4, 101–104, 2015.
NASA 3D Resources: Apollo 15 – Landing Site, available at: https://nasa3d.arc.nasa.gov/detail/Apollo15-Landing (last access: 9 December 2020), 2015.
National Oceanic and Atmospheric Administration: SRTM30+, Department of Commerce, available at: https://catalog.data.gov/dataset/topography-srtm30-version-6-0-30-arc-second-global, last access: 7 December 2020.
Russ, S.: Open Dynamics Engine User Guide, available at: http://ode.org (last access: 9 December 2020), 2006.
Servigne, S., Gripay, Y., Pinarer, O., Samuel, J., Ozgovde, A., and Jay, J.: Heterogeneous Sensor Data Exploration And Sustainable Declarative Monitoring Architecture: Application To Smart Building, ISPRS Ann. Photogramm. Remote Sens. Spatial Inf. Sci., IV-4/W1, 97–104, https://doi.org/10.5194/isprs-annals-IV-4-W1-97-2016, 2016.
Shean, D. E., Alexandrov, O., Moratto, Z. M., Smith, B. E., Joughin, I. R., Porter, C., and Morin, P.: An automated, open-source pipeline for mass production of digital elevation models (DEMs) from very-high-resolution commercial stereo satellite imagery, ISPRS J. Photogramm., 116, 101–117, https://doi.org/10.1016/j.isprsjprs.2016.03.012, 2016.
Shukla, S. K.: Introduction to Embedded Systems, TEQIP Course at IITK, IIT Kanpur, 29 August 2016, Kanpur, India, 2016.
Stormont, D. and Allan, V.: Managing Risk in Disaster Scenarios with Autonomous Robots, Journal of Systemics, Cybernetics and Informatics, 7, 66–71, 2009.
Sun, W., Hu, Y., MacDonnell, D., Weimer, C., and Baize, R.: Technique to separate lidar signal and sunlight, Opt. Express, 24, 12949, https://doi.org/10.1364/OE.24.012949, 2016.
Tanzi, T. and Bertolino, M.: 3D Simulation to Validate Autonomous Intervention Systems Architecture for Disaster Management, in: Information Technology in Disaster Risk Reduction, edited by: Murayama, Y., Velev, D., and Zlateva, P., ITDRR 2019. IFIP Advances in Information and Communication Technology, vol. 575, Springer, Cham, Switzerland, https://doi.org/10.1007/978-3-030-48939-7_17, 2020.
Tanzi, T. and Chandra, M.: Propagation modelling towards the design of drone borne GPR for humanitarian applications, in: XXXII General Assembly of the International Union of Radio Science, 19–26 August 2017, Montréal, Canada, 2017.
Tanzi, T. J. and Chandra, M.: Autonomous data collection for Disaster management: location aspects, 2019 URSI Asia-Pacific Radio Science Conference (AP-RASC), 9–15 March 2019, New Delhi, India, p. 1, https://doi.org/10.23919/URSIAP-RASC.2019.8738499, 2019.
Tanzi, T. J. and Isnard, J.: Public Safety Network: an Overview, chap. 1, in: Wireless Public Safety Networks 1, edited by: Câmara, D. and Nikaein, N., Elsevier, 1–20, https://doi.org/10.1016/B978-1-78548-022-5.50001-7, ISBN 9781785480225, 2015.
Tanzi, T. and Isnard, J.: Autonomous system for data collection: Location and mapping issues in post-disaster environment, C. R. Phys., 20, 204–217, 2019.
Tanzi, T., Roudier, Y., and Apvrille, L.: Towards a new architecture for autonomous data collection, ISPRS Geospatial Week 2015: Workshop on civil Unmanned Aerial Vehicles for geospatial data acquisition, 1–2 October 2015, La Grande Motte (Montpellier), France, 2015.
Tanzi, T., Chandra, M., Isnard, J., Camara, D., Sebastien, O., and Harivelo, F.: Towards “Drone-Borne” Disaster Management: Future Application Scenarios, ISPRS Ann. Photogramm. Remote Sens. Spatial Inf. Sci., III-8, 181–189, https://doi.org/10.5194/isprs-annals-III-8-181-2016, 2016.
Thi Phuoc Van, N., Tang, L., Demir, V., Hasan, S. F., Duc Minh, N., and Mukhopadhyay, S.: Review-Microwave Radar Sensing Systems for Search and Rescue Purposes, Sensors (Basel), 19, 2879, https://doi.org/10.3390/s19132879, 2019.
Thrun, S., Burgard, W., and Fox, D.: Probabilistic Robotics, The MIT Press, Cambridge, MA, USA, 672 pp., ISBN 9780262201629, 2005.
USGS National Elevation Dataset (NED): National Geospatial Program, available at: https://www.usgs.gov/core-science-systems/national-geospatial-program/national-map, last access: 10 August 2016.