 | 21 Mar 2023
Comparison of S-Parameter Measurement Methods for Adapters
Frauke Gellersen
Meike Tschauder
In this work two methods for the characterization of adapters meaning reciprocal two-ports with different connector styles on both ports are analyzed and compared in detail. The focus is on the comparison of these approaches in terms of required effort and obtained measurement uncertainty. The first method is based on two one-port calibrations and it is compared to a two-port approach. Both methods are carried out in simulation as well as in measurement under very comparable conditions using a 2.4 to 3.5 mm adapter in the frequency range up to 33 GHz as an example. The obtained measurement uncertainties of the results are presented and analyzed, the required measurement time in terms of the necessary number of separate connections is compared, and the influence of cable movements is discussed.
- Article
(5407 KB) - Full-text XML
- BibTeX
- EndNote


In measurement applications many DUTs (Devices Under Test) with two ports have different interfaces at their two ports and are commonly referred to as adapters. The interface for example can be a coaxial connector, a rectangular waveguide flange, a coplanar waveguide probe tip, or something else.
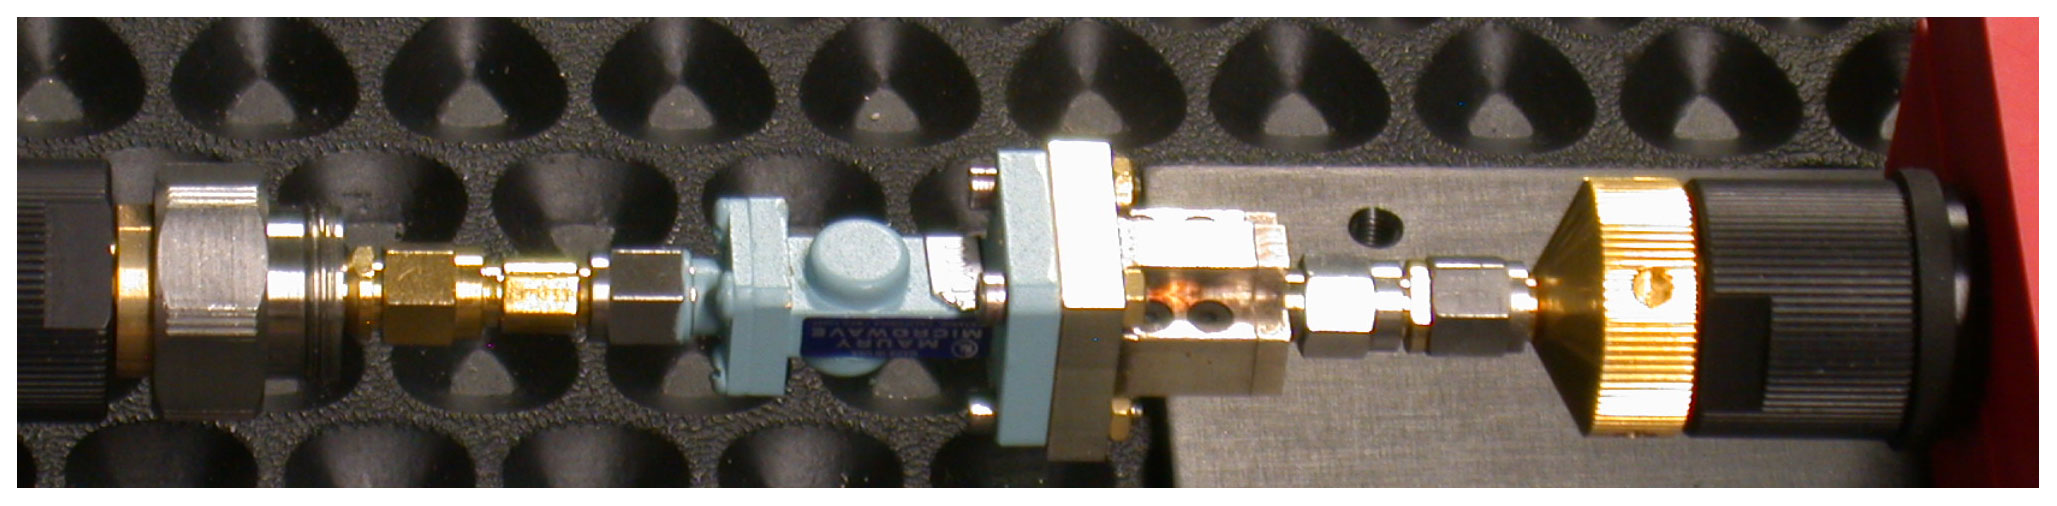
Exemplarily, Fig. 1 shows a measurement setup with two adapters (coaxial to rectangular waveguide) being measured in series (sometimes referred to as “back-to-back”). Precise measurements of such components and therefore calibration algorithms for VNAs (Vector Network Analyzers) are needed. In this work two suitable calibration algorithms for the measurement of such adapters are investigated and compared.
There are some other methods available and described in literature, which are suitable to characterize adapters. A very good overview can be found in Ruefenacht and the METAS VNA gang (2016). However, the two methods evaluated in detail in this work are the most promising to yield a low MU (measurement uncertainty) and are applicable to many types of adapters.
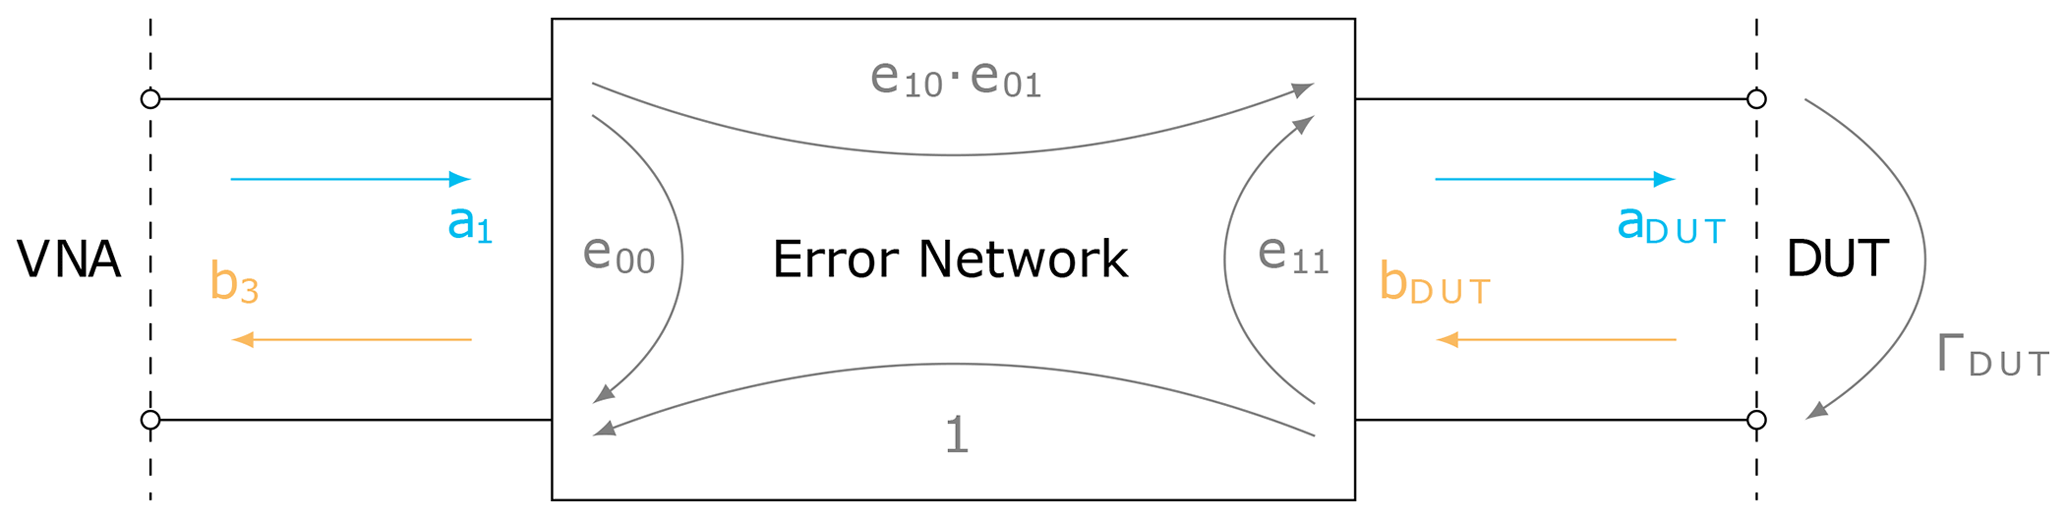
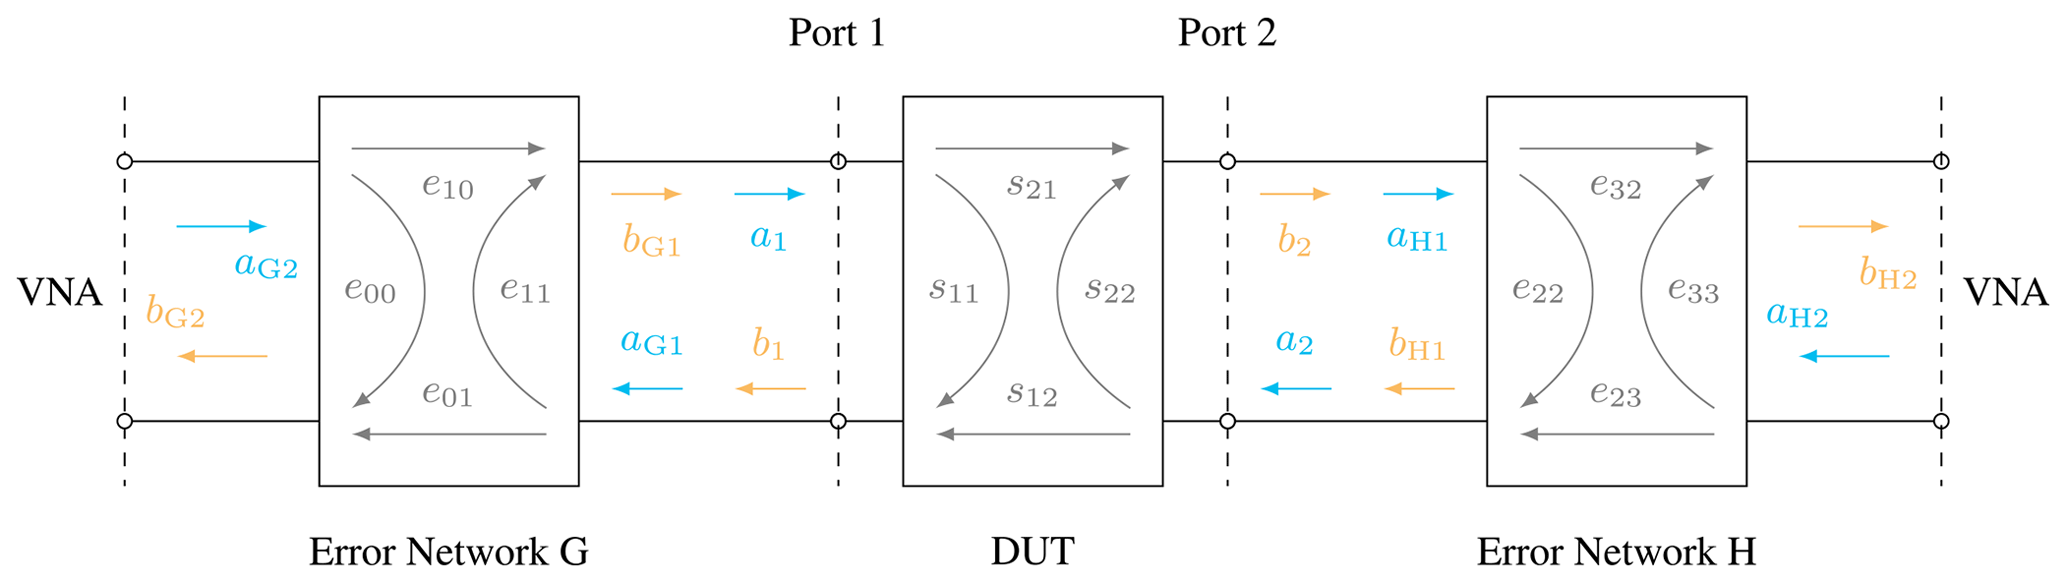
The first one is a VNA measurement method using only one-port calibration standards and one-port measurements. Here the devices Open, Short, and Match (OSM) are utilized, but other combinations (e.g. three offset shorts) are also possible as calibration standards. The VNA error model for this method is shown in Fig. 2. It will be compared to a two-port calibration method using an Unknown Thru connection in addition to the OSM standards. This method is often referred to as UOSM (Unknown Thru, Open, Short, Match) or SOLR (Short, Open, Load, Reciprocal) (Ferrero and Pisani, 1992; Stumper, 2008), and the error model is shown in Fig. 3.
The MU for both methods is evaluated using Working Group 1 of the Joint Committee for Guides in Metrology (2008); Mathworks (2021); and Zeier et al. (2012) and the obtained MU and the required effort (e.g. measurement steps and connections), which is related to the measurement time, are compared.
2.1 OSM Method
The OSM method is a one-port measurement method. It includes two one-port VNA calibrations with at least three calibration standards, respectively. The first calibration is performed at the measurement port (reference plane) of the VNA. For the second calibration the first port of the adapter is connected to the VNA and again three known standards are measured, this time connected to the second port of the adapter. Both VNA calibrations yield an error network with three error terms, as depicted in Fig. 2.
The second error network contains the DUT (adapter), while the first one does not. With the assumption of reciprocity (S12=S21) for the DUT, the first error network is de-cascaded on the left side of the second error network and the S-parameters (scattering parameters) of the DUT are obtained. To measure several DUTs with this method, the second calibration must be performed several times.
2.2 UOSM Method
The UOSM method is a full two-port VNA calibration using the 7-term error model (Ferrero and Pisani, 1992), and the measurement of the so-called switch terms (Marks, 1997) is required. The obtained error terms are depicted in Fig. 3.
If the adapter is used during this calibration as the unknown thru standard, the only requirement is, that it must be reciprocal and the insertion loss (attenuation) should not be too high. For adapters with high insertion loss, the dynamic range of the VNA determines the quality of the calibration result. To avoid this, the insertion loss should be small and the transmission signals S12 and S21 well above the VNA noise level.
With the error terms obtained, no further connections of calibration standards are required, and several DUTs can be measured one after the other. At least, this is true as long as cable movements (one source of MU) are allowed. If more than one two-port DUT is to be measured, and cable movements must be avoided completely, one set of OSM standards has to be measured in between the DUT measurements to recalibrate one VNA port after the movement of one cable.
In this section the methods OSM and UOSM are compared without the influence of the measurement set-up. Only the MU of the calibration standards is included. As DUT a coaxial adapter for 3.5 and 2.4 mm interfaces is used.
While experiments (measurements) are often needed and applied to verify theoretical concepts, simulations have the advantage to work on ideal data. Of course this holds only true if the model is good enough to represent the actual physics. Modeling VNAs as well as the determination of the measurement uncertainties is very well understood and described in Zeier et al. (2018). Typical influences present in nearly all VNA measurement set-ups are:
-
VNA drift,
-
VNA noise,
-
VNA linearity,
-
connection repeatability,
-
cable movements,
-
calibration standards.
These non ideal circumstances will always change, to a small or not so small degree, the nominal result of any experiment, but they can be avoided completely in a simulation. Therefore, except for the MUs of the calibration standards, the above listed influences are set to zero in the following simulations. This is done, because the influence of the calibration standards is at the core of the investigations in this work. For the error network of the VNA in the simulation, typical values for source match, directivity, and tracking within the used frequency range up to 33 GHz are assumed.
In all simulations the used one-port standards are Open, Short, and Match (OSM). For simplification, the measurement uncertainties are assumed to be identical for those three standards and are plotted in Fig. 4 for two different scenarios.
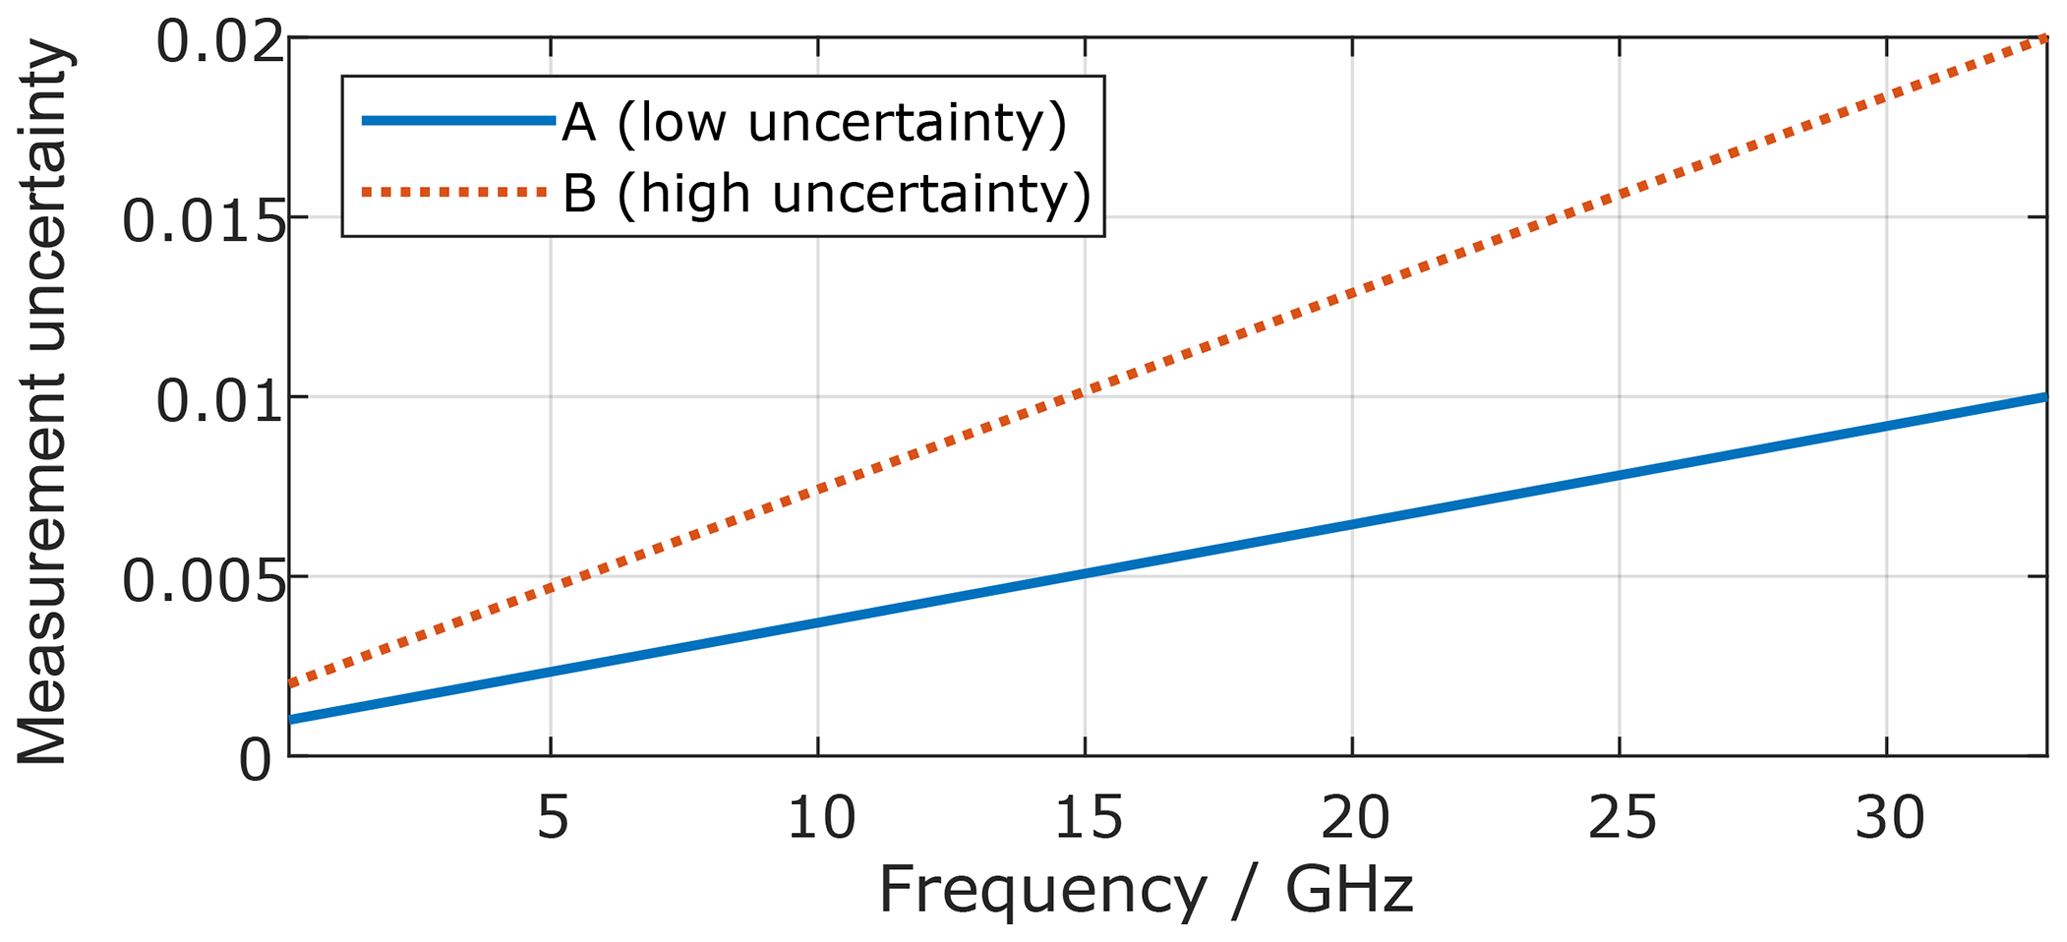
For the first scenario the uncertainties are identical for both adapter interfaces (A), here the coaxial connectors 3.5 and 2.4 mm. For the second scenario the MUs are higher for the 2.4 mm interface (B).
In the simulation the adapter could in theory consist of any reciprocal two-port data. Here, to have a reasonably good representation of a real adapter, it is modeled from two cascaded sections of beadless air-dielectric lines using the algorithm of Daywitt (1990) and the parameter given in Table 1.
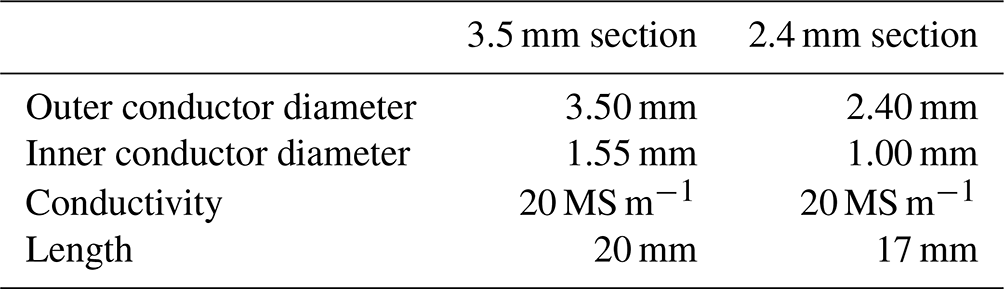
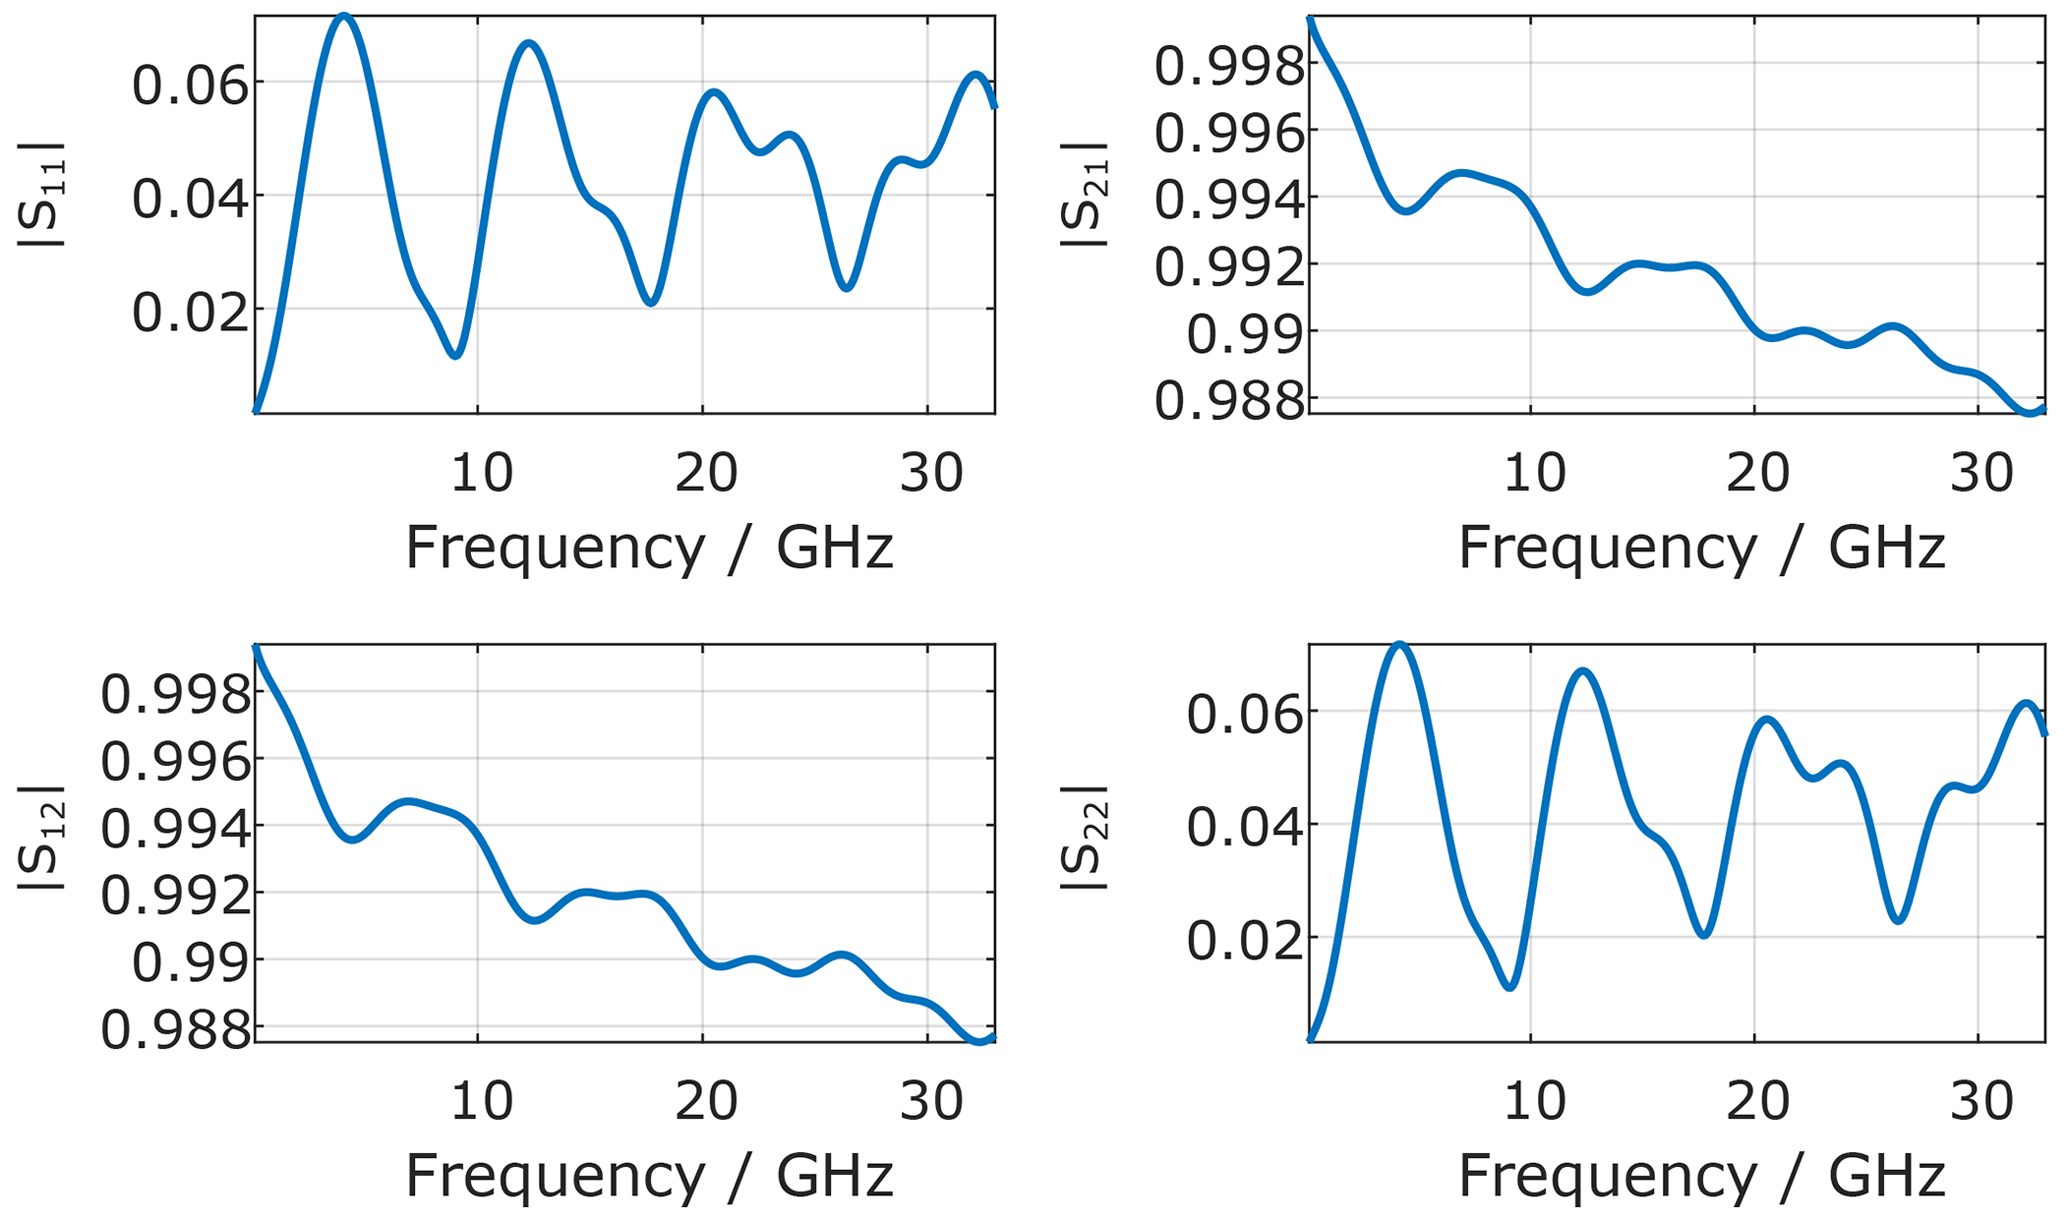
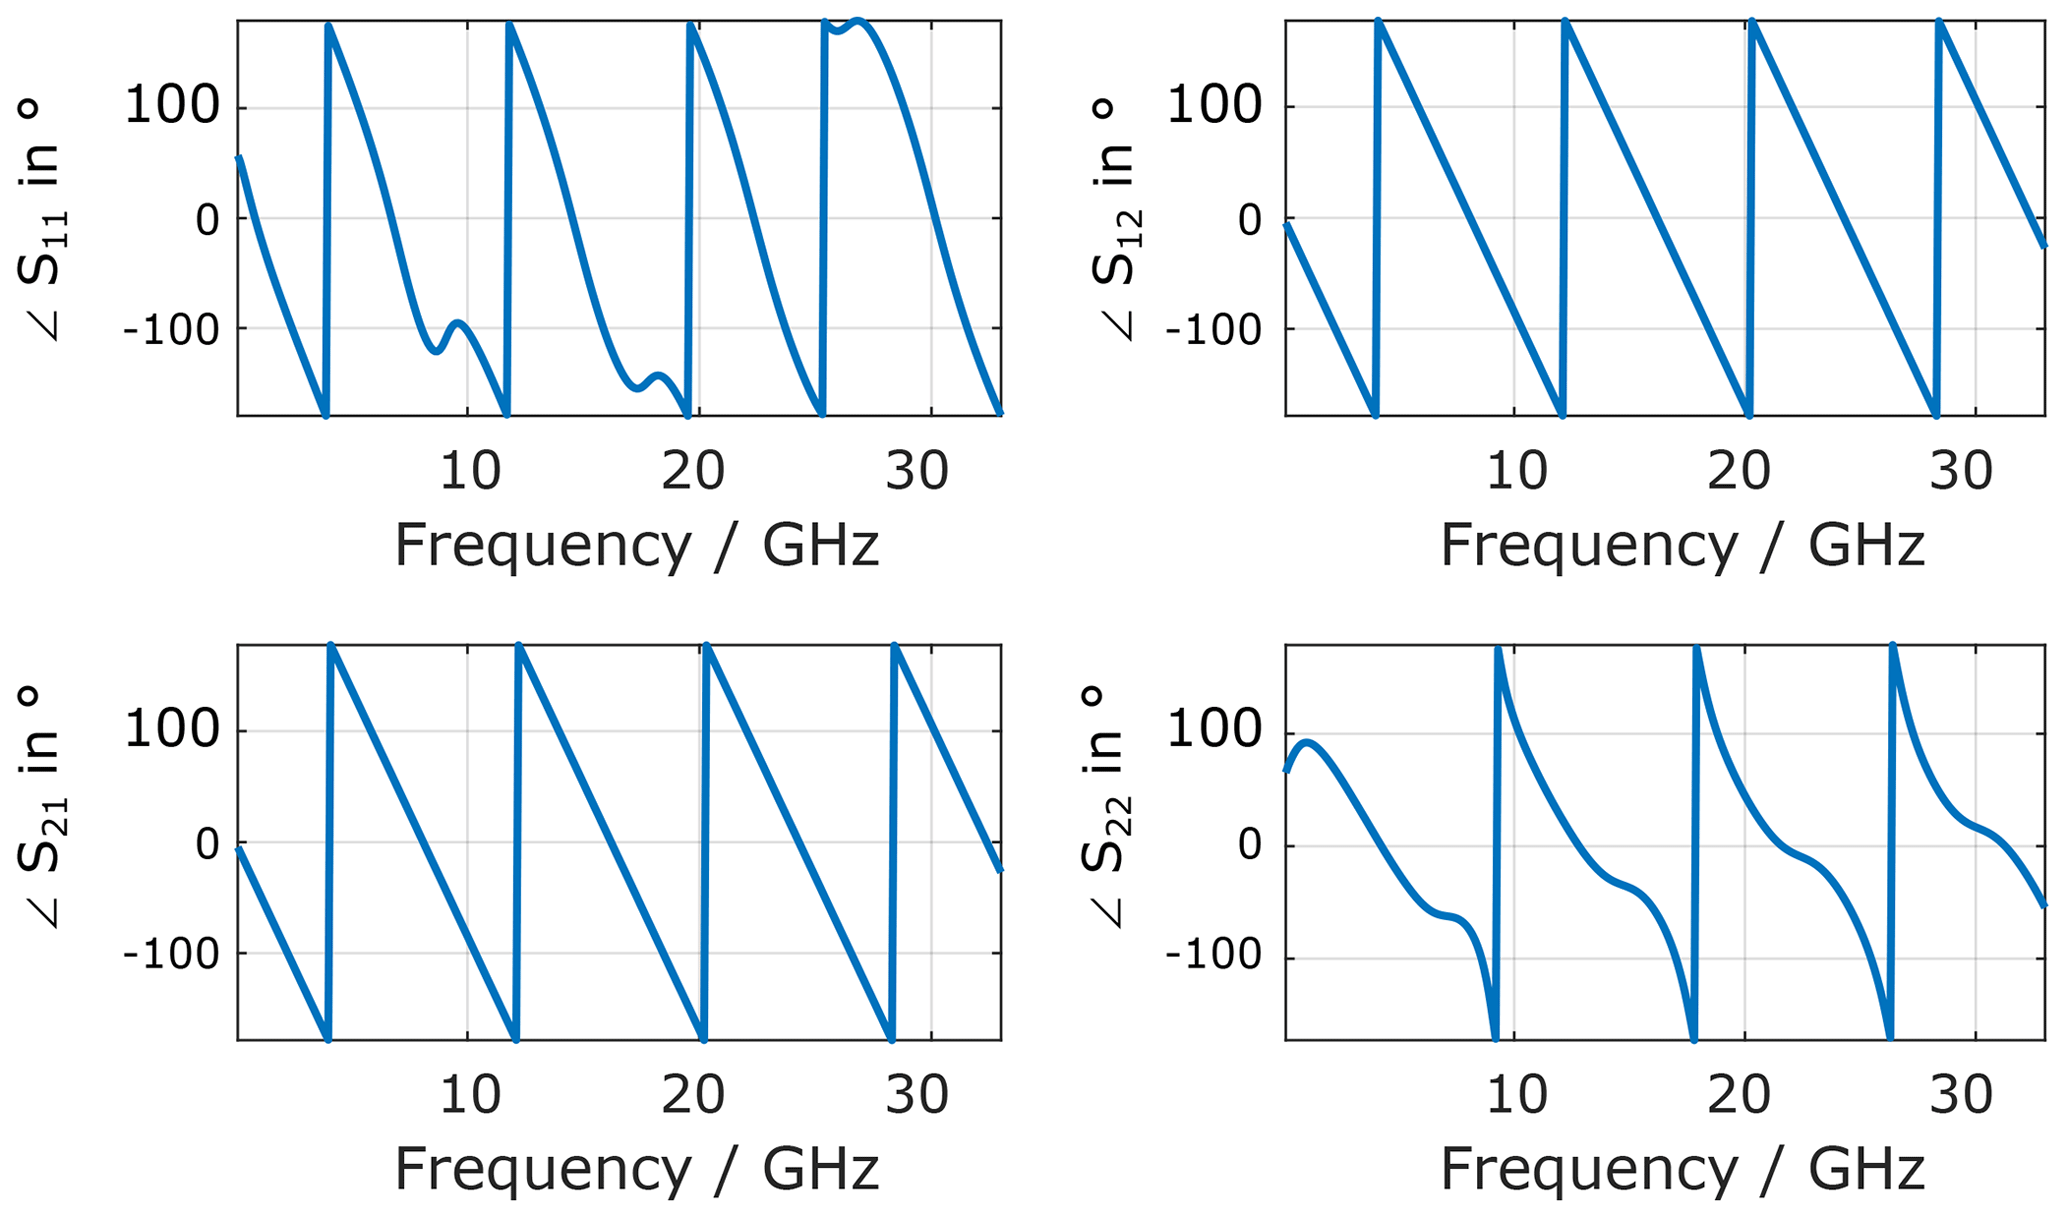
To create some significant reflection in a system with a reference impedance of 50 Ω, the impedances of both sections slightly deviate from 50 Ω. The S-parameters of the adapter are given in Figs. 5 and 6.
The nominal results for both VNA calibrations (OSM and UOSM), namely the S-parameters of the coaxial adapter, agree perfectly (, numerical limit for double precision variables) with the data fed into the simulation. As the one-port method was started both at VNA port 1 and VNA port 2, six calibrations overall are investigated. The obtained MUs (95 % confidence interval) are plotted in Figs. 7 and 8.
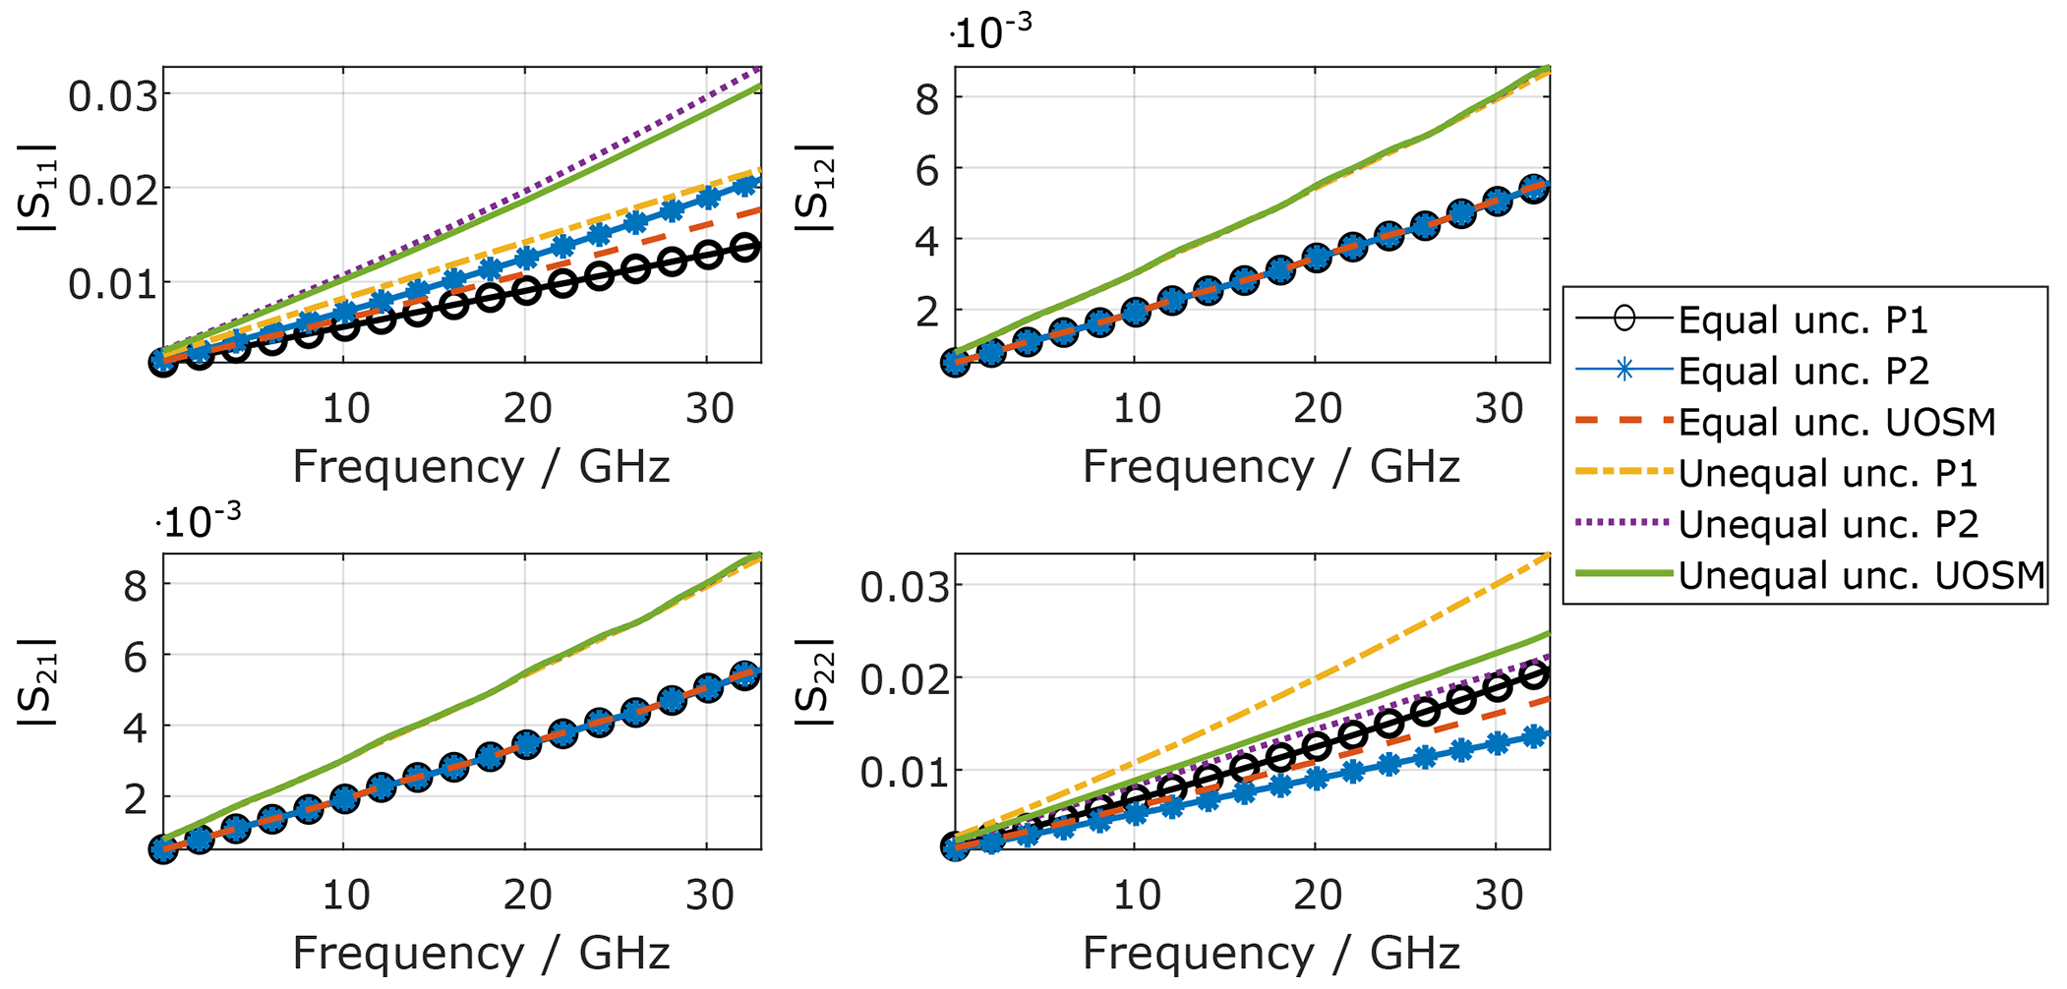
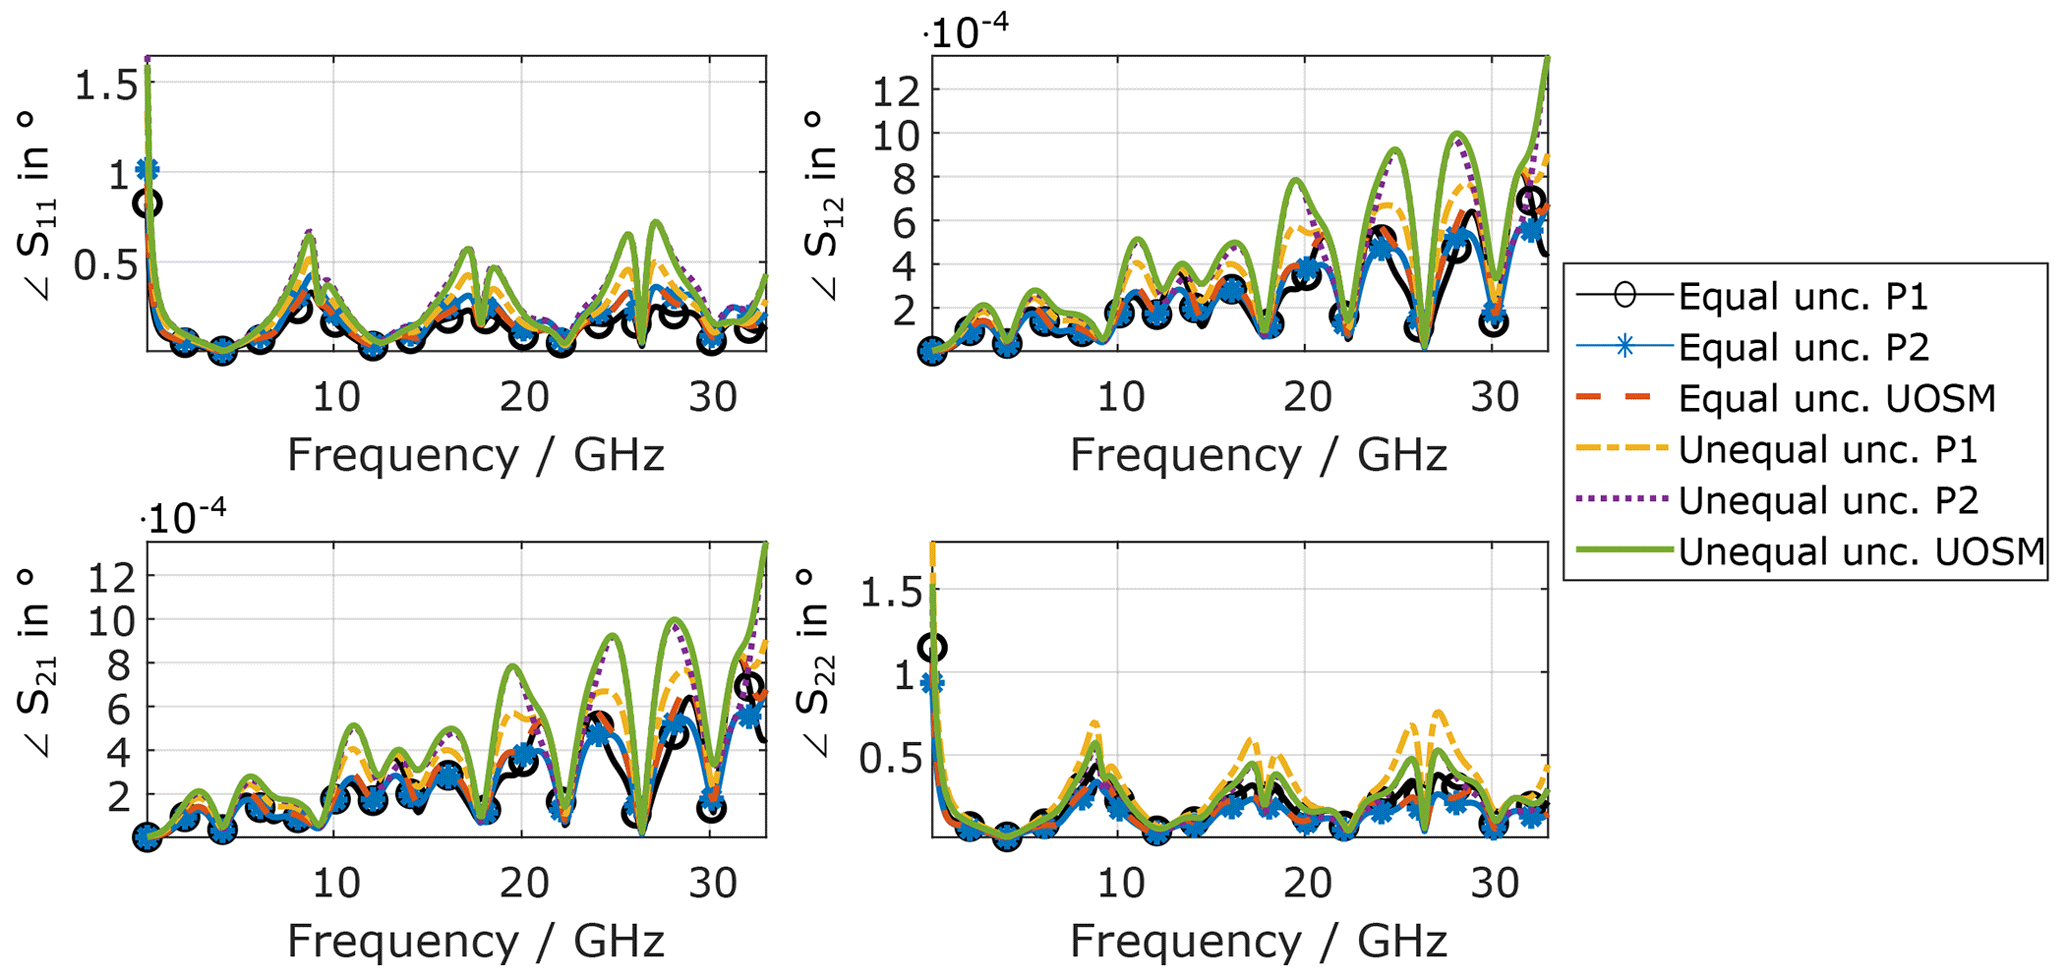
As can be seen, the MU for the transmission parameters (S21 and S12) are identical within in numerical precision for both magnitude and phase for the applied calibrations for both scenarios (equal and unequal MU for the OSM standards), respectively. Significant differences occur for the reflection parameters (S11 and S22). Here, the following observations are pointed out:
-
The phase MU is highest for smallest nominal values (here reflection coefficients).
-
The OSM method achieves the smallest MU.
-
Larger MU at one VNA port (here Port 2) also increases the MU at the other VNA port (here Port 1).
-
Starting the OSM method at VNA Port 1 or 2 yields different MU.
The third point was kind of unexpected, and the last point depends on the DUT as well as the VNA raw performance. For a perfectly symmetrical adapter and identical error parameter for each VNA port, the MU should be identical for both reflection parameters. Both was not the case in this simulation to bring some attention to this effect.
To better understand the source of the MU, the MU budgets are calculated and plotted in the Figs. 9 to 12 for the OSM method starting at VNA Port 1. The MU budgets for the other calibration methods (OSM starting with the other port and UOSM) are similar. The adapter itself serves as a reciprocal calibration standard for the unknown thru measurement, and it would not contribute to the MU.
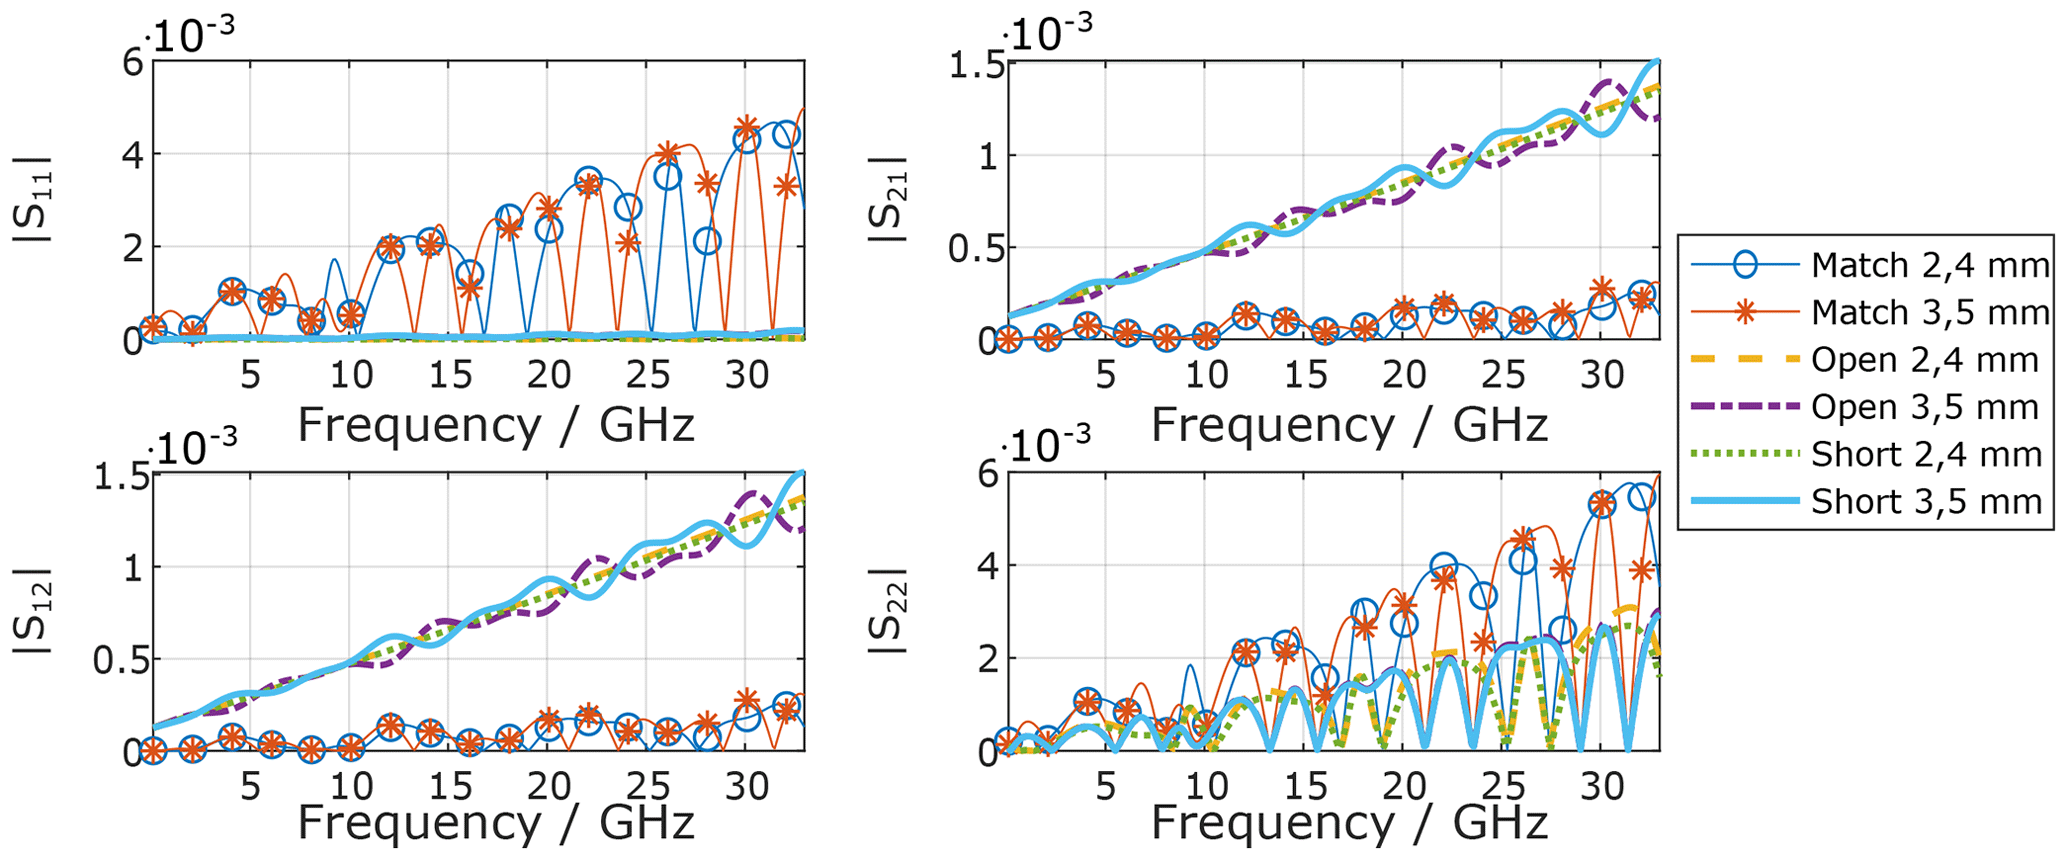
Figure 9Uncertainty budget (95 % confidence interval) for the adapter S-parameters magnitude, while assuming equal uncertainties for both calibration standard types.
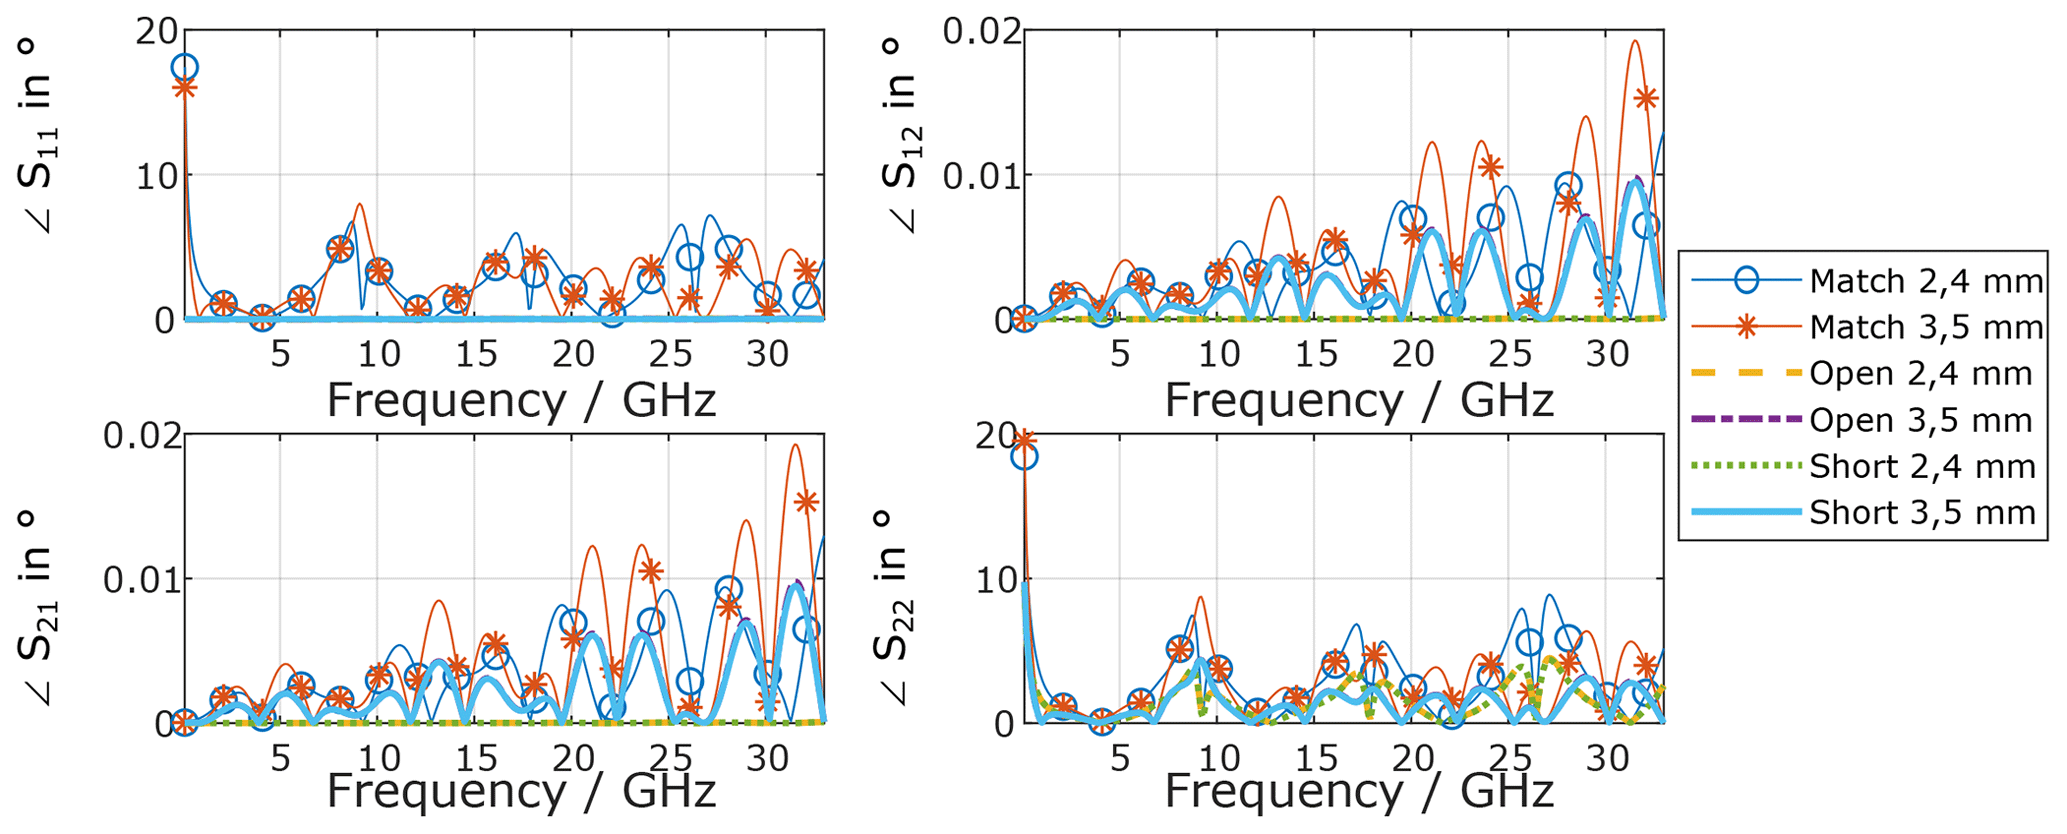
Figure 10Uncertainty budget (95 % confidence interval) for the adapter S-parameters phase, while assuming equal uncertainties for both calibration standard types.
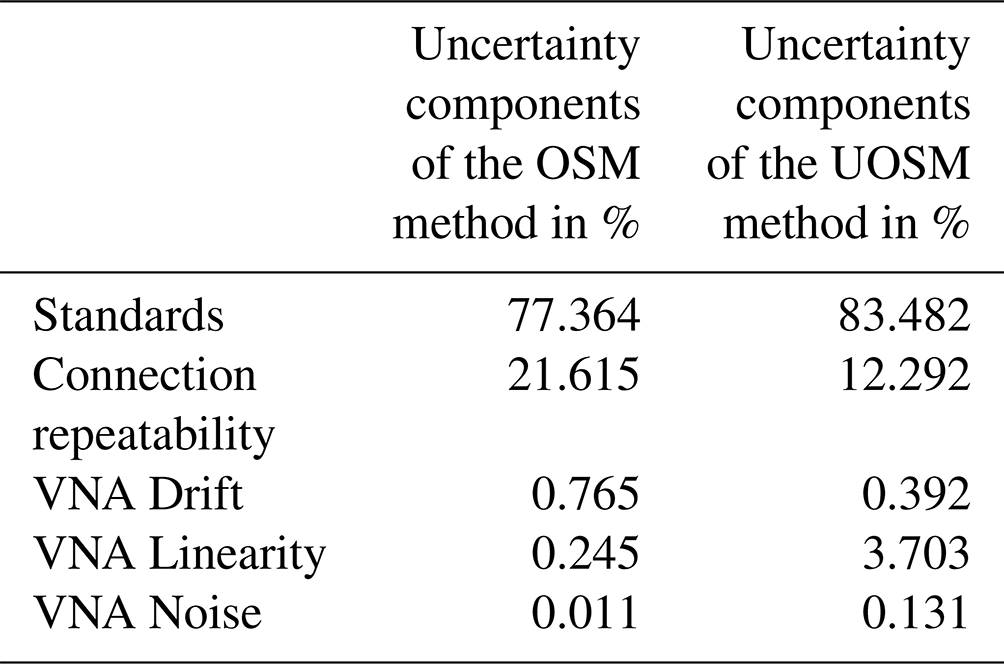
Table 2Uncertainty budget of for both calibration methods at 15 GHz.
Noteworthy things to point out are:
-
The MU of the calibration standards used at one VNA port are also part of the MU budget at the other VNA port.
-
The Match standards determine the MU of the well matched reflection coefficients.
-
The high reflect standards (Open and Short) determine the MU of the transmission coefficients.
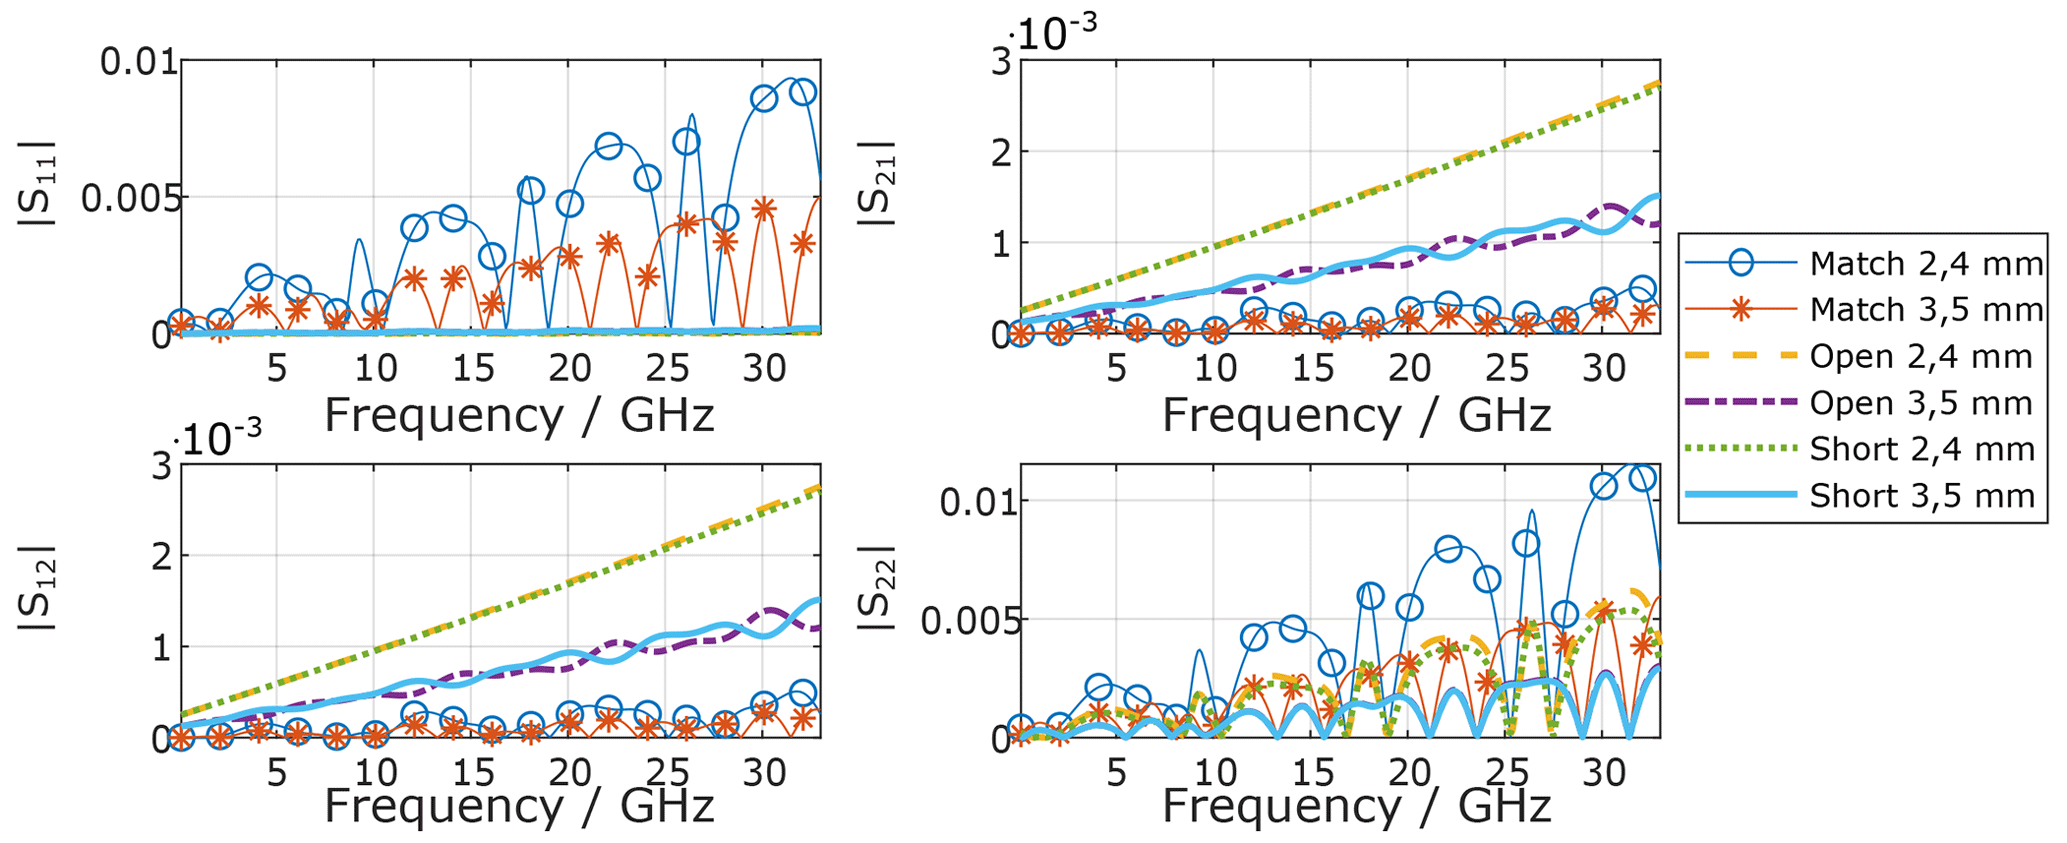
Figure 11Uncertainty budget (95 % confidence interval) for the adapter S-parameters magnitude, while assuming different uncertainties for both calibration standard types.
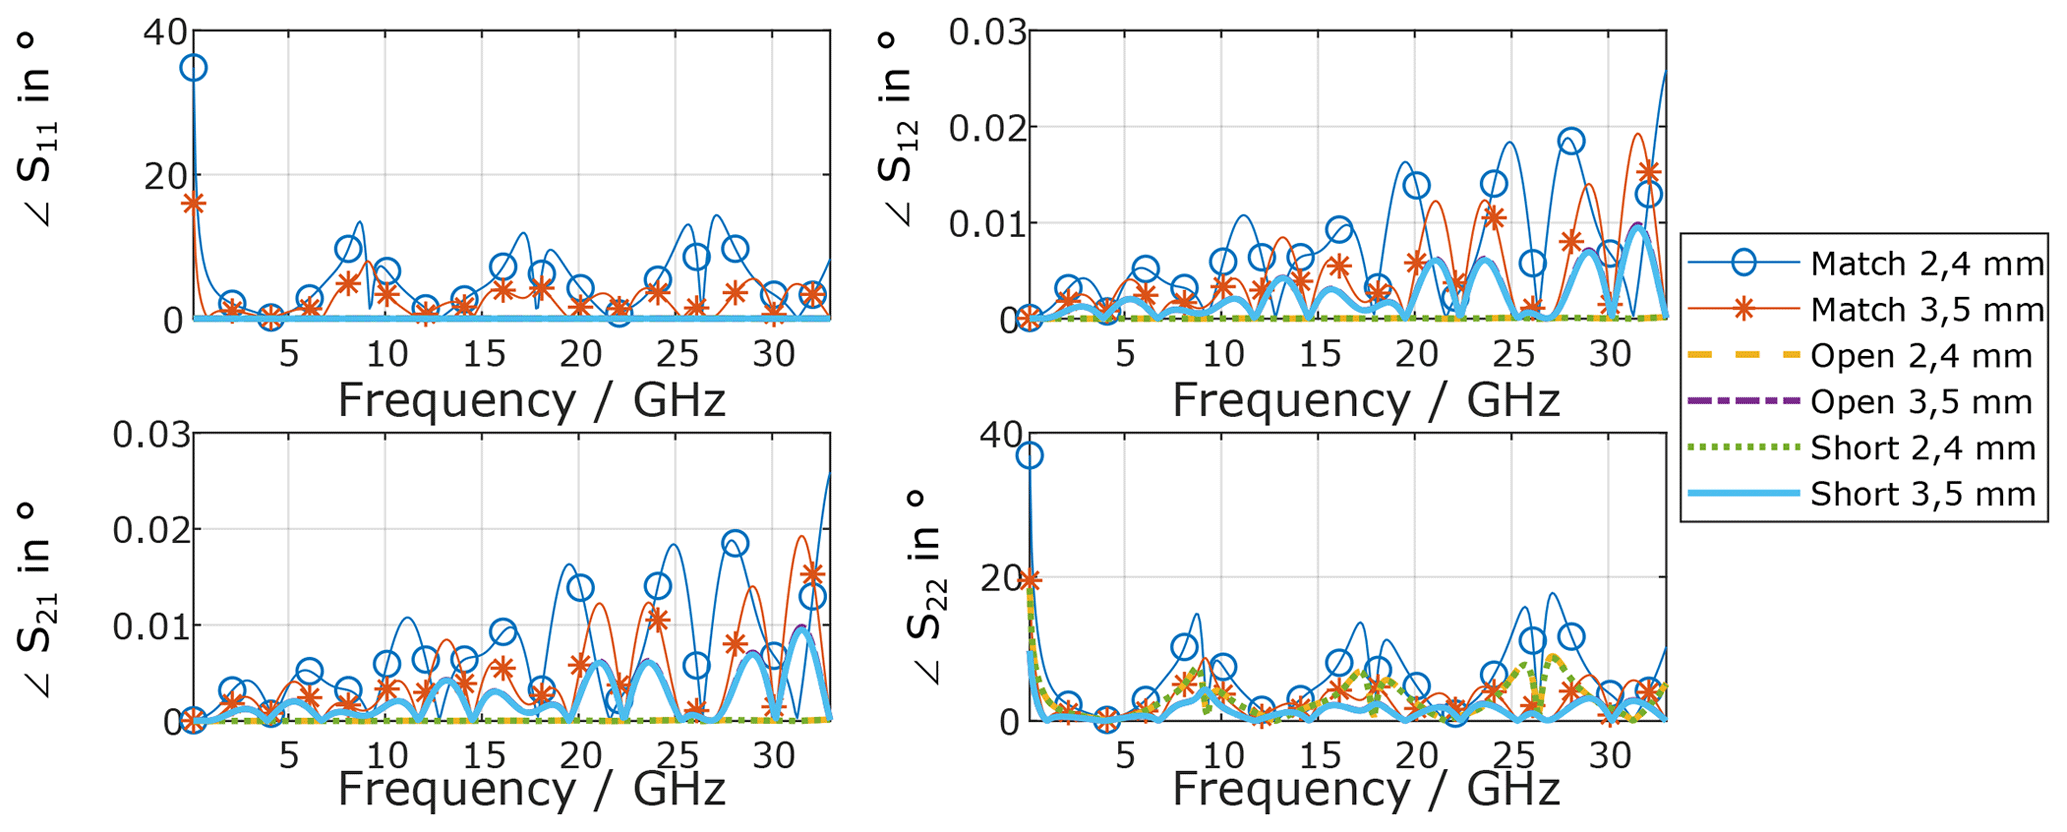
Figure 12Uncertainty budget (95 % confidence interval) for the adapter S-parameters phase, while assuming different uncertainties for both calibration standard types.
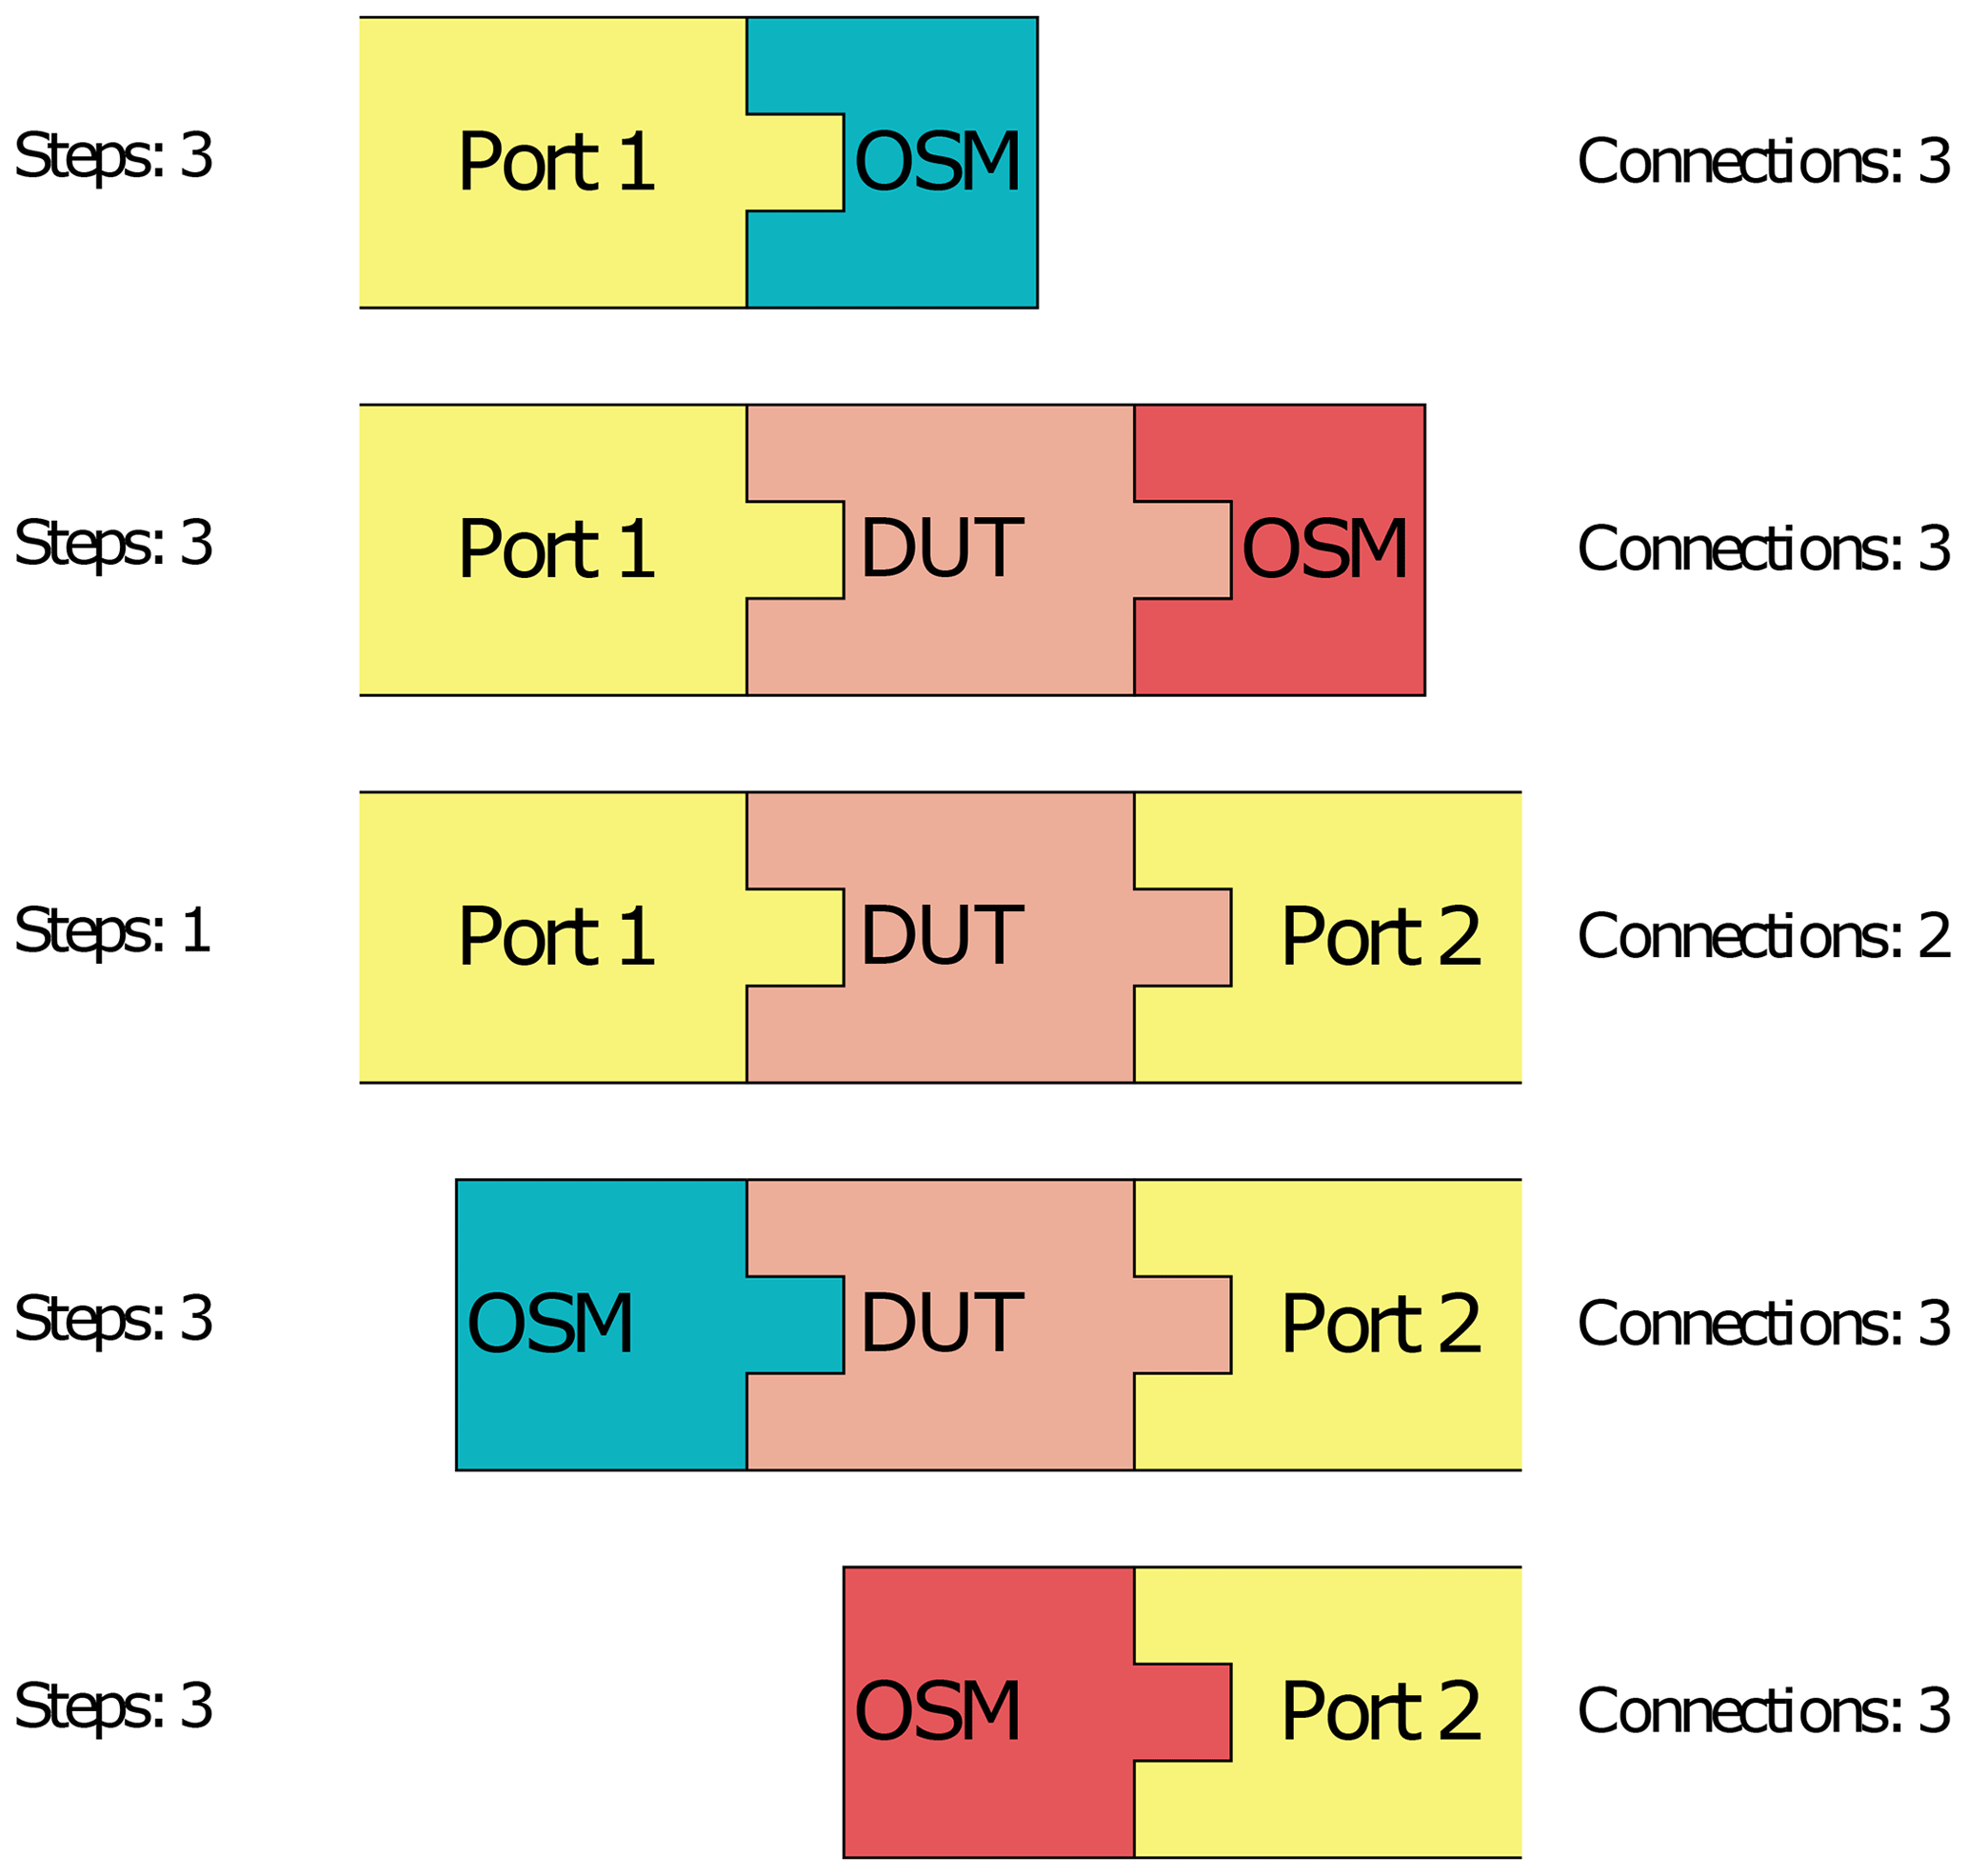
Figure 13Graphical representation of the complete measurement procedure. The colors blue and red indicate different interfaces and therefore different calibrations standards, each set mating with one side of the adapter to be characterized.
4.1 Procedure
To confirm the simulations results, measurements are carried out. Figure 13 shows the measurement procedure for the comparison of both methods. The order of steps are chosen in a way to have few connections and measurements overall and to use as many results for both methods as possible. Each connection and measurement is usually performed three to four times in practice, to enable an evaluation of the connection repeatability.
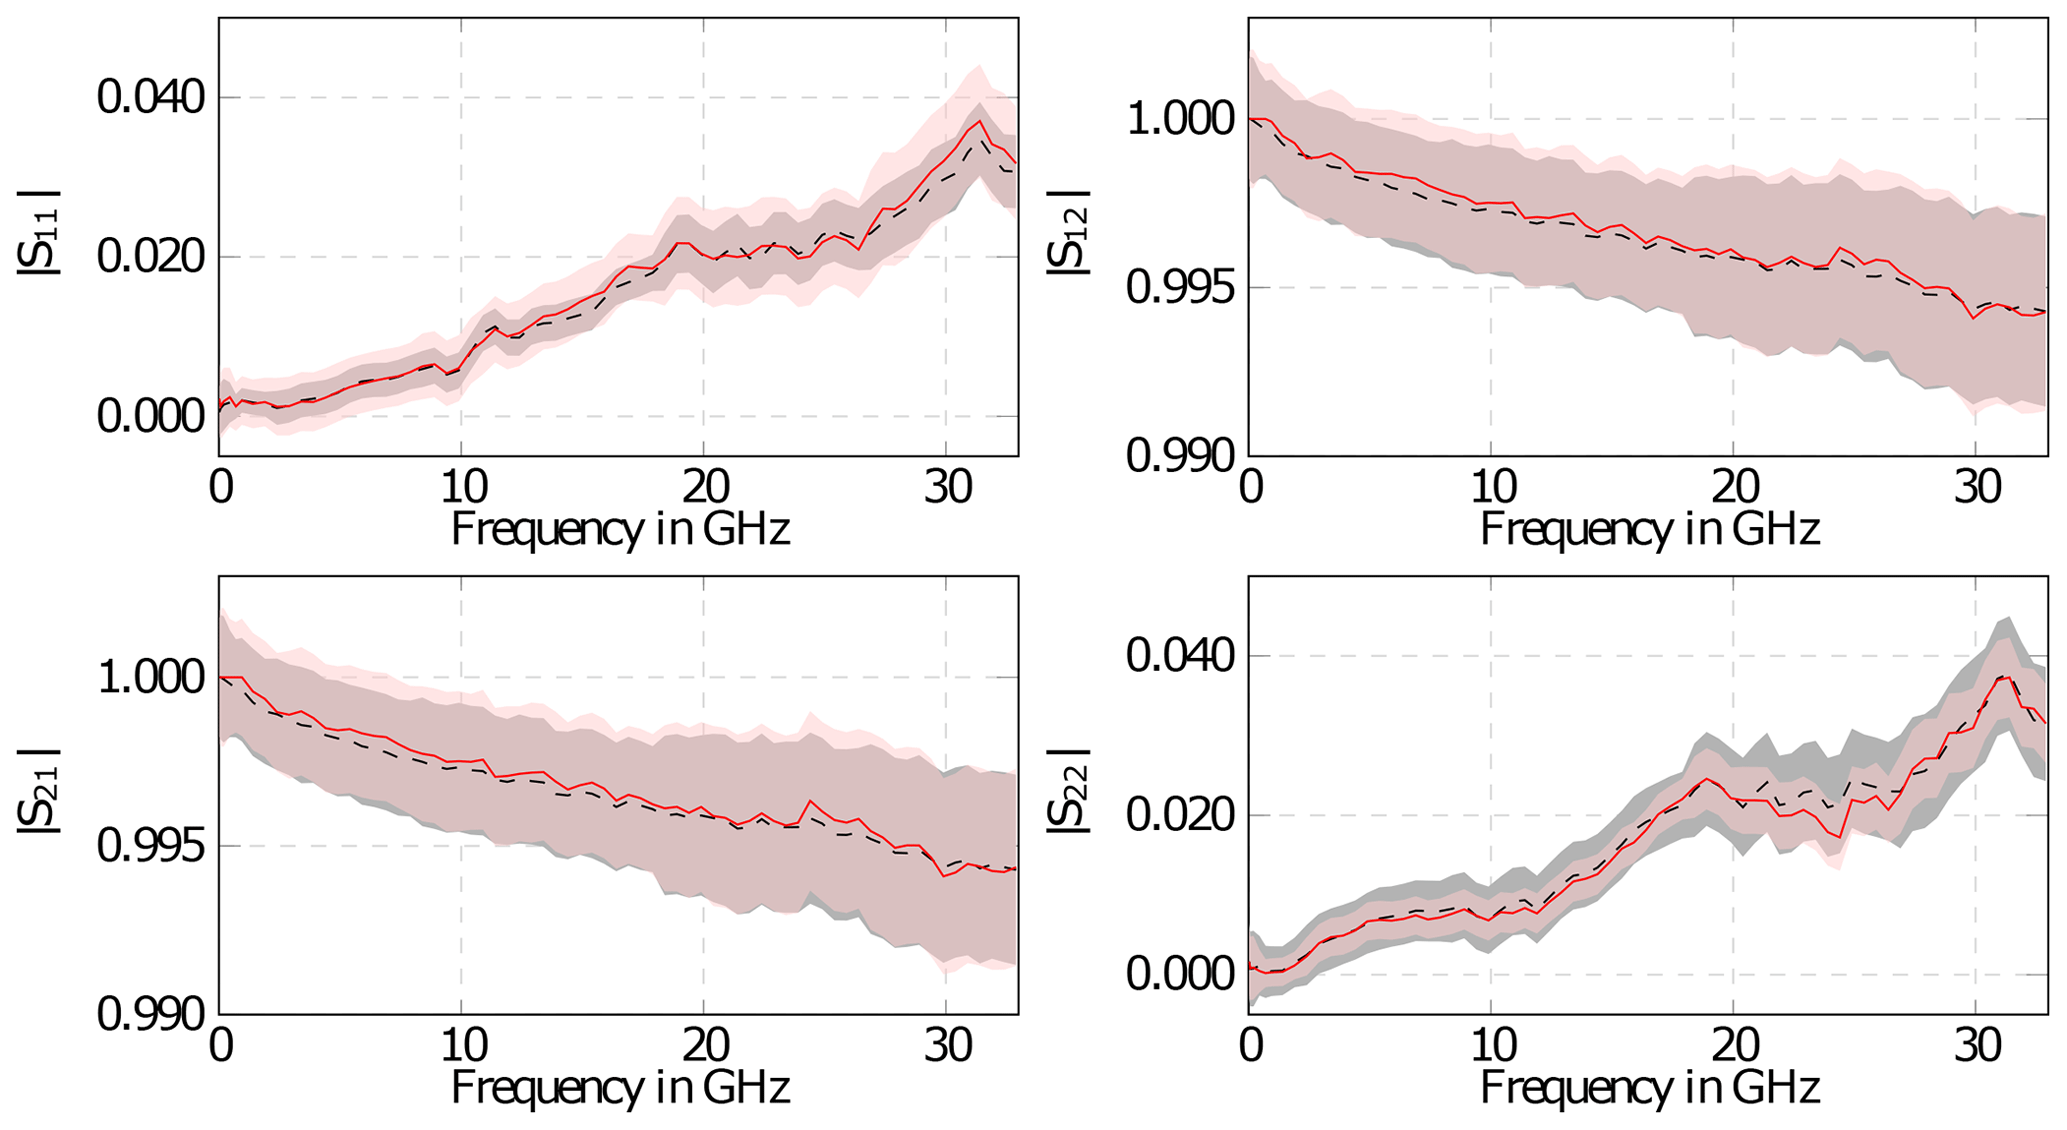
Figure 14Measurement results including MU for PC2.4 to PC3.5 mm (black-dashed OSM and red-solid UOSM).
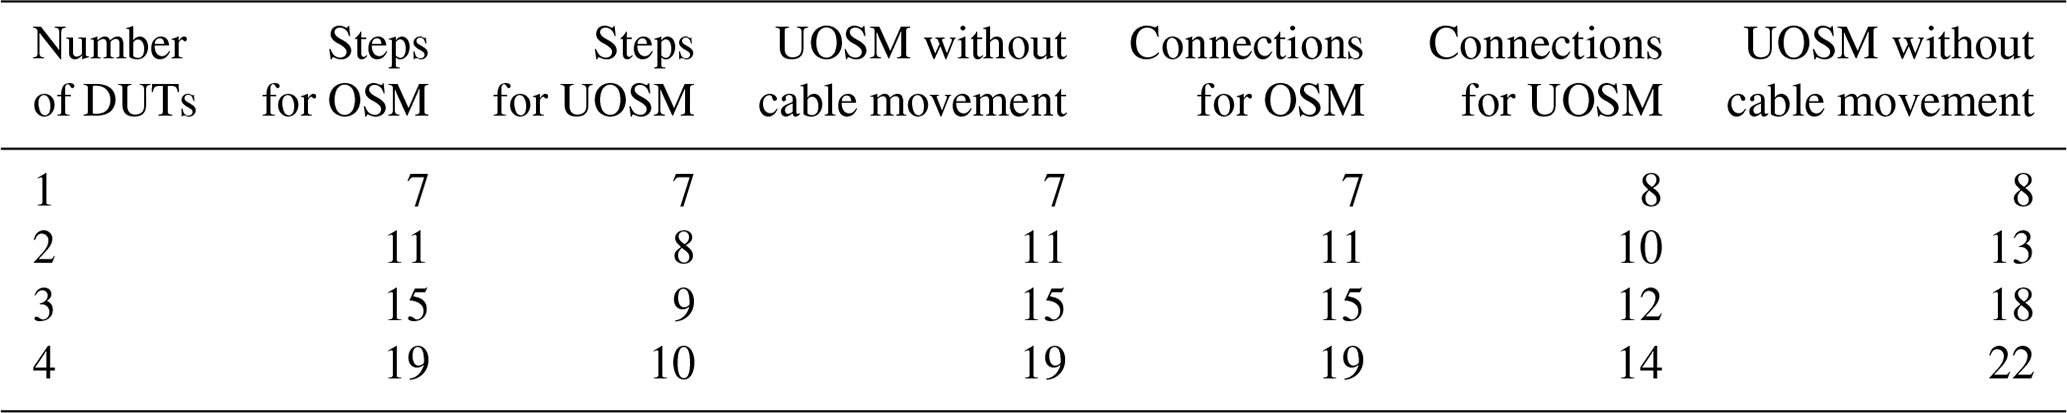
Table 3Necessary steps and connections for both calibration methods, when measuring multiple DUTs.
In the first step the OSM standards are measured at VNA Port 1. The results are used for the calibration in both methods. Afterwards the DUT is attached to the fist port and the second set of OSM standards are measured. These results are only used for the one-port method. For the UOSM method the DUT (adapter) is inserted, while only moving the cable at the second port. When disconnecting after this measurement, only the cable at Port 1 is moved and the measurements of the OSM calibration standards are repeated for the second port. This procedure avoids cable movements completely, to provide fair comparison conditions for both methods.
From this procedure, it can be clearly seen that is it not possible to measure more than one thru or two-port DUT consecutively, while still avoiding cable movements. If more than one two-port DUT needs to be measured, one set of one-port standards needs to be measured again at the VNA port, at which the cable was moved since the last measurement of the one-port standards. Otherwise, the MU due to cable movements are to be included.
4.2 Results
The measurements and evaluation for both the one-port and two-port calibration method are performed using Wollensack and Hoffmann (2019); Zeier et al. (2018). Including cable movements would cause only a minor change in the MU of the reflections parameters. But even with high quality cables (Moder and Schubert, 2022), the MU of the transmission parameters would generally increase by 0.001 or more in magnitude and several degrees in phase. Both magnitude and phase MU are a function of frequency, but the cable contribution would dominate over the complete frequency range.
The obtained measurement results for both methods are shown in Fig. 14. The MU (95 % confidence interval) indicated by the transparent area in the plot also includes VNA drift, VNA noise, VNA linearity and connection repeatability in addition to the MU of the calibration standards analyzed in the simulation in Sect. 3. During the measurement the one-port calibration method was started at Port 1 and the MU obtained in the measurement confirms the simulation results shown in Fig. 7 with a lower uncertainty for the OSM method at Port 1 and a higher one, when compared to the UOSM method at Port 2.
Table 2 shows the detailed MU budget of at 15 GHz for both calibration methods. Even with precise calibration standards used here, their contribution dominates the MU. Second largest influence is the connection repeatability, and the VNA itself plays a very minor MU role. The last point is due to the VNA beeing a high quality metrology grade device and beeing operated in a laboratory with excellent environmental control (temperature and humidity).
It can be concluded that the overall MU for both calibration methods is of comparable magnitude and that the uncertainties of the calibration standards are the main contributor, if cable movement is avoided. However, the number of required connections is not the same for both methods.
The number of required steps and connections for measuring up to four DUTs are summarized in Table 3. Here, one step is one measurement to be recorded and one connection is one physical connection to be made, resulting in two connections for a two-port DUT. As mentioned above, each of these connections is usually made three to four times to evaluate the repeatability (not shown in the table). For both methods the number of necessary connections rises quickly with the number of DUTs to be measured, if cable movements are avoided, to obtain a low MU. However, including cable movements the UOSM method becomes more efficient, when several DUTs are to be measured.
In addition to the time needed to perform a large number of connections also the wear on the used measurement adapter and the calibration standards should be considered. While several thousand connections are often possible with coaxial interfaces, the quality (repeatability) might start to degrade after a couple of hundred connections.
When measuring multiple DUTs while avoiding cable movements, new error networks must be derived and applied for each DUT. This is additional effort in evaluating the measurement and it is also somewhat error prone. For a large number of DUTs the UOSM method with cable movements is time efficient, results in less wear on the equipment and, as only one set of error networks is needed, the error correction is simpler. The MU however is increased due to the cable movements.
Both calibration methods compared in this paper are suitable to measure adapters and yield low MU. Depending on the required precision and e.g. allowing for cable movements, the UOSM method requires fewer connections and is therefore faster. Even with state of the art measurement cables, cable movements might increase the MU significantly and should be avoided or minimized.
Ultimately, the decision which method should be applied for adapter measurements is always a trade-off and depends on the desired MU, the expenditure of time and the wear on the laboratory equipment.
No software code or research data is available for the presented work, but all results can be reproduced with the equations and parameters given here.
KK had the idea, did the simulations, and wrote most of the manuscript. FG supported the evaluation of the measurement data and wrote parts of the manuscript. MT designed the experiment, carried it out, and prepared the results.
The contact author has declared that none of the authors has any competing interests.
Publisher’s note: Copernicus Publications remains neutral with regard to jurisdictional claims in published maps and institutional affiliations.
This article is part of the special issue “Kleinheubacher Berichte 2021”.
The authors would like to thank Florian Rausche for his support end expertise during the measurements and evaluation of the obtained data.
This open-access publication was funded by the Physikalisch-Technische Bundesanstalt.
This paper was edited by Madhu Chandra and reviewed by Madhu Chandra and one anonymous referee.
Daywitt, W. C.: First-Order Symmetric Modes for a Slightly Lossy Coaxial Transmission Line, IEEE T. Microw. Theory, 38, 1644–1650, https://doi.org/10.1109/22.60011, 1990. a
Ferrero, A. and Pisani, U.: Two-port network analyzer calibration using an unknown “thru”, IEEE Microw. Guided W., 2, 505–507, https://doi.org/10.1109/75.173410, 1992. a, b
Hiebel, M.: Grundlagen der vektoriellen Netzwerkanalyse, Rohde und Schwarz GmbH, 2nd edn., ISBN 978-3-939837-05-3, 2007. a, b
Marks, R. B.: Formulations of the Basic Vector Network Analyzer Error Model including Switch-Terms, in: 50th ARFTG Conference Digest, Portland, OR, USA, 4–5 December 1997, 32, 115–126, https://doi.org/10.1109/ARFTG.1997.327265, 1997. a
Mathworks: MATLAB 2019a, https://de.mathworks.com/ (last access: 17 February 2023), 2021. a
Moder, M. and Schubert, J.: Charaterization of RF and Microwave Measurement Cables Used with Vector Network Analyzers, Tech. Rep. 2, Microwave Journal, https://www.microwavejournal.com/articles/37588-characterization-of-rf-and-microwave-measurement-cables-used-with-vector-network-analyzers?page=1 (last access: 17 February 2023), 2022. a
Ruefenacht, J. and the METAS VNA gang: Adapter characterization up to 110 GHz, EMRP HF Circuits project: 6th European ANAMET meeting, slides, Teddington, UK, June 2016, https://doi.org/10.13140/RG.2.1.4947, 2016. a
Stumper, U.: Uncertainties of VNA S-parameter measurements applying the Short-Open-Load-reciprocal (SOLR) calibration method, in: 2008 Conference on Precision Electromagnetic Measurements Digest, Broomfield, CO, USA, 8–13 June 2008, 438–439, https://doi.org/10.1109/CPEM.2008.4574841, 2008. a
Wollensack, M. and Hoffmann, J.: METAS VNA Tools II – Math Reference V2.2.6, Tech. Rep. 2.2.6, METAS, Bern, Switzerland, https://www.metas.ch/dam/metas/en/data/Fachbereiche/Hochfrequenz/vna-tools/version262/VnaToolsMath V2.6.2.pdf.download.pdf/VnaToolsMath V2.6.2.pdf (last access: 17 February 2023), 2019. a
Working Group 1 of the Joint Committee for Guides in Metrology: Evaluation of measurement data – Guide to the expression of uncertainty in measurement, JCGM, https://www.bipm.org/documents/20126/2071204/JCGM_100_2008_E.pdf/cb0ef43f-baa5-11cf-3f85-4dcd86f77bd6 (last access: 17 February 2023), 2008. a
Zeier, M., Hoffmann, J., and Wollensack, M.: Metas.UncLib-a measurement uncertainty calculator for advanced problems, Metrologia, 49, 809–815, https://doi.org/10.1088/0026-1394/49/6/809, 2012. a
Zeier, M., Allal, D., and Judaschke, R.: Guidelines on the Evaluation of Vector Network Analysers (VNA), ISBN: 978-3-942992-51-0, 2018. a, b